Yesterday we mentioned that there are signs of a downward trend in the market. For this to develop ideally, we should see bearish candles today and tomorrow. Currently, we see a bullish candle, which does not meet our proposed conditions, but our conditions are only more favorable for a downward trend. Even if they are not met, it does not mean that a downward trend will not occur, and since we have not yet closed the line, we cannot draw conclusions at this point. Therefore, we suggest that both bulls and bears refrain from excessive operations.
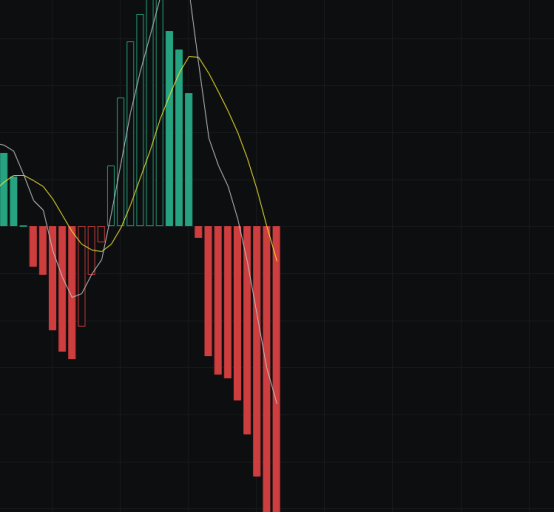
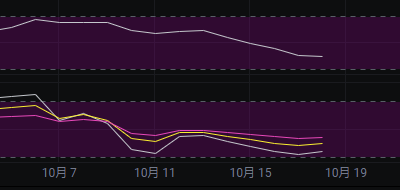
From the MACD perspective, with the current bullish candle, the energy bars show signs of stopping the decline, but the fast and slow lines are still moving downward. Thus, the fluctuations will not be very pronounced, and we do not recommend excessive operations.
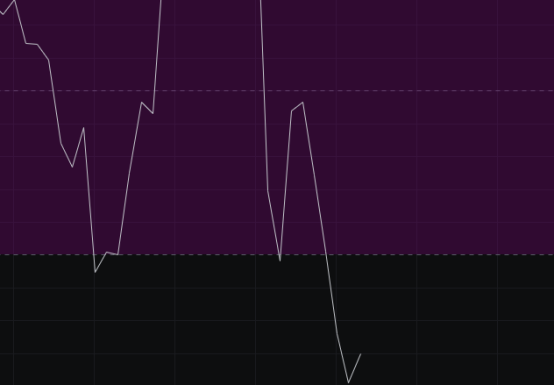
From the CCI perspective, there has been a slight pullback, but it is still far from the zero line. This minor pullback is negligible and does not fundamentally change the direction.
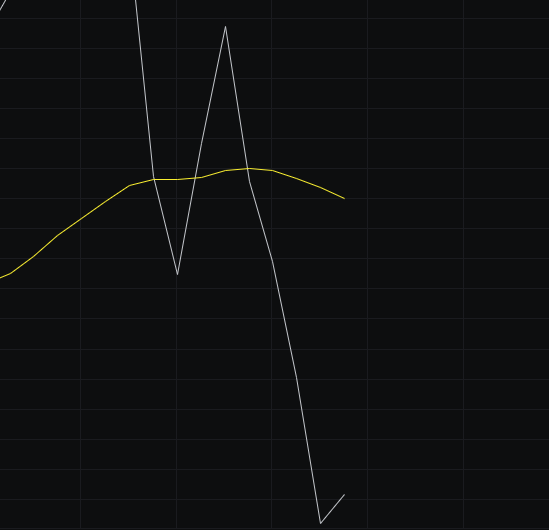
From the OBV perspective, there is a slight recovery, but the volume is insufficient, and the slow line is also moving downward, so the OBV still indicates a bearish trend.
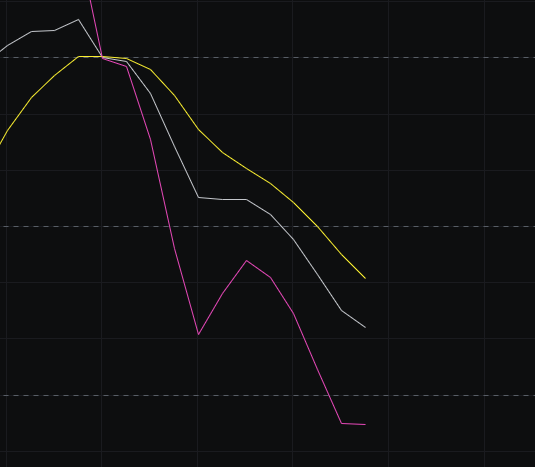
From the KDJ perspective, the KDJ continues to move downward. According to KDJ logic, it should aim for 20, and we will see if it stops declining or continues to drop when it approaches 20.
From the MFI and RSI perspectives, both indicators are in a weak zone and are trending downward, so this also indicates a bearish outlook.
From the moving averages perspective, several moving averages are generally in a downward pressure state, indicating a bearish trend.
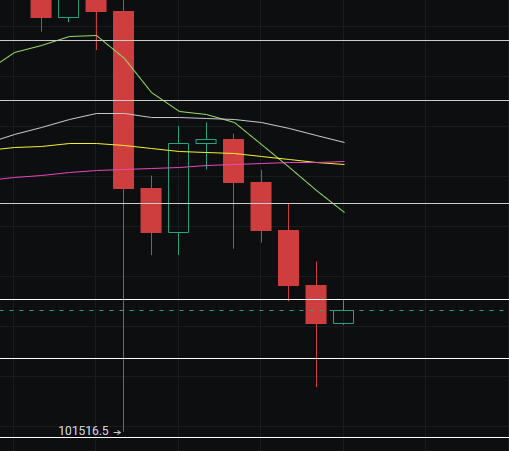
From the Bollinger Bands perspective, although we currently have a bullish candle, the Bollinger Bands are still widening, indicating a continued downward trend. Since it is developing towards a downward trend, we should continue to see bearish candles to support this trend, which creates a contradiction. Although there is a contradiction, it is also logical; it can be understood that the bullish volume is still insufficient to change the direction of the Bollinger Bands.
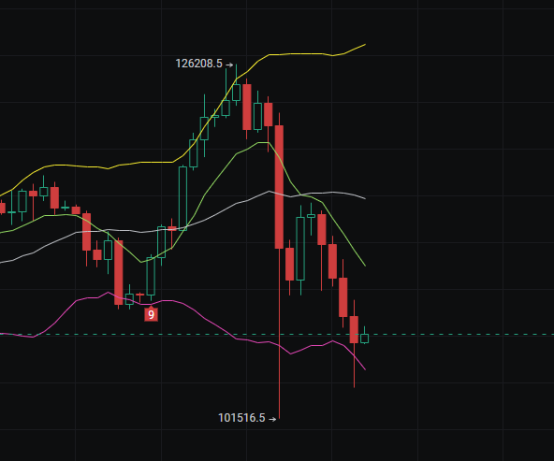
In summary: The market has seen a slight increase, but this increase is not enough to change the direction. Therefore, we do not recommend excessive operations at this point. Resistance is seen at 107500-109000, and support is at 105000-101500.
免责声明:本文章仅代表作者个人观点,不代表本平台的立场和观点。本文章仅供信息分享,不构成对任何人的任何投资建议。用户与作者之间的任何争议,与本平台无关。如网页中刊载的文章或图片涉及侵权,请提供相关的权利证明和身份证明发送邮件到support@aicoin.com,本平台相关工作人员将会进行核查。


