RSI (Relative Strength Index) is a classic technical analysis tool designed to measure the relative strength of market buying and selling forces, helping traders assess trends and potential turning points. In short time frames like 5 minutes, RSI can quickly respond to market fluctuations, making it particularly suitable for capturing short-term trading opportunities and aiding traders in making swift decisions. The value ranges from 0 to 100, and it is easy to understand and suitable for traders of different levels when combined with the boundaries of overbought (e.g., above 70) and oversold (e.g., below 30). RSI is applicable in stock, forex, futures, and cryptocurrency markets, demonstrating good universality.

1. RSI Signals: The Logic of Overbought and Oversold
1. Understanding Overbought and Oversold
When the RSI index exceeds 70, the market is in an overbought state, which may indicate that upward momentum is nearing exhaustion, posing a risk of correction or reversal; when it is below 30, the market is in an oversold state, which may signal a buying opportunity.
2. The Connection Between Overbought and Trend Peaks
Overbought signals typically reflect current market overheating, which may stem from excessive optimism or short-term trading overload. Traders can pay attention to these signals to identify potential selling points.
3. The Connection Between Oversold and Trend Bottoms
Oversold signals indicate that the market may be experiencing excessive pessimism, which could also present potential rebound opportunities. For short-term traders, this is a crucial moment to capture profits.
4. Performance in Short Time Frames
In short time frames like 5 minutes, overbought and oversold signals can provide higher sensitivity, helping to capture micro trading opportunities.
In this custom indicator, the relevant overbought and oversold parameters are as follows:
Overbought: 70
Oversold: 10
2. Signal Effect

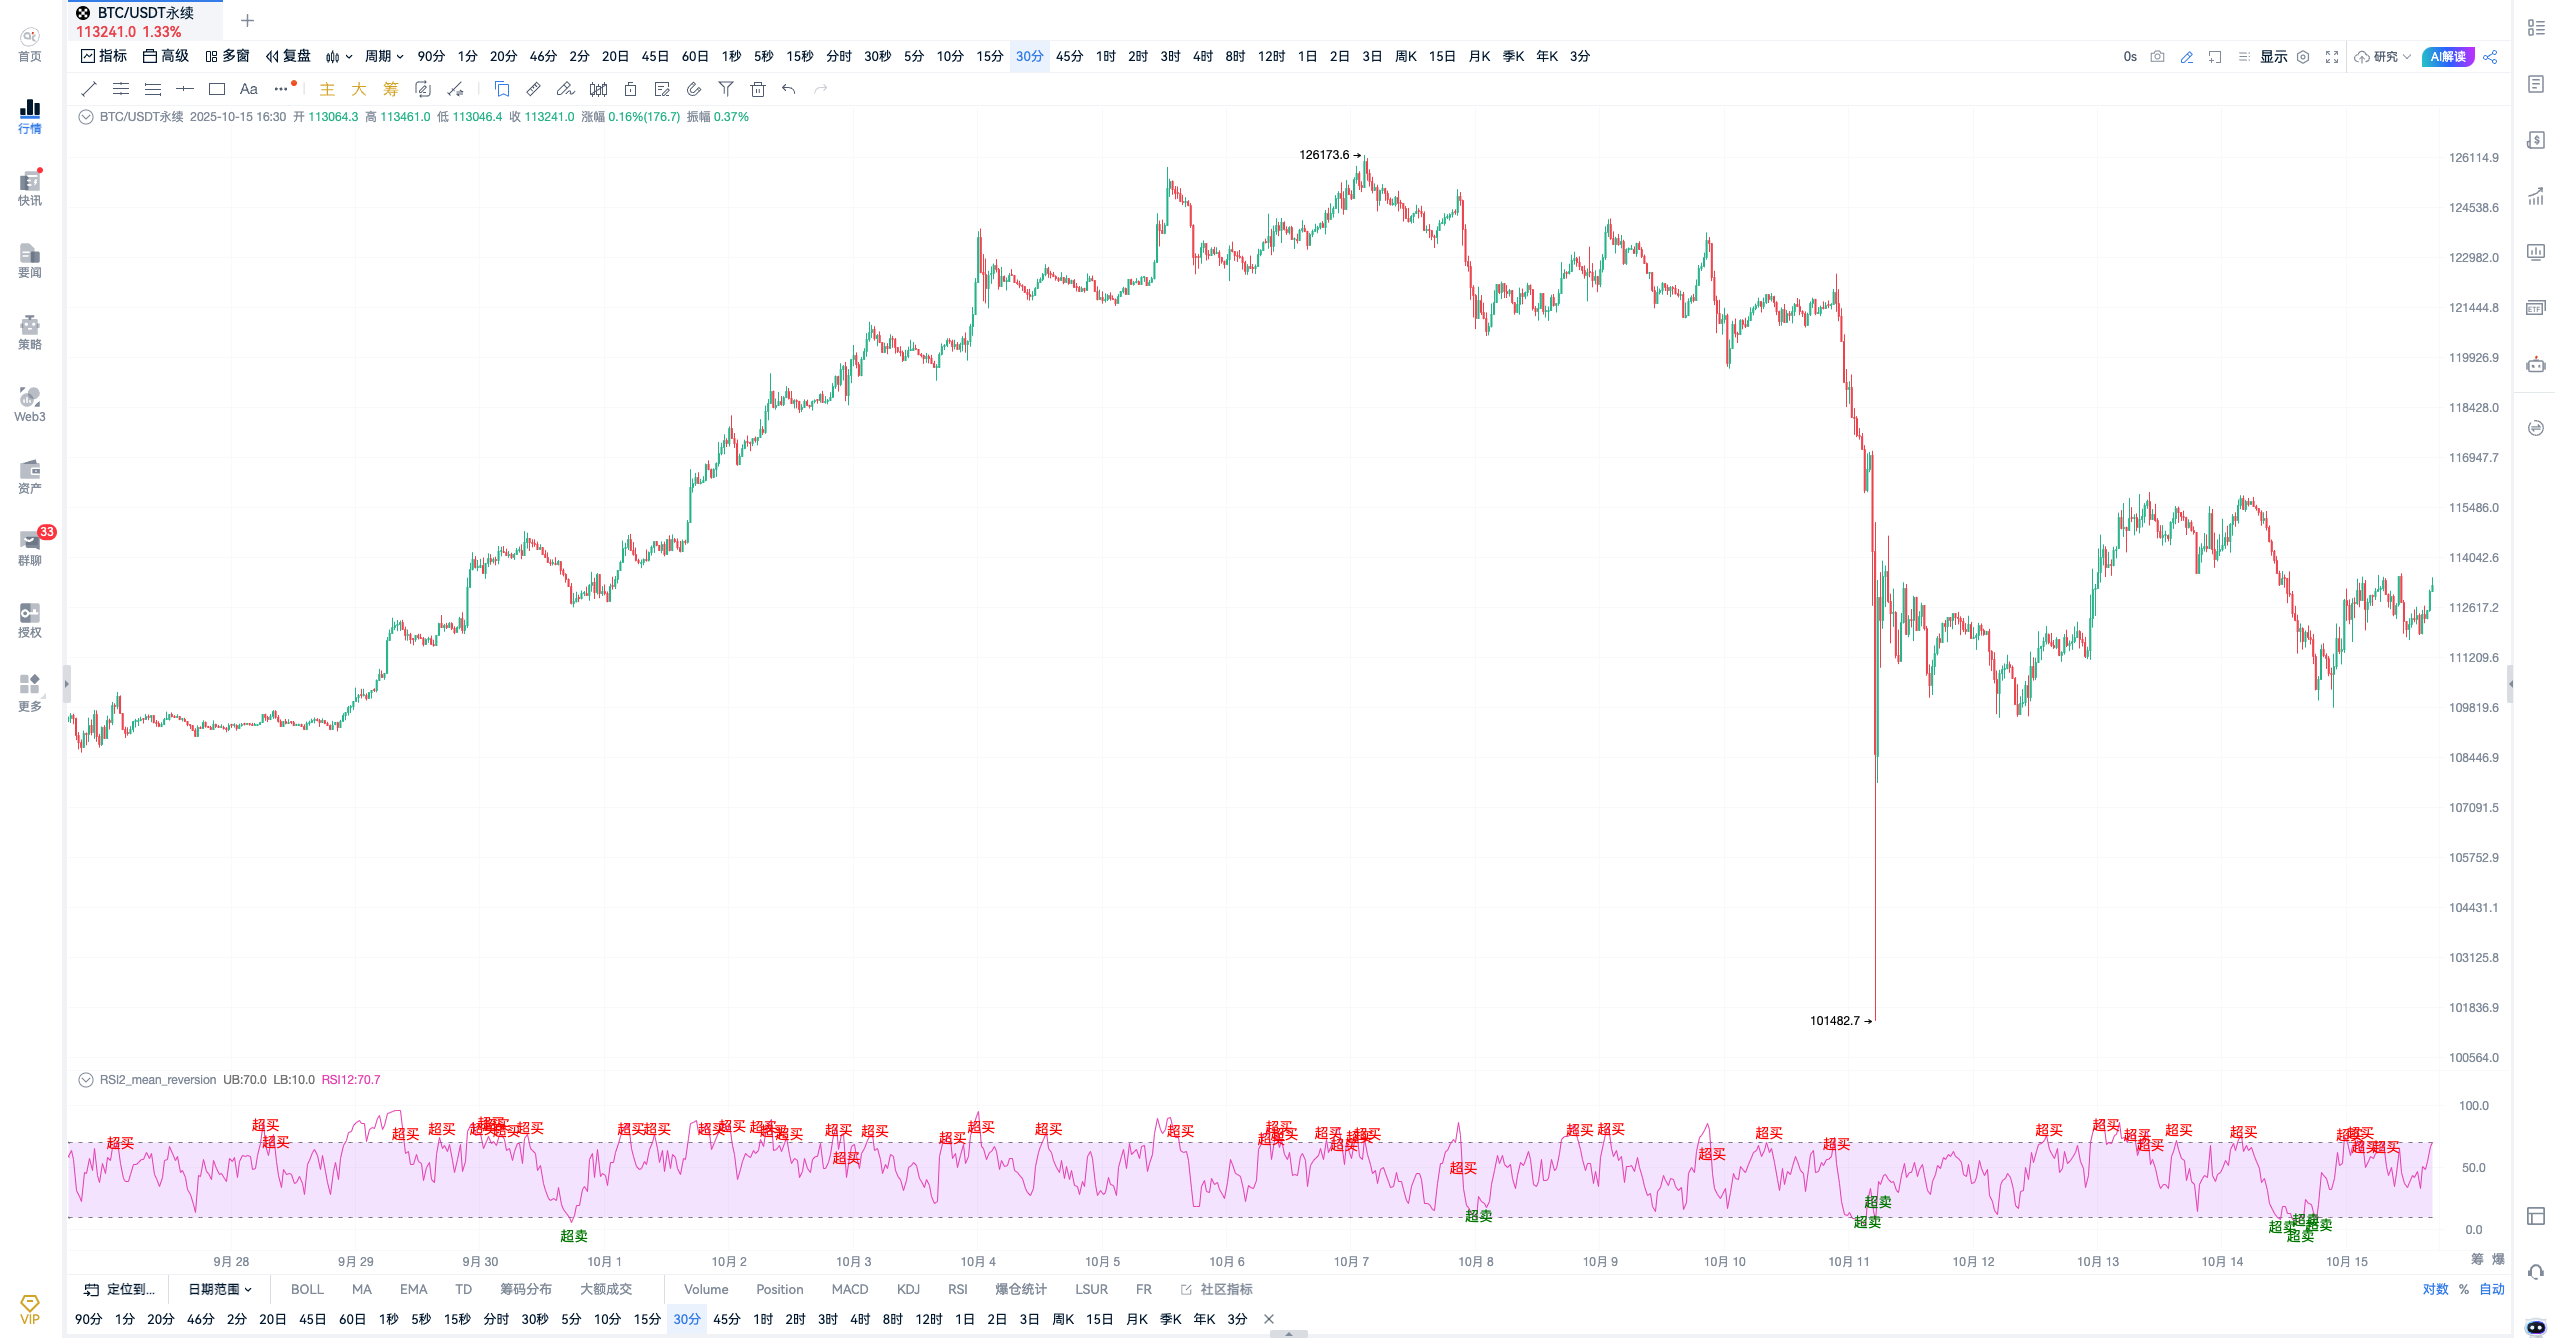
(Image: OKX-BTCUSDT Perpetual Contract)

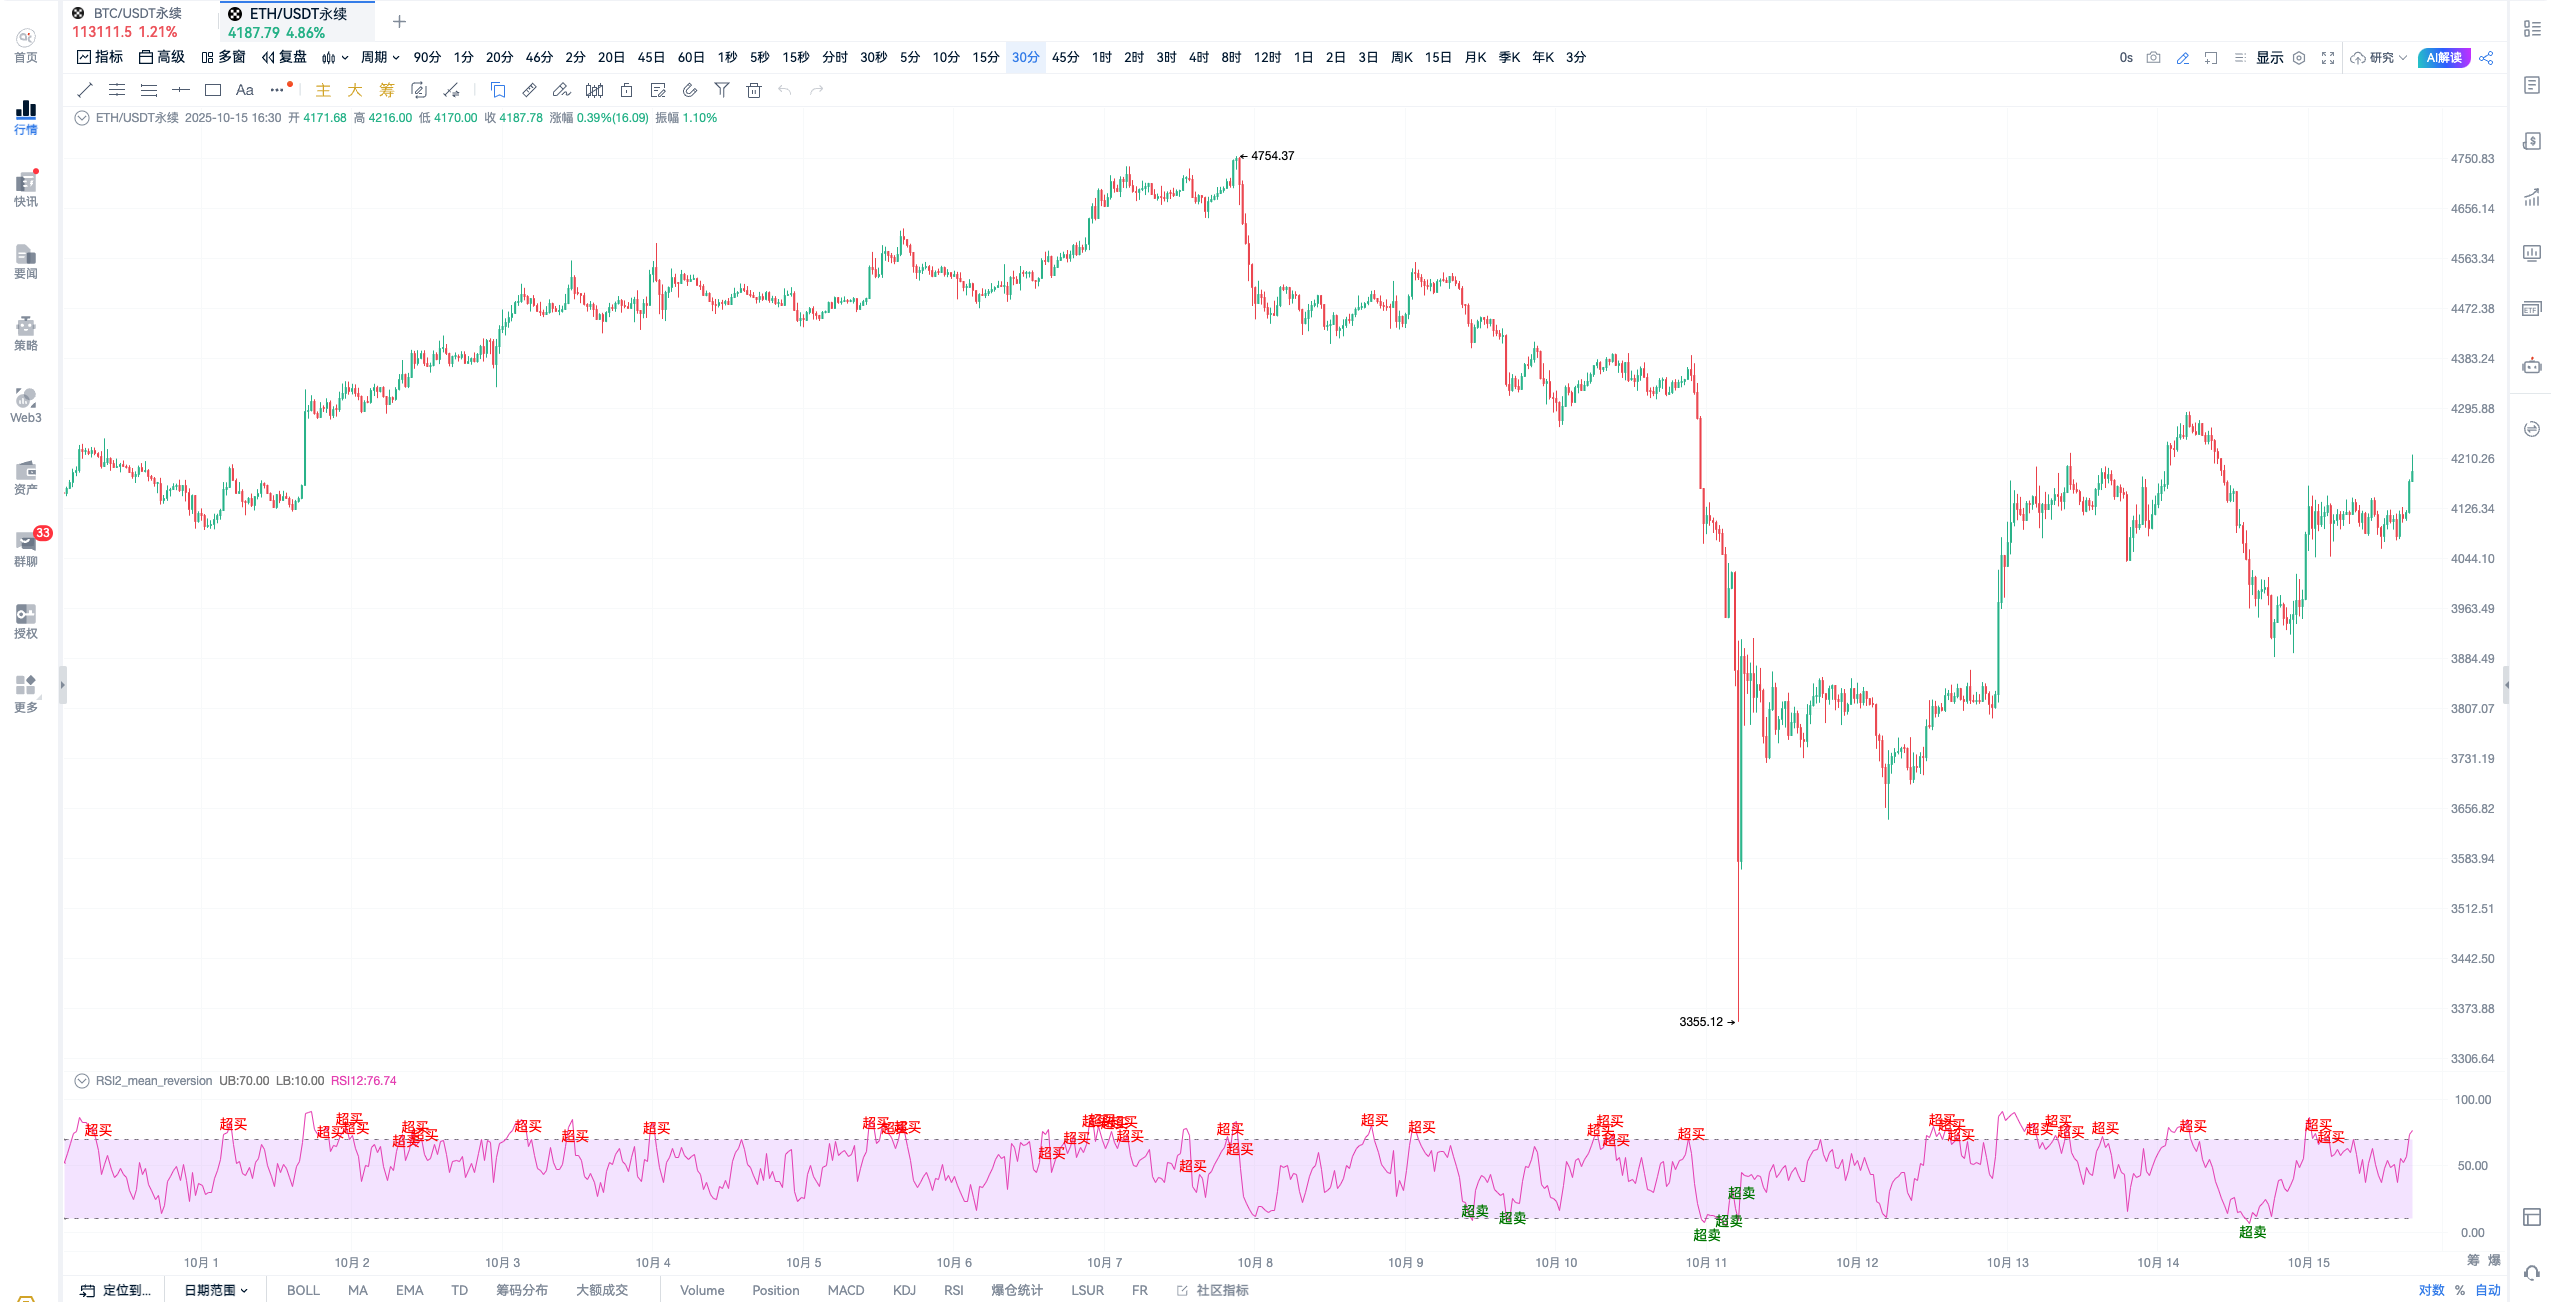
(Image: OKX-ETHUSDT Perpetual Contract)
Signal Performance:
The overbought and oversold signals of the 5-minute RSI can almost accurately hit the key highs and lows in market fluctuations.
3. Custom Indicator · Source Code
// This indicator was created by AICOIN Research Institute. If you encounter any usage issues, you can join the indicator community for consultation.
// @version=2
// Define parameters
length=6
ub = 70
lb = 10
// Calculate the value of RSI
u = smma(max(close-close[1], 0), length)
d = smma(-min(close-close[1], 0), length)
rsi12 = d == 0 ? 100 : (u == 0 ? 0 : 100 * (u / (u + d)))
// Calculate conditions
issell = crossdown(rsi12, ub)
isbuy = crossup(rsi12, lb)
// Define alert conditions for use in the alert window
alertcondition(issell, title="RSI(12) Overbought", direction="sell")
alertcondition(isbuy, title="RSI(12) Oversold", direction="buy")
// Plot on the chart
plot(ub, title="UB", lineDash=[4, 6], color="grey")
plot(lb, title="LB", lineDash=[4, 6], color="grey")
fill(ub, lb)
plot(rsi12, title="RSI12")
plotText(issell, title="RSI Overbought", text='Overbought', color='red', refSeries=rsi12, placement='top')
plotText(isbuy, title="RSI Oversold", text='Oversold', color='green', refSeries=rsi12, placement='bottom')
// Buy
exitShort(isbuy, price='market', amount=1)
enterLong(isbuy, price='market', amount=1)
// Sell
exitLong(issell, price='market', amount=1)
enterShort(issell, price='market', amount=1)
4. Conclusion
The RSI indicator is an essential tool for short-term trading!
- The RSI demonstrates good sensitivity and adaptability in the 5-minute trading cycle, making it an important reference tool for short-term trading.
- Overbought and oversold signals provide clear trading direction guidance, aiding precise decision-making.
- By customizing RSI settings and leveraging the support features of platforms like OKX, traders can better control market changes.
- Although RSI has its advantages, traders still need to conduct comprehensive analysis by considering overall trends, market structure, and fundamental data.
Quick and efficient short-term RSI signals are indispensable tools for every short-term trader in the modern market!
Join our community to discuss and grow stronger together!
Official Telegram community: t.me/aicoincn
AiCoin Chinese Twitter: https://x.com/AiCoinzh
Group chat - Wealth Group:
https://www.aicoin.com/link/chat?cid=10013
免责声明:本文章仅代表作者个人观点,不代表本平台的立场和观点。本文章仅供信息分享,不构成对任何人的任何投资建议。用户与作者之间的任何争议,与本平台无关。如网页中刊载的文章或图片涉及侵权,请提供相关的权利证明和身份证明发送邮件到support@aicoin.com,本平台相关工作人员将会进行核查。


