Original Author: BitMEX
To make a long story short:
With the explosive growth of decentralized derivatives platforms like Hyperliquid and the introduction of Pendle funding rate trading, the cryptocurrency funding rate market is continuously evolving. Specifically, two structural forces can be attributed to the dynamics of the funding rate market, creating predictable trading opportunities:
1. Formula Anchor Point (Lower Bound): The perpetual swap contract formula incorporates an interest rate component, forcing rates to cluster around 0.01% (positive bias). Data shows that over 92% of funding rates were positive in Q3 2025.
- Trader Action: Do not bet on sustained negative rates. The formula is actively pushing rates higher.
2. Arbitrage Capital (Upper Bound): Billions of institutional capital, including participants like Ethena, immediately short high-premium contracts when rates surge.
- Trader Action: Do not expect high rates to persist. The surge is temporary, as arbitrage activity quickly pushes premiums and rates back to the 0.01% baseline.
Compared to Binance and Hyperliquid, BitMEX's funding rates are the most stable, hitting the 0.01% anchor point more frequently than other exchanges. In terms of volatility, ETH's beta is higher than BTC's.
To succeed in funding rate trading, one must master market structure rather than market sentiment.
Introduction
Nine years ago, BitMEX invented the perpetual contract, fundamentally changing how people trade cryptocurrencies. In our previous Q2 derivatives report “The Evolution of Funding Rates: A Nine-Year Analysis of BitMEX XBTUSD Funding Rates”, we detailed its evolution from a highly volatile speculative tool to a mature and stable market. Now, we are witnessing the next phase of this evolution: the emergence of a dedicated funding rate trading market.
Funding rate trading allows traders to speculate on prices and trade the underlying mechanisms of the market itself. But what drives these mechanisms? In this report, we will delve into the dynamics of the perpetual contract market and the funding rate formula, providing crucial insights for cryptocurrency traders.
Our findings highlight two powerful factors influencing funding rates: the gravitational pull of the 0.01%/8-hour funding rate formula anchor and the immense power of institutional arbitrage capital enforcing this formula. This report will explore these findings based on Q3 2025 data and provide traders with key takeaways based on this structural understanding.
A Nine-Year Review of Funding Rate Evolution
As discussed in previous reports, the cryptocurrency funding rate market for major tokens like Bitcoin has matured. During the early bull market periods of perpetual contracts, Bitcoin funding rates often exceeded 0.2%/8 hours, equivalent to an annualized rate of over 200%.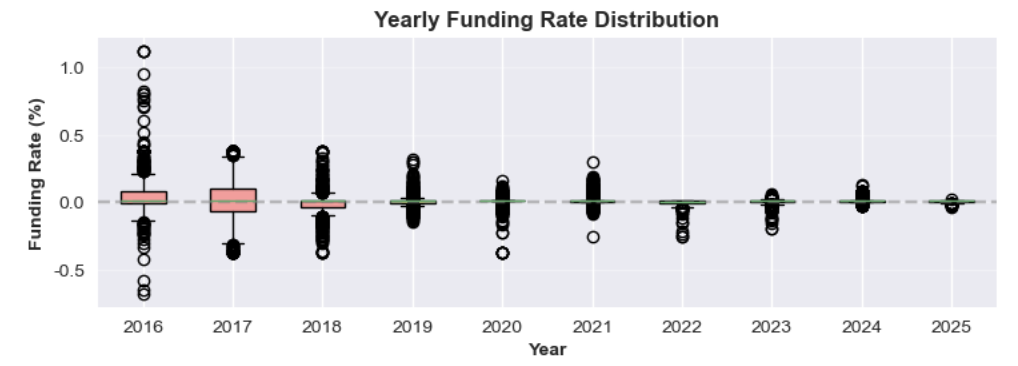
Figure 1: Annual Funding Rate Distribution from 2016 to 2025
Over the years, as the market deepened and more institutional capital flowed in, this volatility gradually diminished. The 2024-2025 cycle established a new norm: the average funding rate currently hovers around the baseline of 0.01%/8 hours. This occurs when perpetual contract premiums are extremely low, causing rates to default to their interest rate component—an indicator of systemic efficiency in financial markets.
Analyzing the Structure of Funding Rates
Why has the funding rate market undergone such drastic changes? This phenomenon can be explained by two key factors:
The funding rate formula stipulates that when the deviation between the perpetual contract price and the spot price is minimal, the rate defaults to the benchmark rate of 0.01%/8 hours.
A significant amount of capital is used for basis trading to capture high funding rates.
Let’s explore these concepts in more detail.
Factor 1: Formula Anchor Point (Hidden Positive Bias)
The funding rate of perpetual contracts is designed to align the contract price with the spot price of the underlying asset. At BitMEX and some other exchanges, the funding rate is calculated every eight hours, with the formula comprising two main components: the premium index and the interest rate, balanced through a clamping mechanism.
The universal funding rate formula for exchanges like BitMEX, Binance, and Hyperliquid is:
F=P+clamp(I−P,−0.05%,0.05%)
Here’s a detailed explanation of each part of the formula.
- Funding Rate (F): The amount periodically paid between long and short holders of the perpetual swap contract.
- Average Premium Index (P): Measures market sentiment by tracking the difference between the perpetual contract price and the spot price, calculated as an average over the funding rate period.
○ If P is positive, it indicates the contract is trading at a premium (above the spot price). Long positions pay short positions.
○ If P is negative, it indicates the contract is trading at a discount (below the spot price). Short positions pay long positions.
- Interest Rate (I): A fixed rate, typically set at 0.01% for 8 hours (or an annual rate of 10.95%). 0.01% was initially set by BitMEX as an arbitrary number to incentivize arbitrage traders to provide liquidity.
- Clamping Function clamp(x, min, max): A buffering mechanism to ensure that the difference between the interest rate and the premium index (I−P) does not become too large. The upper limit of the difference is +0.05%, and the lower limit is -0.05%, to prevent excessive fluctuations in the funding rate.
Scenario 1: Slight Premium/Discount, Funding Rate = 0.01%/8 Hours
A key feature of this formula is its ability to stabilize the funding rate at the benchmark rate (0.01%) when the market is relatively calm.
Golden Rule: As long as the average premium index (P) remains within the range of -0.04% to +0.06%, the funding rate (F) will be exactly 0.01%.
Within this range, the Clamp function perfectly offsets the premium or discount, causing the funding rate to default back to the interest rate.
Example A: Slight Premium
Assume the average premium index (P) is +0.02%.
1. Calculate the Difference: I−P=0.01%−0.02%=−0.01%
2. Apply the Clamping Function: Since -0.01% is within the [-0.05%, +0.05%] range, the clamped value is -0.01%.
3. Calculate the Final Interest Rate: F=P+(clamped value)=0.02%+(−0.01%)=0.01%
Example B: Slight Discount
Now, assume the average premium index (P) is -0.03%.
1. Calculate the Difference: I−P=0.01%−(−0.03%)=0.04%
2. Apply the Clamping Function: Since 0.04% is within the [-0.05%, +0.05%] range, the clamped value is 0.04%.
3. Calculate the Final Interest Rate: F=P+(clamped value)=−0.03%+0.04%=0.01%
Both examples demonstrate that regardless of whether the average premium index (P) is slightly above or below the funding rate, the final interest rate remains at 0.01%.
Scenario 2: Positive Bias (Positive Funding Rate During Discount Period)
A key point in the design of many perpetual contracts is their inherent positive bias. This means that even if the contract trades at a slight discount, long positions typically still pay a small fee to short positions. This is because the fixed positive interest rate (I=0.01%) acts as a lower bound.
This also explains why funding rates are often a small positive number (e.g., 0.005%) rather than negative.
Example: Positive Funding Rate for Discounted Perpetual Contract
Assume the market is bearish, and the average premium index (P) drops to -0.045%.
1. Calculate the Difference: I−P=0.01%−(−0.045%)=0.055%
2. Apply the Clamping Function: The difference of 0.055% exceeds the upper limit of the clamping function. Therefore, the clamping function forces this value down to the maximum of 0.05%.
3. Calculate the Final Rate: F=P+(clamped value)=−0.045%+0.05%=0.005%
In this example, even though the perpetual contract's trading price is below the spot price, the funding rate remains positive. Longs are still paying shorts, indicating a structural preference favoring shorts with positive bias.
Scenario 3: When Funding Rate Becomes Zero or Negative
To make the funding rate neutral or negative, the market discount must be significant enough to overcome the positive bias from the interest rate.
- When the premium index (P) is exactly -0.05%, the funding rate becomes 0.00%.
○ I−P=0.01%−(−0.05%)=0.06%
○ The clamped value will set its upper limit to 0.05%.
○ F=P+(clamped value)=−0.05%+0.05%=0.00%
● When the average premium index (P) drops below -0.05%, the funding rate becomes negative. For example, if P=−0.10%, the funding rate will turn negative, and shorts will begin paying longs to incentivize buying, pushing the contract price back toward the spot price.
Factor 2: Massive Funding Rate Arbitrage Capital
The funding rate formula defines the rules, while arbitrage capital is responsible for enforcing those rules. Currently, the open interest in major tokens (Bitcoin, Ethereum, Solana) across major cryptocurrency exchanges has reached hundreds of billions of dollars. From proprietary trading firms to DeFi protocols like Ethena, arbitrage participants have billions of dollars at their disposal, ready to be deployed as soon as funding rates become attractive. When perpetual contract prices exhibit high premiums, these institutions will sell perpetual contracts and buy spot assets to capture high funding rates, thereby compressing the premium. 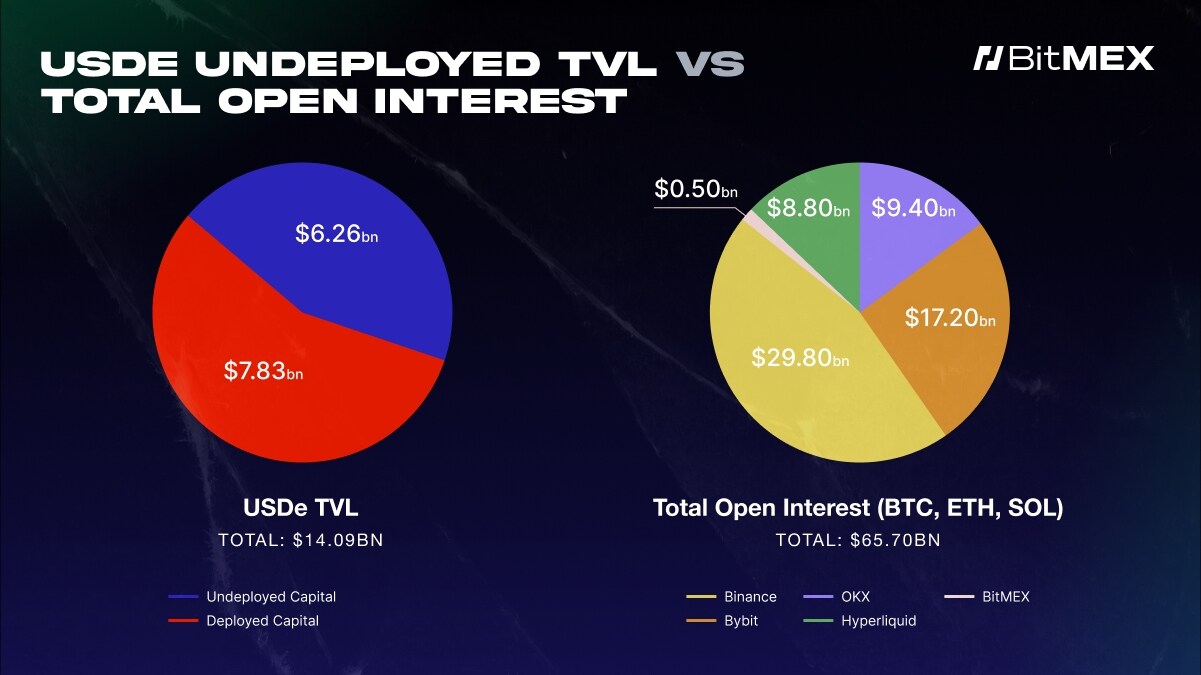
Figure 2: Total Value Locked in Ethena (USDe) on September 25, 2025, Compared to Total Open Interest in BTC, ETH, and SOL Across Major Cryptocurrency Exchanges
Figure 2 clearly illustrates how Ethena's USDe (a major funding rate arbitrage platform) plays a significant role in explaining the transient high funding rates. The pie chart on the left shows that Ethena (USDe) has $7.83 billion in deployable capital. The pie chart on the right displays the total open interest across major exchanges (as of September 21, 2025), amounting to $65.7 billion. Comparing the two pie charts, it is evident that a single protocol like Ethena plays a massive role—with its undeployed capital amounting to 12% of the market's open interest.
Whenever funding rates become attractive, institutions deploy their available capital to profit. This arbitrage strategy compresses high funding rates.
In short, the large pool of undeployed capital acts as a ceiling for funding rates, preventing them from remaining high for extended periods.
Practical Insights: Q3 2025 Funding Rate Review
To analyze whether the theories regarding the lower and upper limits of funding rates hold true, we examined the funding rate data from BitMEX, Binance, and Hyperliquid for Q3 2025. This confirmed the two core theories discussed in the previous section:
1. Funding rates remain positive for the vast majority of the time, driven by the structural positive bias in the calculation formula.
2. Funding rates rarely sustain levels far above the 0.01% baseline, as substantial arbitrage capital from institutions like Ethena intervenes to compress high premiums.
Figures 3 and 5 show the historical funding rates for BTC and ETH in Q3 2025, confirming our two core findings. First, the funding rates on these three platforms remained positive for the vast majority of the quarter, a direct result of the formula's structural positive bias. Second, it indicates that the funding rates on BitMEX and Binance have consistently anchored around the 0.01% baseline, reflecting the powerful effect of arbitrage capital.
Notable exceptions include Hyperliquid, where funding rates exhibit significant volatility and often spike well above the baseline—this phenomenon will be analyzed in the next section. 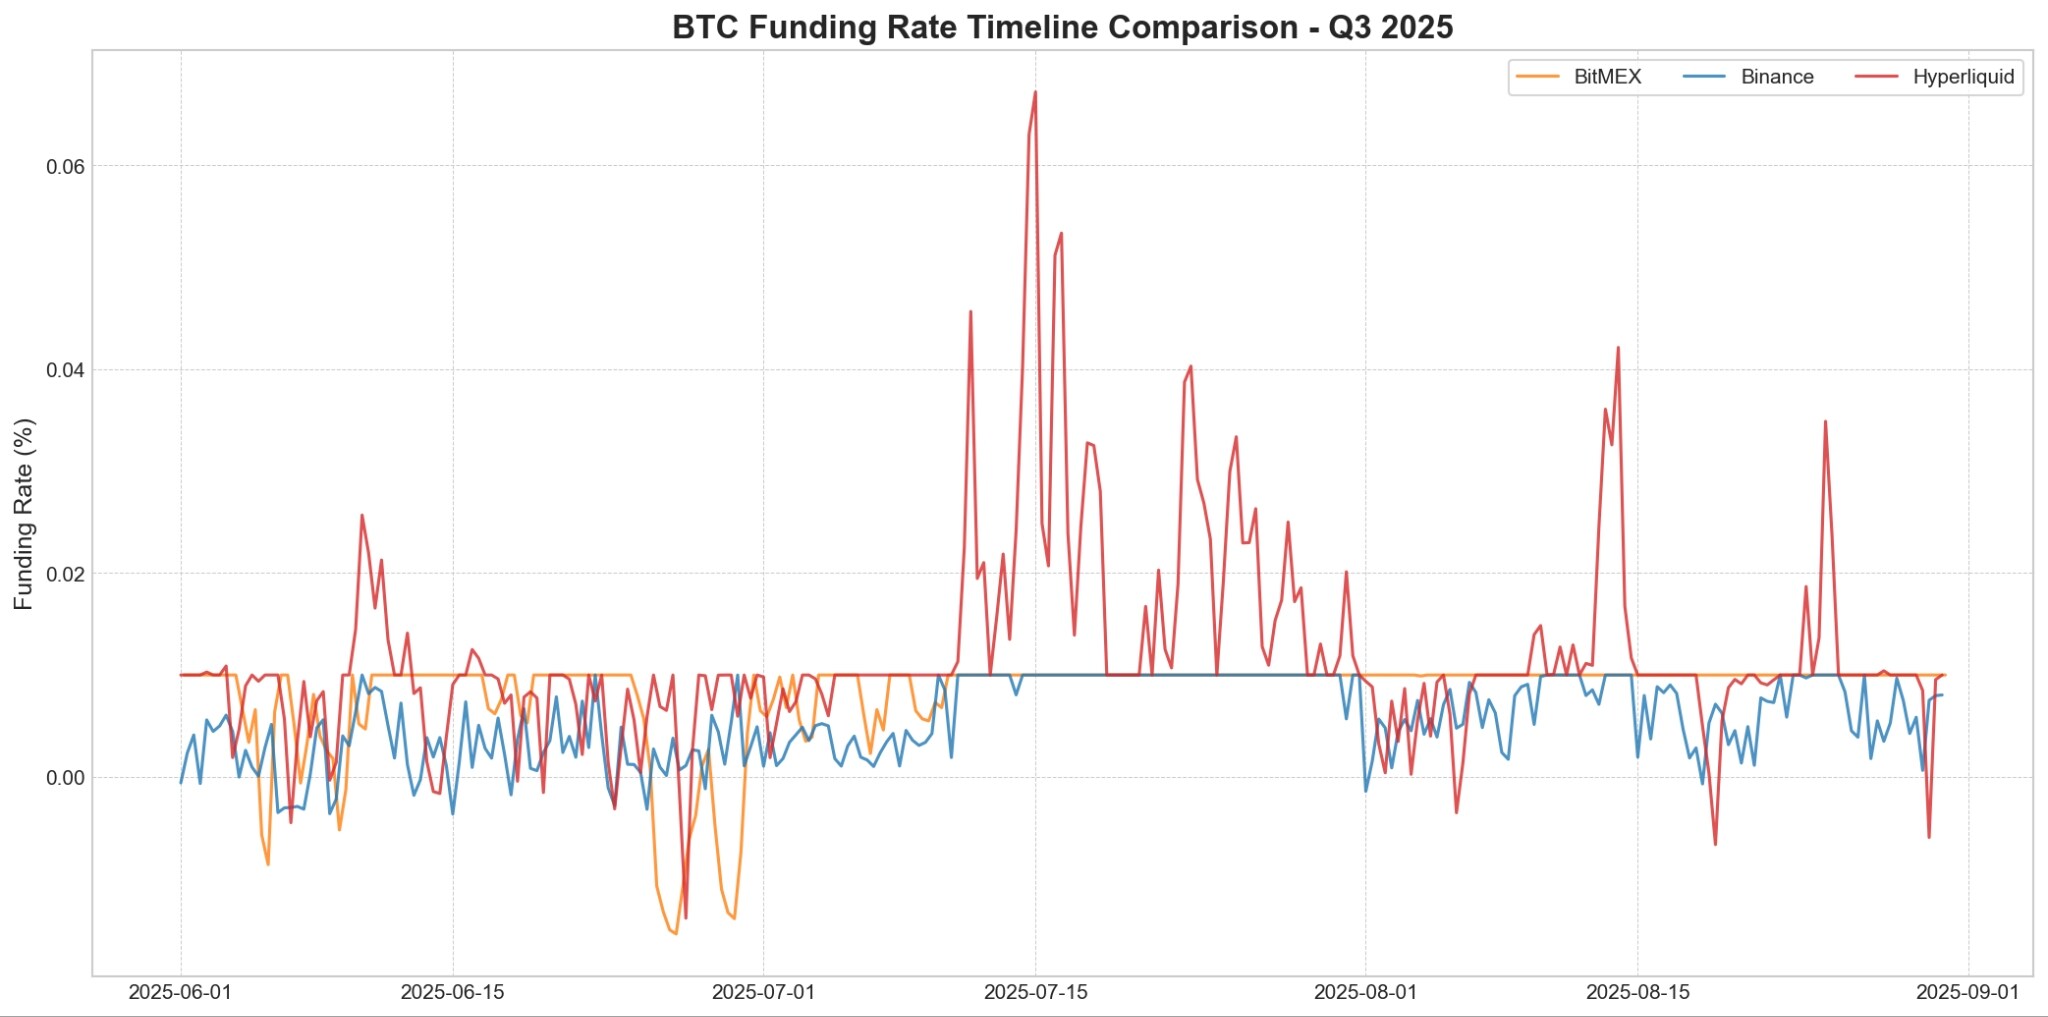
Figure 3: The differential trends of BTC funding rates across exchanges in Q3 2025. Hyperliquid (red) shows significant volatility, with sharp increases often exceeding the 0.01% upper limit. In contrast, BitMEX (orange) and Binance (blue) provide a more stable rate environment.
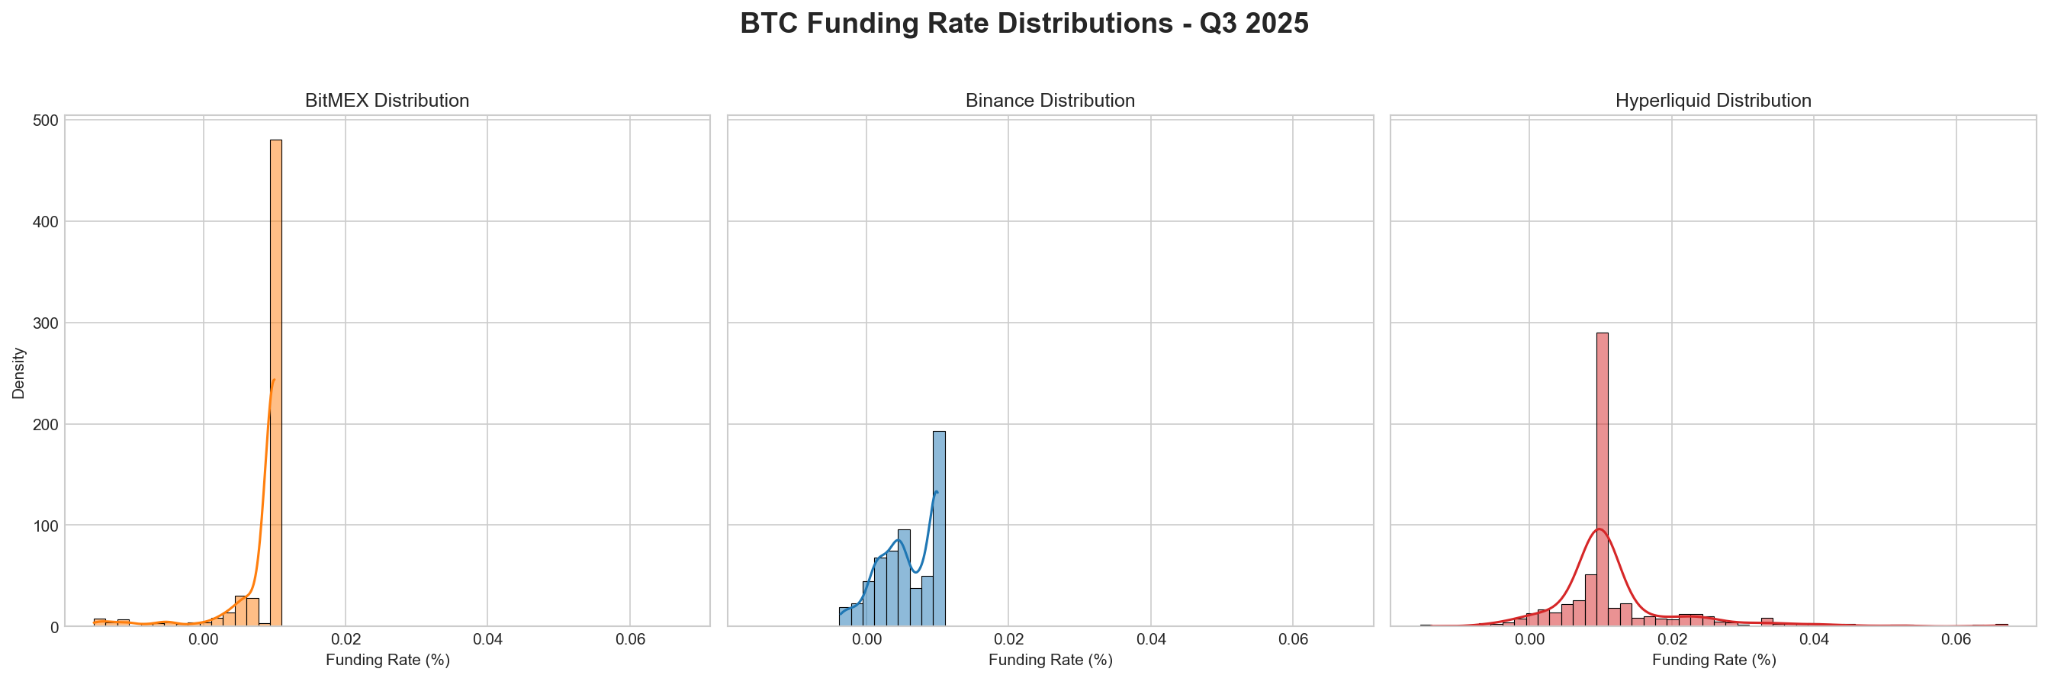
Figure 4: Distribution of BTC funding rates across exchanges in Q3 2025.
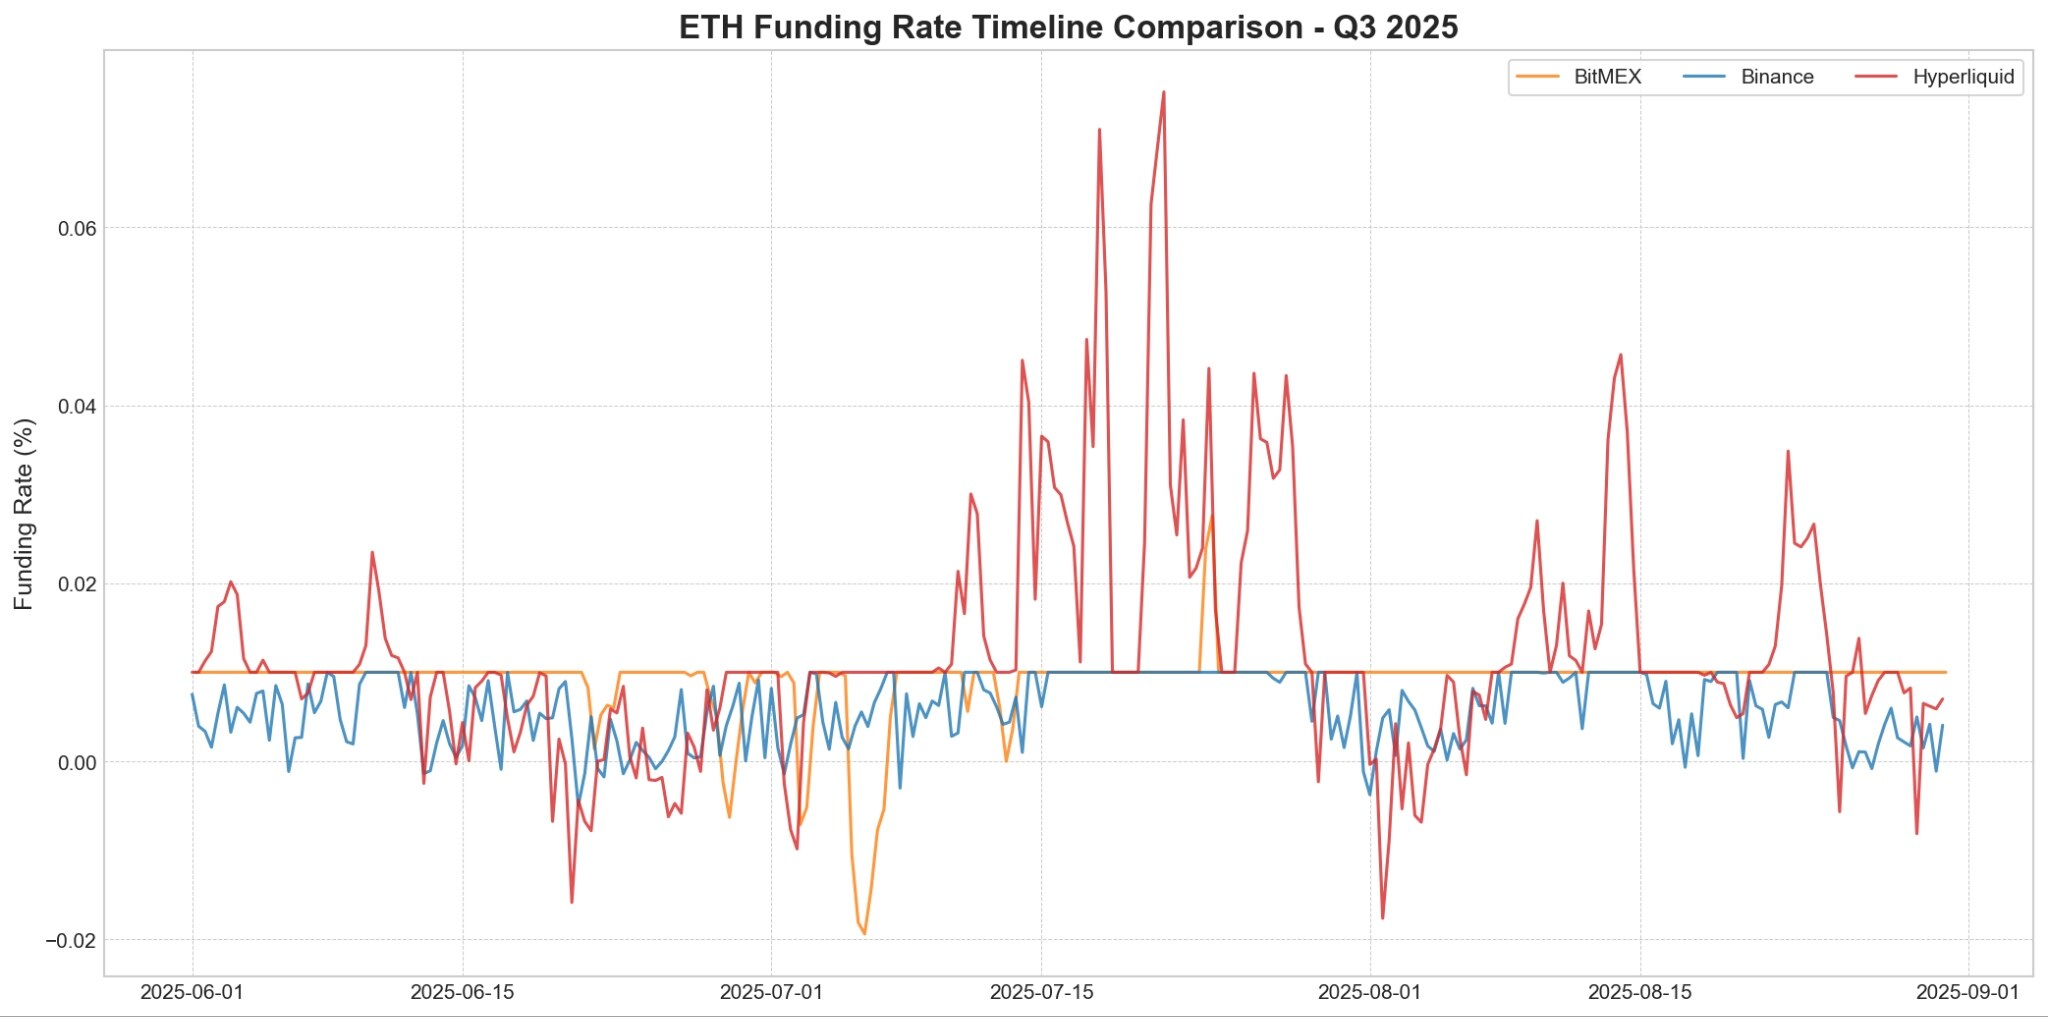
Figure 5: Comparison of ETH funding rates in Q3 2025, revealing a similar behavior pattern to BTC. High liquidity (red) is characterized by high volatility and frequent large fluctuations, while BitMEX (orange) and Binance (blue) maintain a more stable and predictable rate environment.
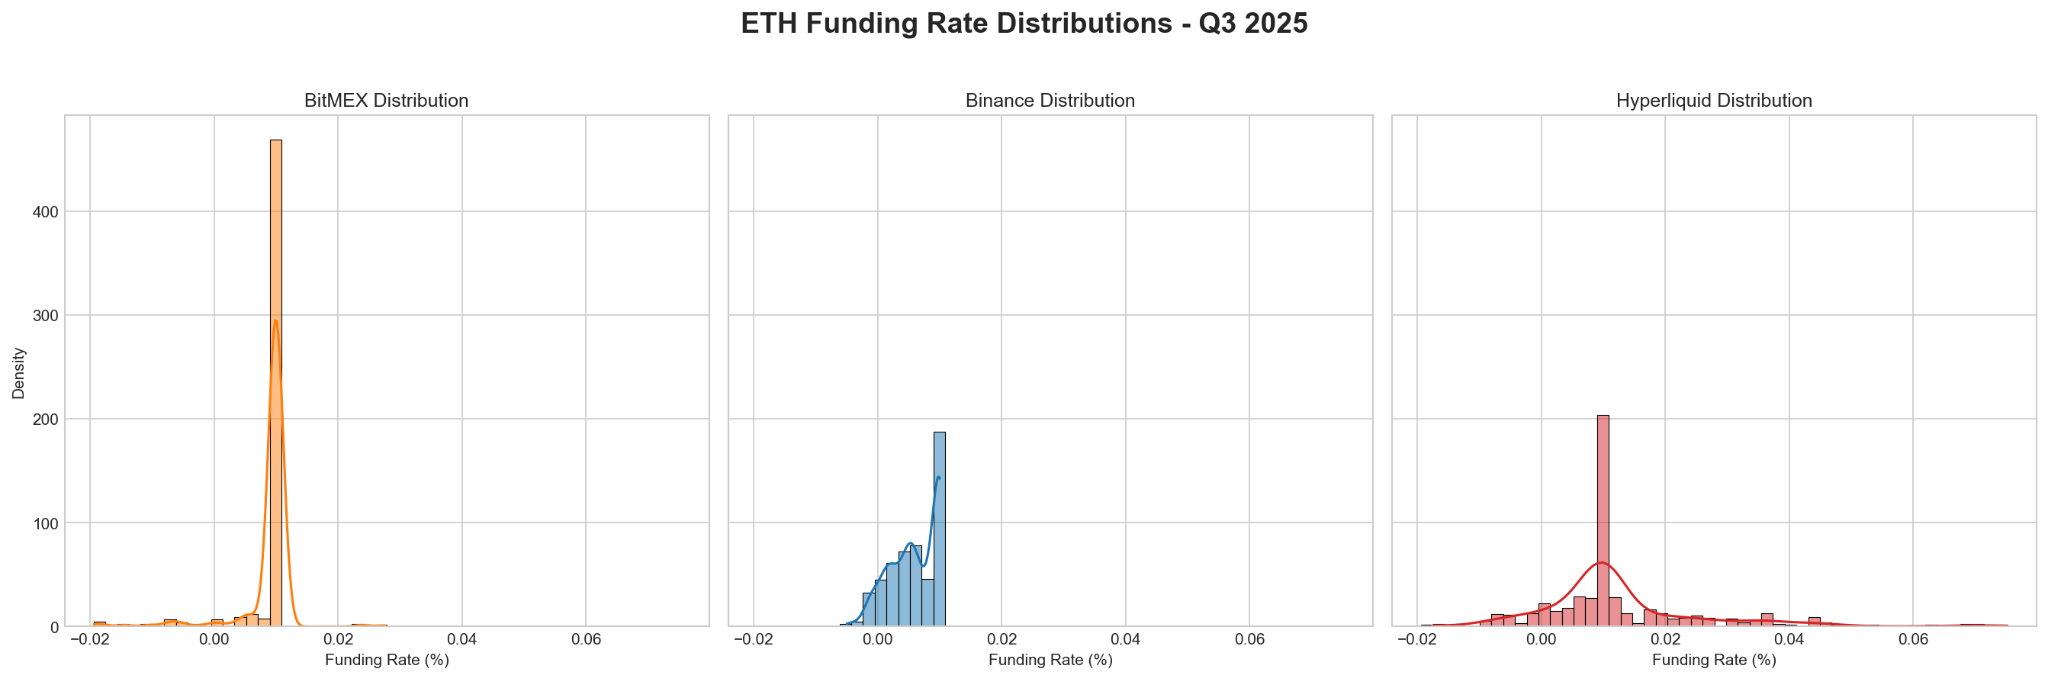
Figure 6: Distribution of Ethereum funding rates on BitMEX, Binance, and Hyperliquid in Q3 2025. This chart shows that the most common Ethereum funding rate across the three exchanges is 0.01%, with BitMEX being the most stable and Hyperliquid exhibiting the highest volatility.
Differences in Funding Rates Across Exchanges: Stability vs. Volatility
Analysis of Bitcoin (BTC) Funding Rates on BitMEX, Hyperliquid, and Binance
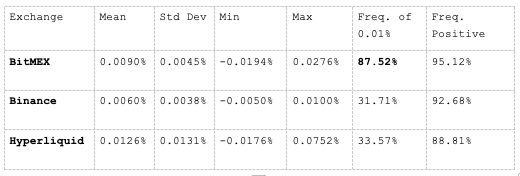
$BTC Funding Rate Data (Q3 2025)
Analysis of Ethereum (ETH) Funding Rates on BitMEX, Hyperliquid, and Binance
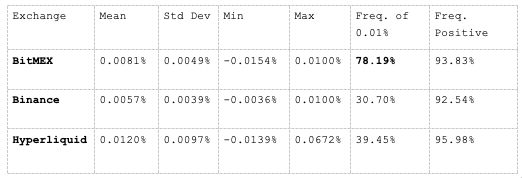
$ETH Funding Rate Data (Q3 2025)
The above charts clearly show the differences in funding rate stability between BitMEX and other exchanges like Hyperliquid and Binance.
- BitMEX: As one of the oldest cryptocurrency derivatives exchanges, BitMEX serves as a benchmark. During the analysis period, the BTC funding rate was exactly 0.01% for 78.19% of the time, while the ETH funding rate was exactly 0.01% for 87.52% of the time. The low standard deviation indicates that its funding rates are the most predictable. This reflects that the premiums for BTC and ETH perpetual contracts on BitMEX are aligned with the spot prices in most cases.
- Binance: As the largest cryptocurrency exchange, Binance has the lowest average funding rates for BTC and ETH, with the median consistently below 0.01%. This indicates persistent short-selling pressure compared to BitMEX. It reflects long-term average market sentiment rather than impulsive behavior.
- Hyperliquid: Hyperliquid exhibits the most significant volatility in funding rates among the three exchanges, with the highest average funding rate and standard deviation. This is directly due to its 1-hour funding rate calculation window and its inability to provide as high leverage as BitMEX, leading to overreactions to basis. The observed highest BTC and ETH funding rates were 0.067% and 0.075%, respectively, far exceeding levels seen on other exchanges, highlighting its trend of extreme funding rate fluctuations.
Bitcoin vs. Ethereum Funding Rates
While the overall trends of funding rates for both assets across exchanges are similar, the data reveals a key difference: in Q3 2025, ETH's funding rates exhibited "higher beta."
1. Slightly Higher Rates: Across all exchanges, the average funding rate for ETH is slightly higher than that for BTC.
2. Significantly Higher Volatility: On the Hyperliquid platform, the funding rate for ETH is 0.0131%, nearly 35% higher than BTC's 0.0097%. This means that ETH's funding rate not only has a higher average level but also exhibits greater volatility, making it more prone to extreme peaks.
Key Takeaways for Traders
Understanding this market structure can provide a framework for identifying high-probability trades. Traders do not need to predict market sentiment but can bet on the enforcement of the market's own rules.
1. Structural Floor: Never Bet Against the Formula's Positive Bias
A core finding is that funding rates are predominantly positive—our data for Q3 2025 shows that this was the case over 92% of the time. This is not random; it is a direct result of the +0.01% interest rate component in the formula, which provides a continuous upward push. Even if you are extremely bearish, remember that a positive funding rate below 0.01% already indicates that the trading price of the perpetual contract is below the spot price. For the interest rate to turn negative, the market must overcome this inherent positive bias.
Therefore, if a market like Boros shows implied funding rates close to zero, then going long has a structural advantage over going short and expecting the rates to remain negative. In this case, the funding rate formula is not your friend—it is actively pushing rates back into positive territory.
2. Arbitrage Ceiling: Do Not Expect High Rates to Persist
Just as the formula creates a soft floor, the availability of large institutional capital creates a hard ceiling. Once funding rates surge significantly above the 0.01% baseline, they yield double-digit annualized returns that are hard for arbitrageurs to resist.
Billions of dollars in capital from institutions and DeFi protocols are continuously on the lookout for these opportunities. When premiums arise, they simultaneously short perpetual contracts and buy spot assets, quickly compressing the premium and forcing funding rates to retreat. This means that while rates may spike, these surges are inherently unstable and short-lived. Betting on sustained high rates is essentially betting against a large, efficient, and well-capitalized segment of the market.
Conclusion
Funding rate trading is an emerging trend in the cryptocurrency industry, and at BitMEX, we look forward to witnessing the next transformation in cryptocurrency derivatives. Our analysis indicates that success in the funding rate market does not stem from predicting chaotic market sentiment but from mastering the fundamental structure of the market.
Two core factors—the attraction of the funding rate formula to 0.01% and the vast pool of arbitrage capital enforcing this formula—create a highly predictable market environment. By understanding why rates are anchored and why negative rates are an anomaly, traders can move beyond price speculation and capitalize on the high-probability opportunities embedded in the market structure pioneered by BitMEX nine years ago.
免责声明:本文章仅代表作者个人观点,不代表本平台的立场和观点。本文章仅供信息分享,不构成对任何人的任何投资建议。用户与作者之间的任何争议,与本平台无关。如网页中刊载的文章或图片涉及侵权,请提供相关的权利证明和身份证明发送邮件到support@aicoin.com,本平台相关工作人员将会进行核查。


