
The weekly Bitcoin chart shows a long lower shadow. This week opened with a rebound, and the current price is around 114,000. Last week saw a 20% spike, and this week has only recovered 50% of the drop, indicating significant volatility remains. The three major U.S. stock indices opened high and rebounded by more than one point, which adds pressure to the rebound. The daily ascending support line has been broken; we are currently in a rebound state. If it cannot regain the support line, it may follow the 123 rule for a decline, and other indices are similar. Gold has broken through 4,100, reaching a historical high; silver has surpassed 51.9, also setting a historical high. I mentioned long ago that we would see silver break new highs, and it has now been realized. Therefore, I still believe that the cost-effectiveness of investing in silver is higher than that of gold.
Bitcoin
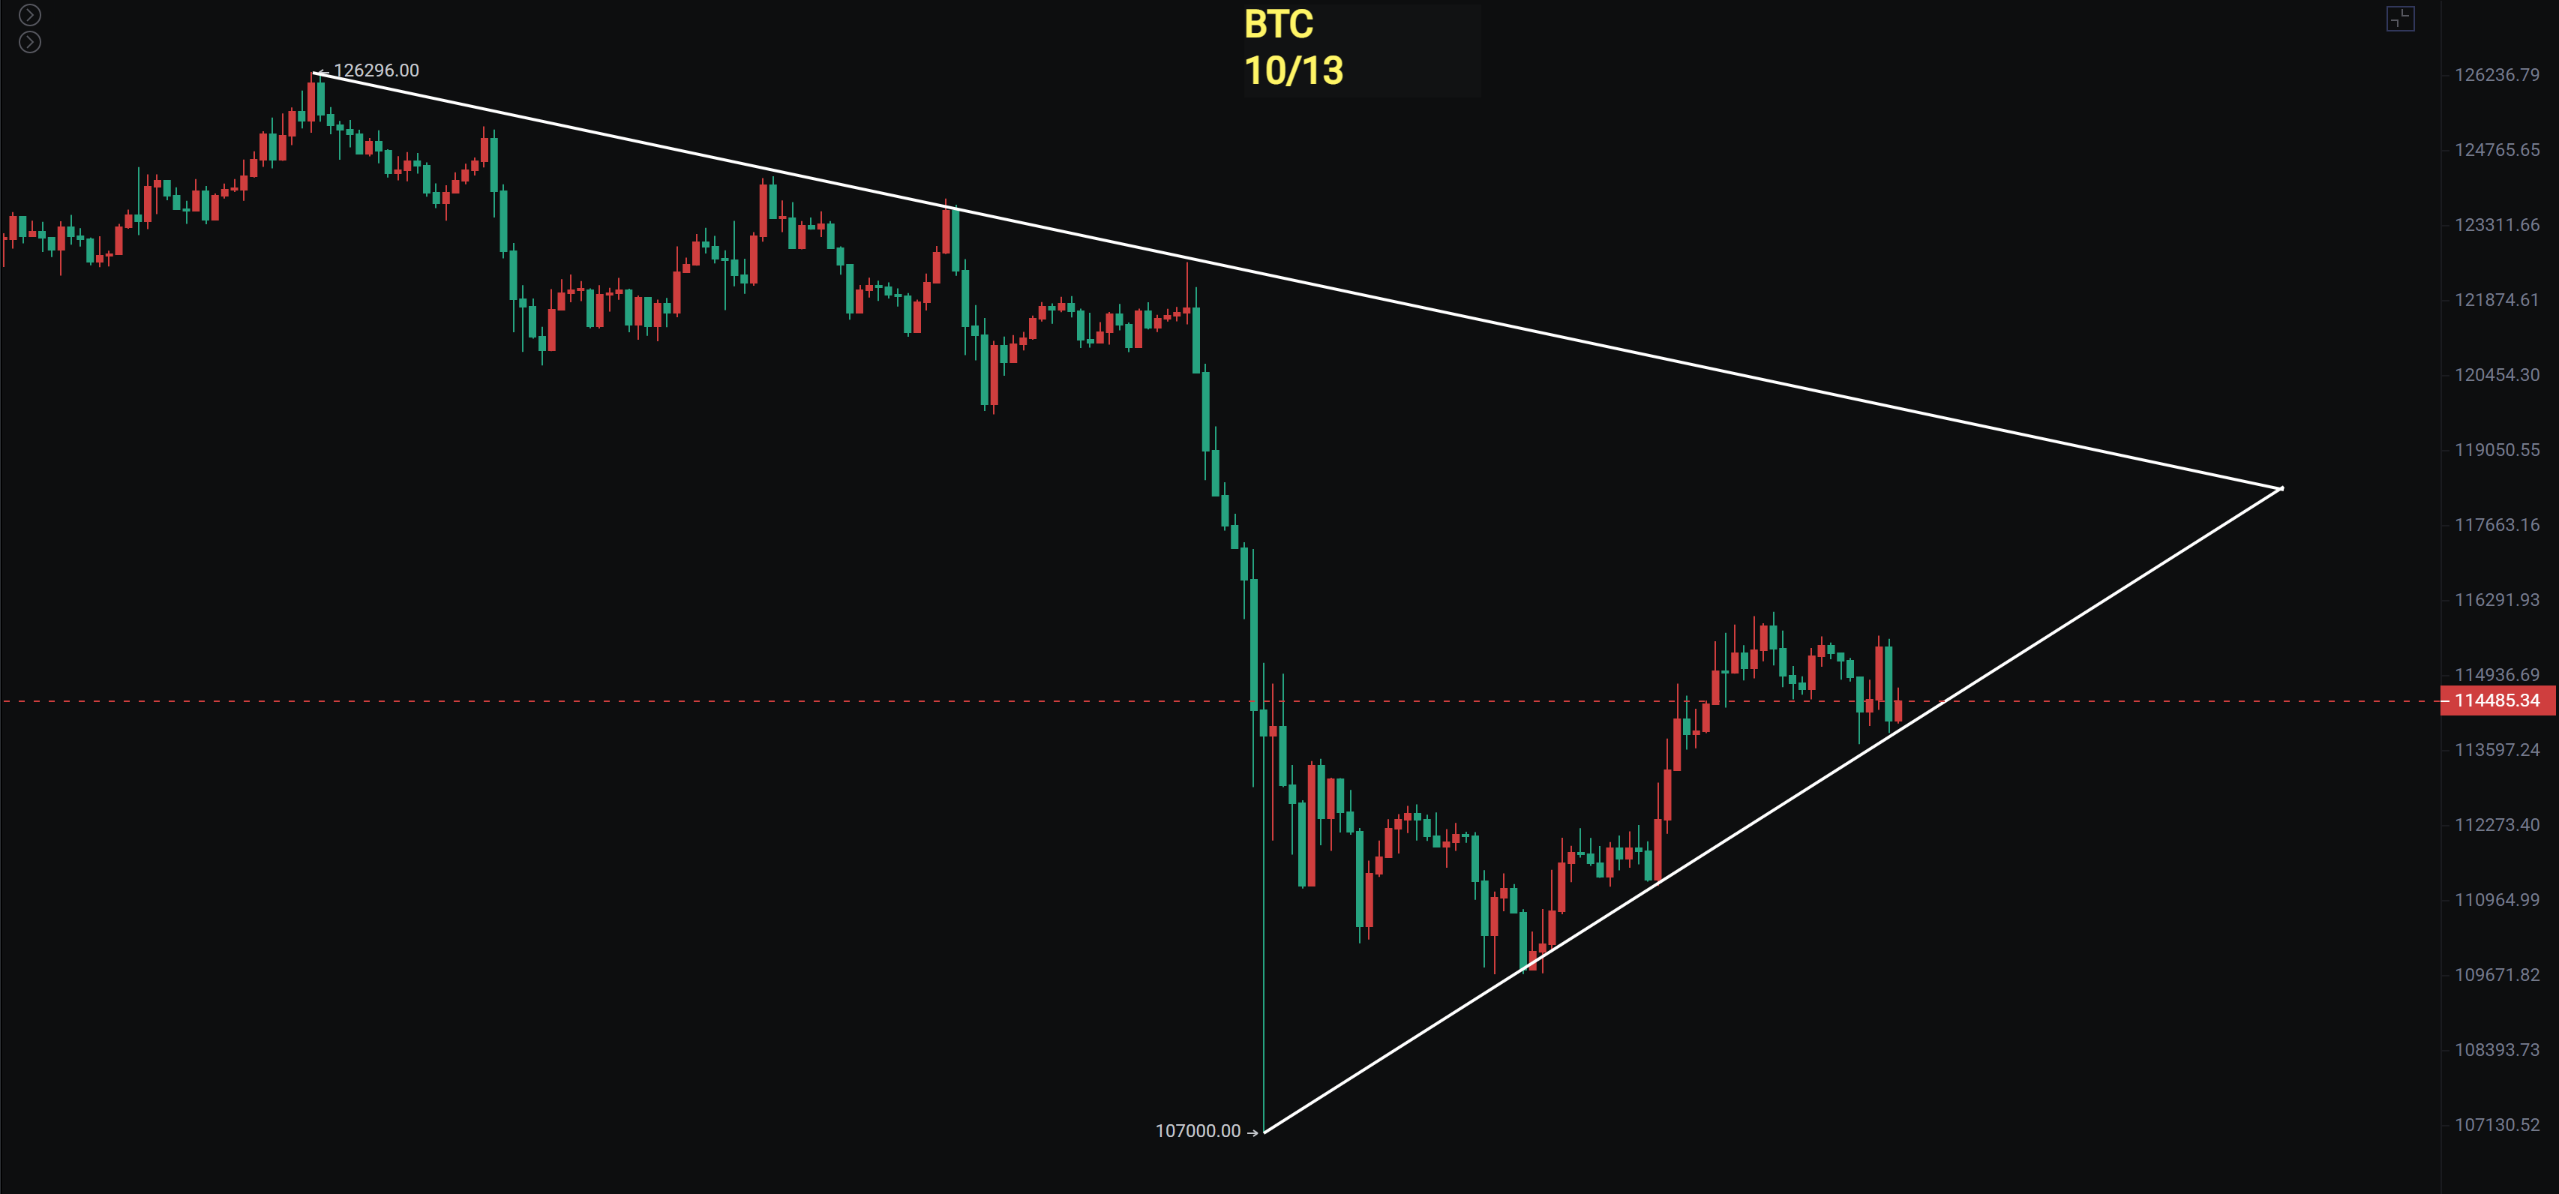
After the spike on the 11th, Bitcoin rebounded upwards, reaching a high of 111,600 (the spike high), which is also the 0.618 resistance level of this downward segment. Cautious investors should wait for a second probing rebound opportunity, with support below at 107,000 to 108,000.
The daily chart is still oscillating within the range, and we are waiting for the rebound height after a second dip. Given the significant pressure from the U.S. stock market's upward rebound, I anticipated this situation last Friday: if it drops to the target in one go, there will still be a chance for an upward rebound; however, if it rebounds immediately at the opening, there will likely be a pullback, and we should focus on the depth of that pullback.
Support: 107,000 - 108,000 - 109,500
Resistance: 116,000 - 117,500 - 118,600
Ethereum
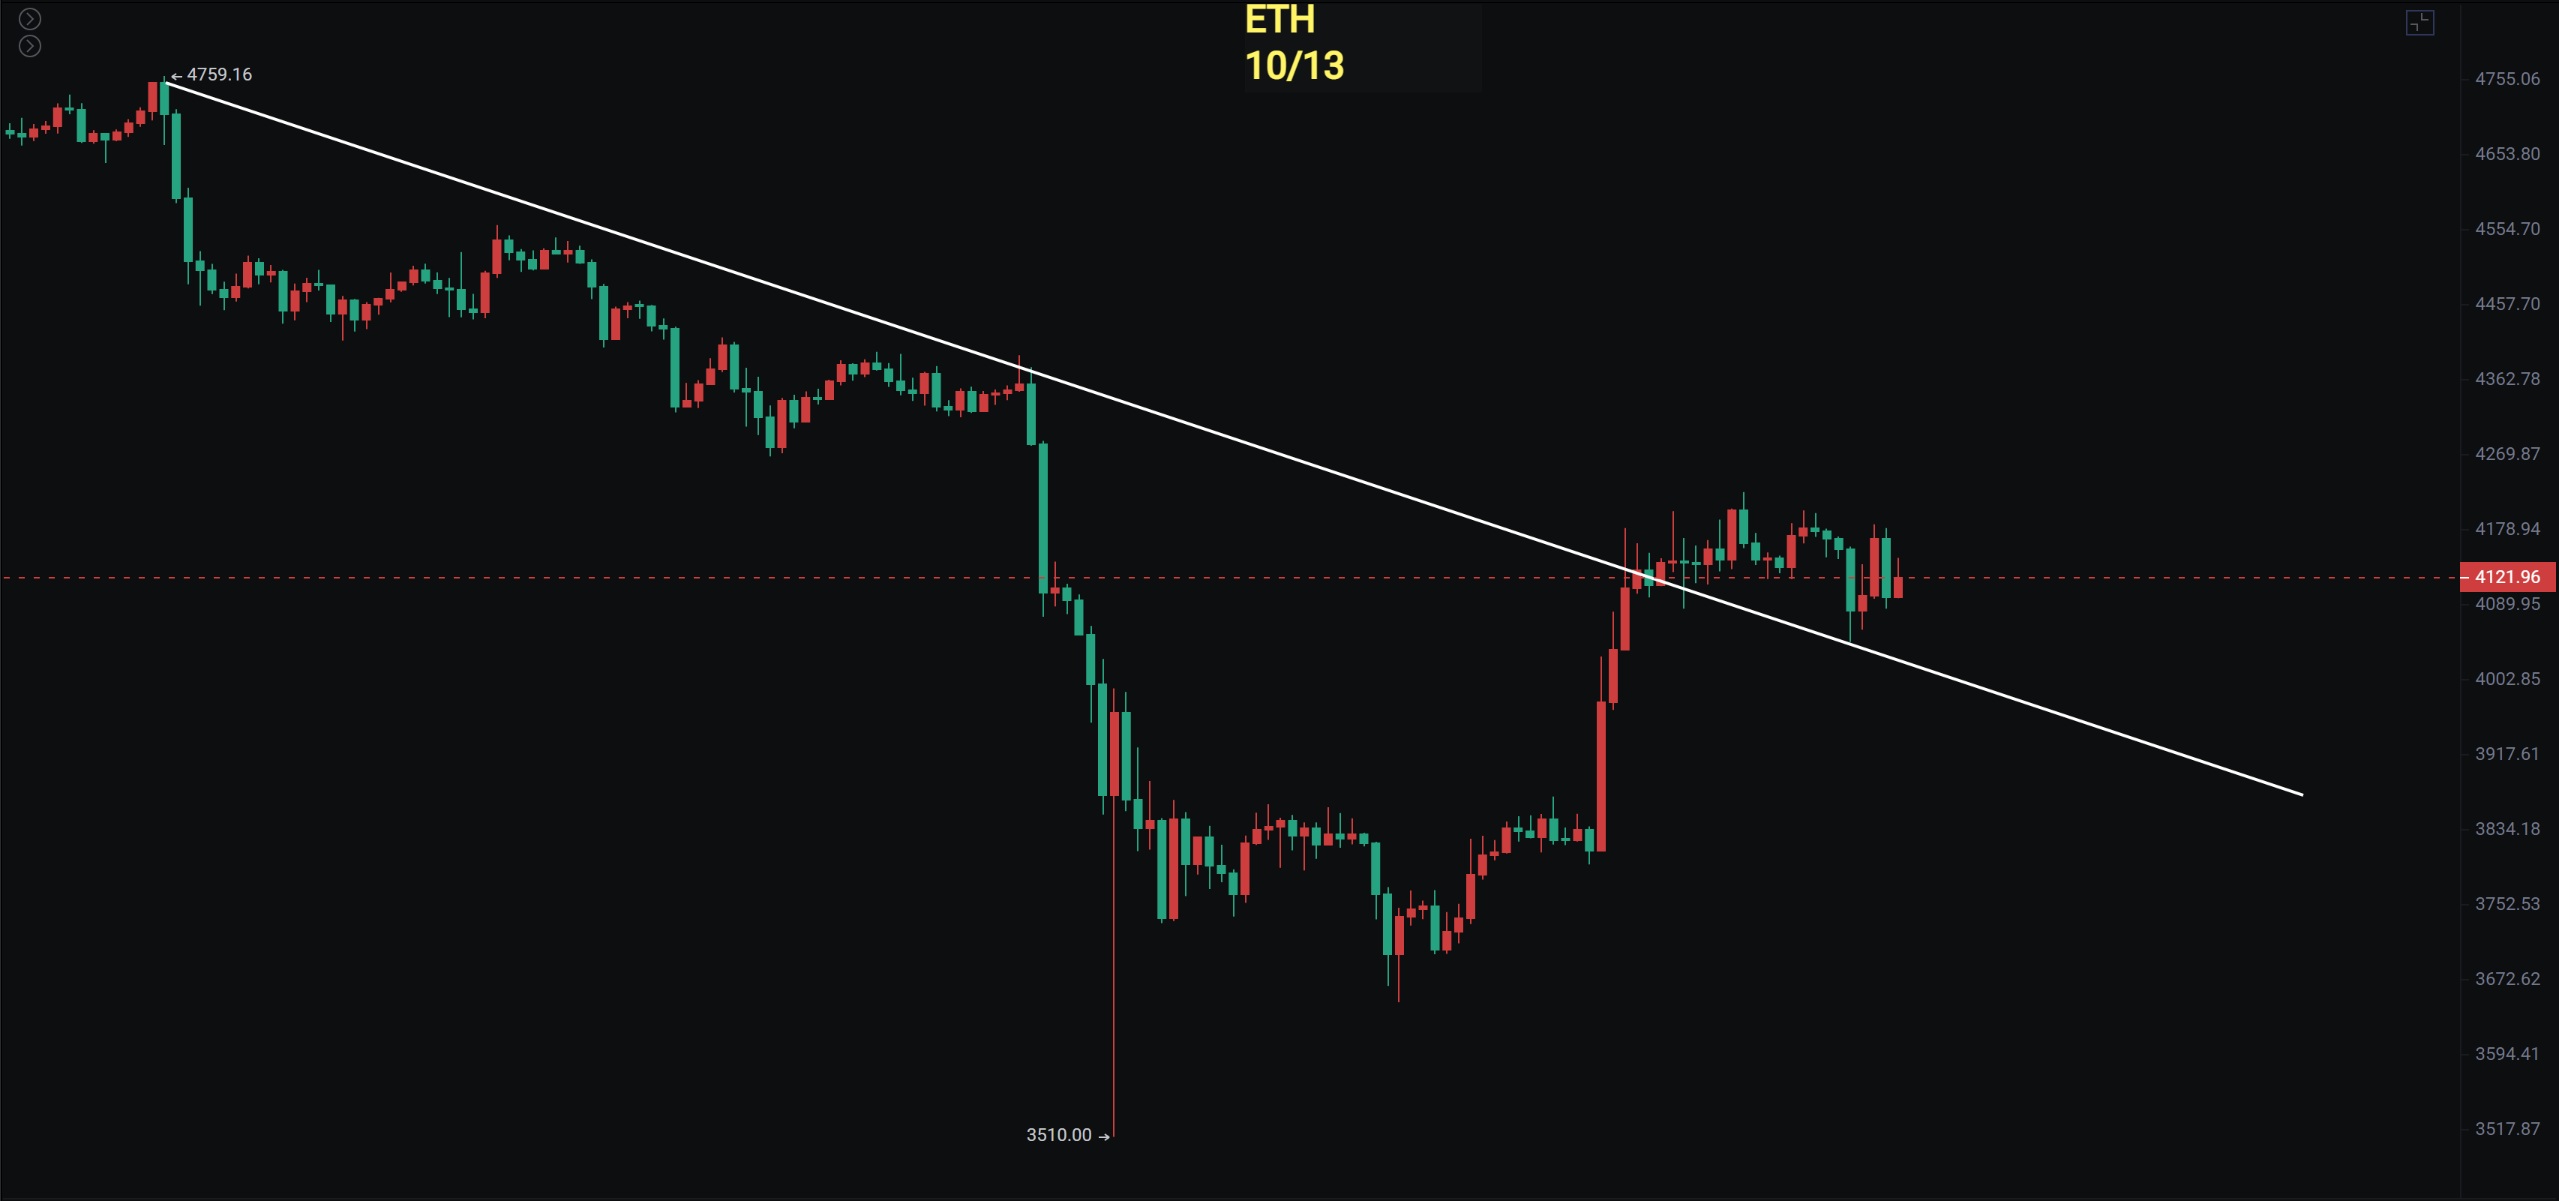
Ethereum has formed a double bearish candle pattern with an interspersed bullish candle. The spike rebound has not yet broken through the 0.618 retracement level, and it is currently around the 0.5 Fibonacci level. There is still a possibility here; we should first look for a second dip and then assess the rebound height. The weekly MACD indicator has returned to the zero axis, with the fast and slow lines crossing, which is a bearish signal, so we need to be particularly cautious here. If the subsequent rebounds of Bitcoin and Ethereum are not strong, the weekly MACD death cross could impact future trends.
The daily rebound is under pressure below 4,220. We need to pay attention to this: at the end of September, the price broke below and then recovered, so this time we need to focus on the strength of the rebound.
Support: 3,645 - 3,815
Resistance: 4,250 - 4,460
If you like my views, please like, comment, and share. Let's navigate through the bull and bear markets together!!!
This article is time-sensitive and for reference only; it is updated in real-time.
Focusing on K-line technical research, sharing global investment opportunities. Public account: BTC Trading Prince Fusu

免责声明:本文章仅代表作者个人观点,不代表本平台的立场和观点。本文章仅供信息分享,不构成对任何人的任何投资建议。用户与作者之间的任何争议,与本平台无关。如网页中刊载的文章或图片涉及侵权,请提供相关的权利证明和身份证明发送邮件到support@aicoin.com,本平台相关工作人员将会进行核查。


