
From the drop on March 12 to BTC reaching a new high took 279 days. From the drop on May 19 to BTC reaching a new high again took 175 days. From the FTX collapse to the market recovery took about 478 days. How long will it take for the drop on October 11 to reach a new historical high?
The crash in April took 44 days to recover, the crash in August took 27 days to recover, how many days will the crash in October take to recover?
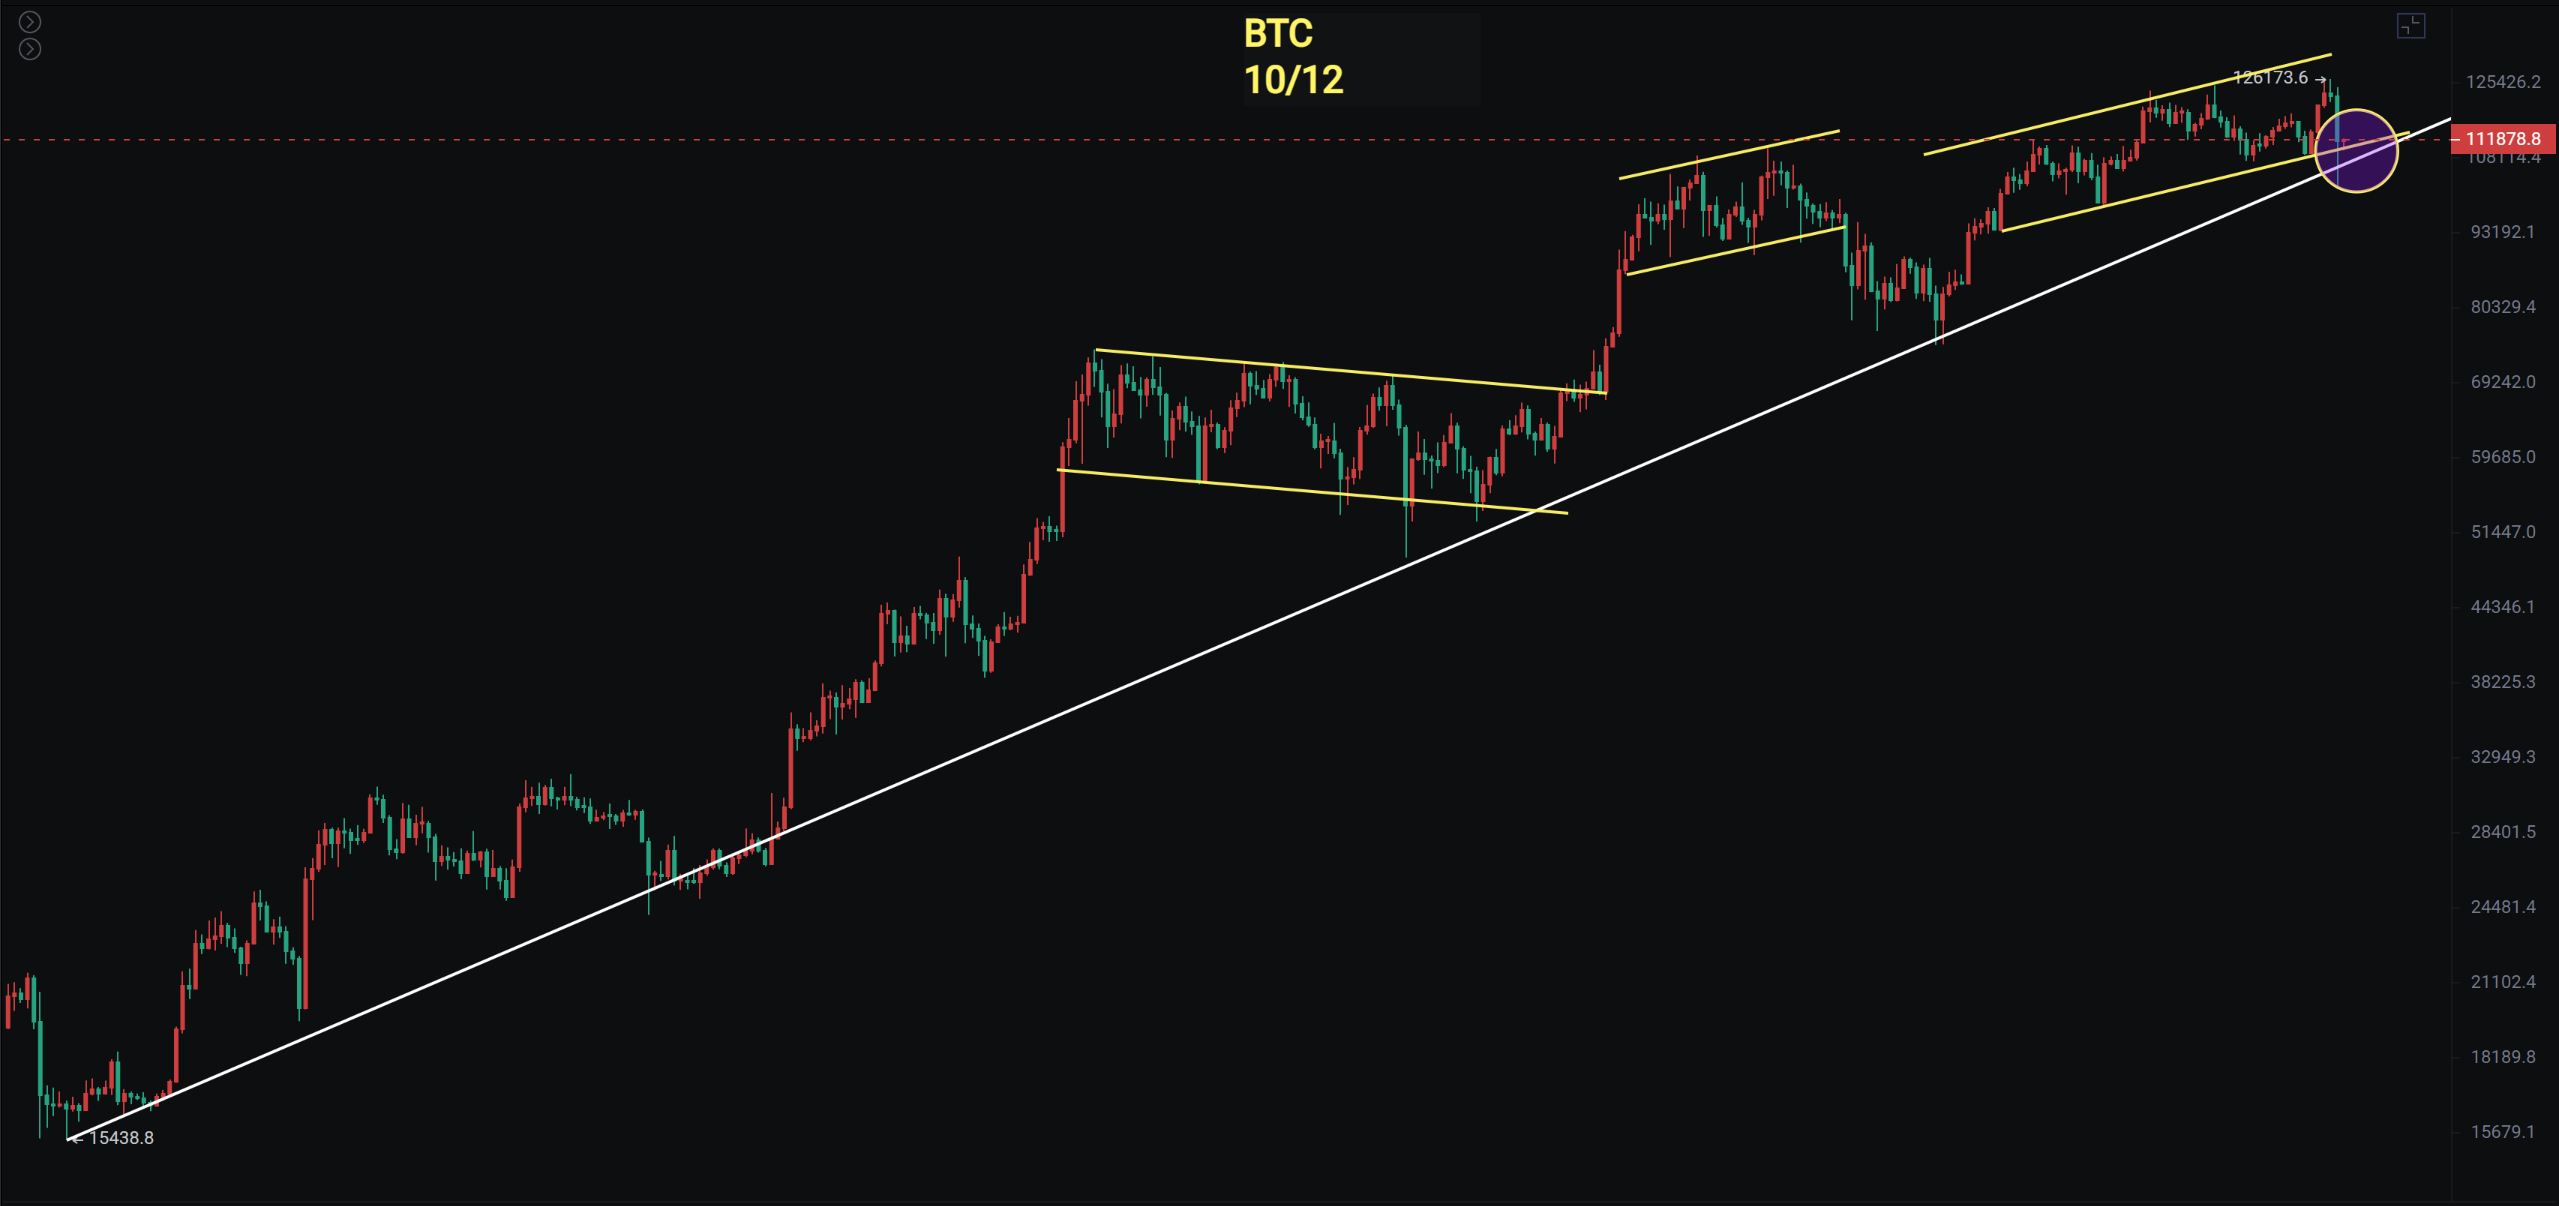
Bitcoin's weekly chart is about to show a pin bar, with the bottom at 102,000. If it opens below 107,000 next week, this position is relatively dangerous. The MACD has been pushed back down again with a bottom divergence, and the OBV indicator on the daily chart has directly broken through the yellow line. Bitcoin's daily chart is still oscillating within a range. If the pin bar bottom at 102,000 is broken, long positions will also be exited. Currently, the entire daily chart's support line from 15,400 is being tested again. The prince has been bullish from around 10,000 to now; if it breaks below 100,000, regardless of whether there is a bull market afterward, it is recommended to exit long positions.
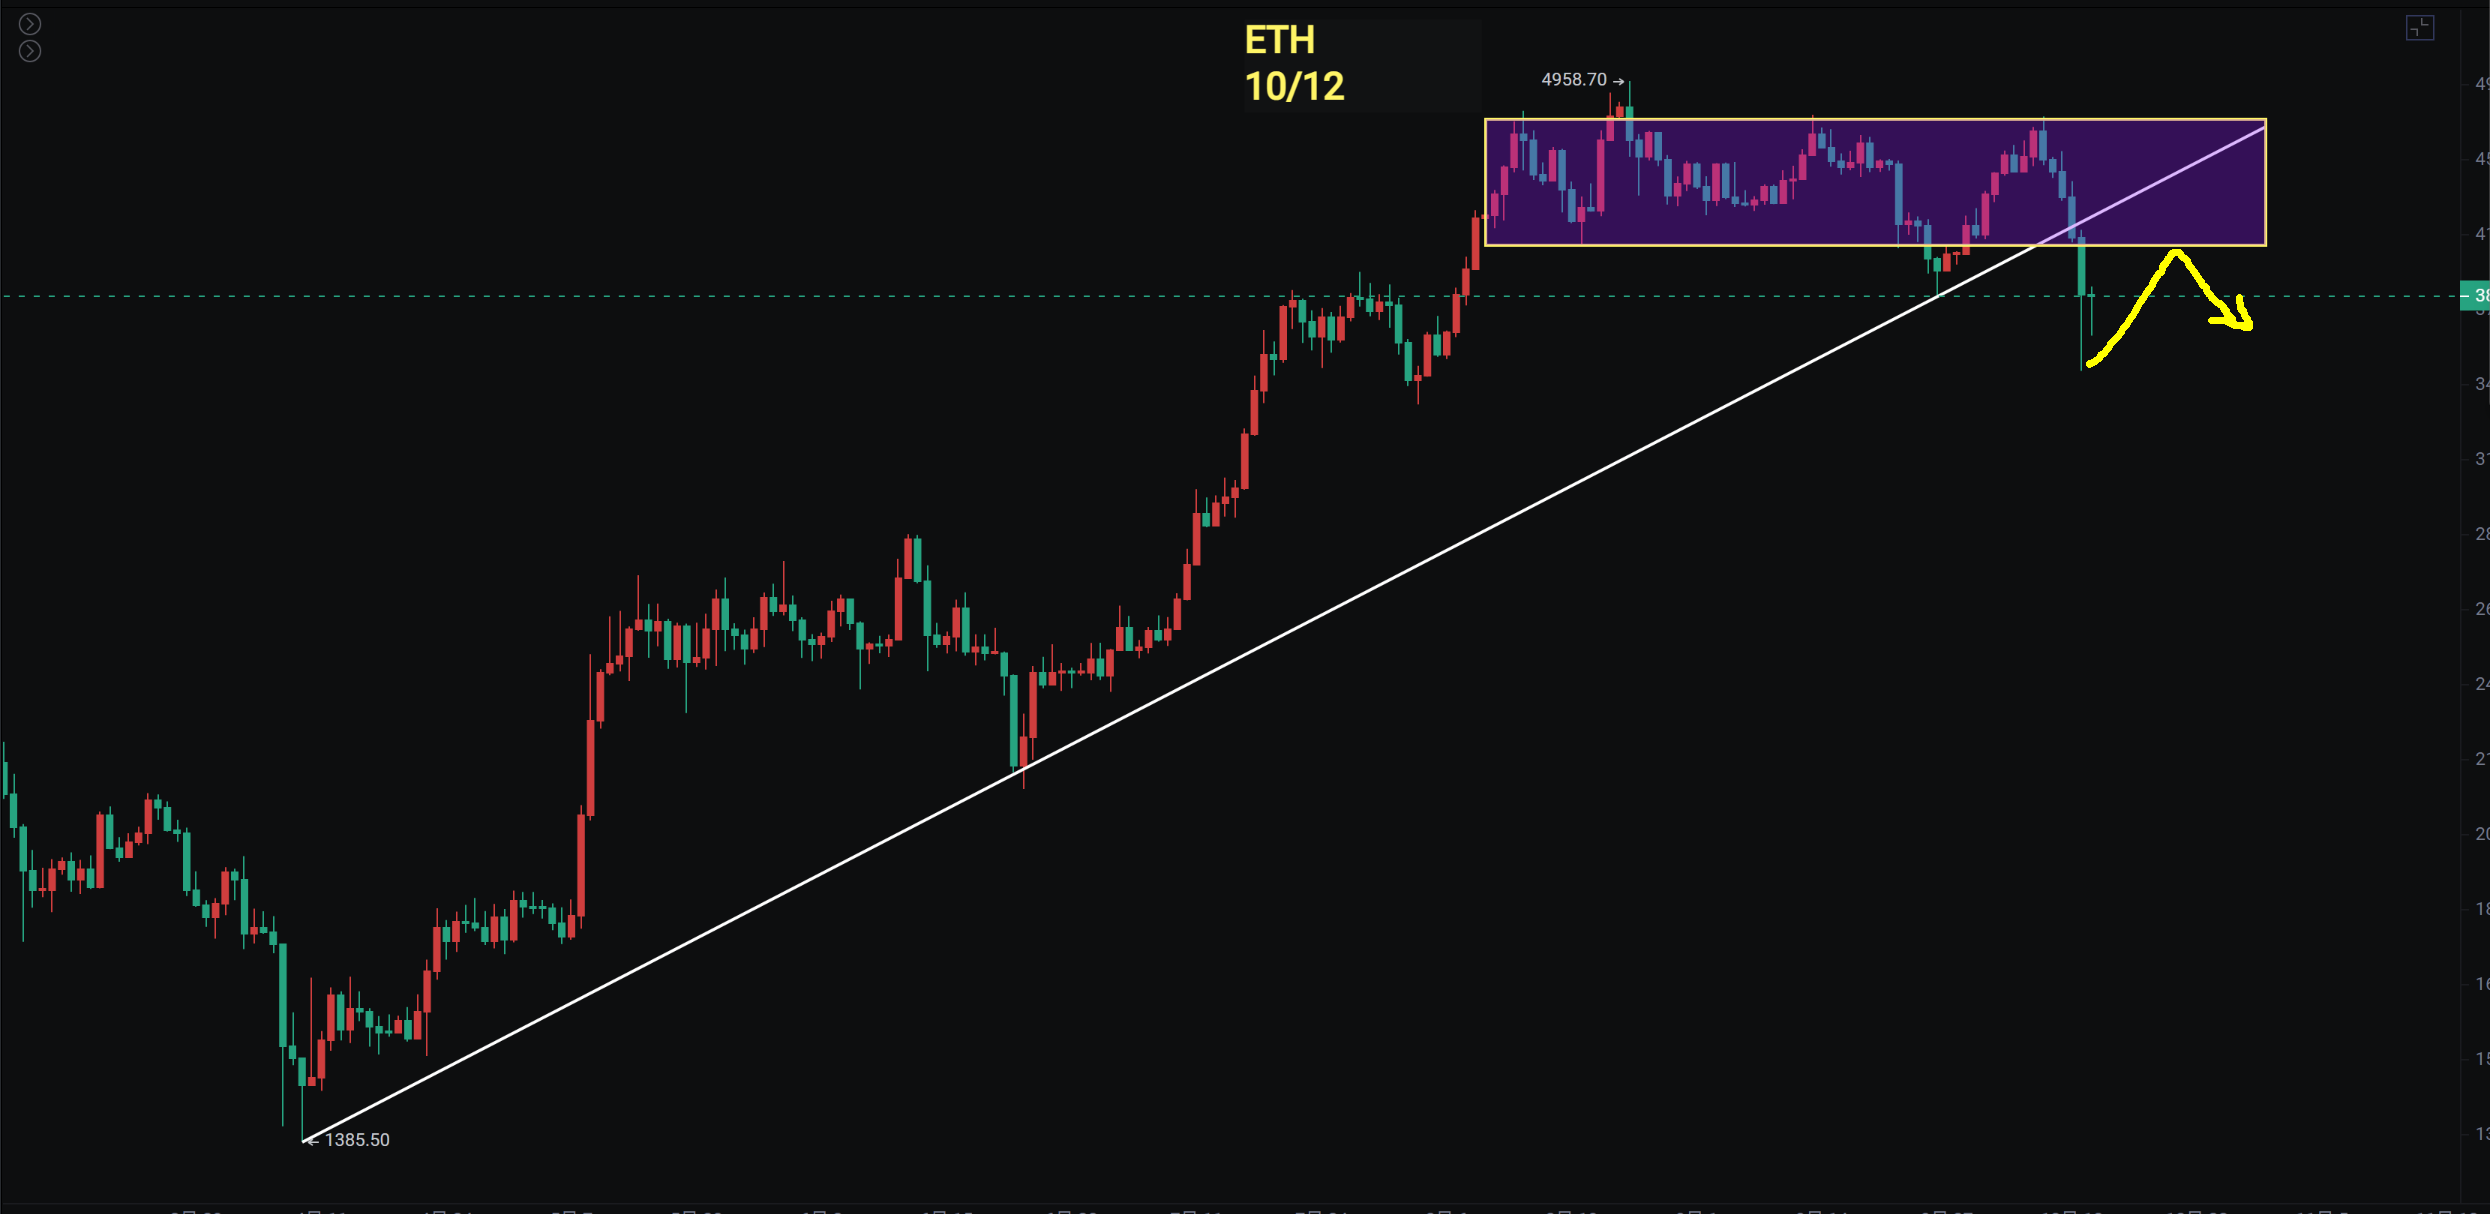
Ethereum's weekly chart has basically formed a double bearish engulfing pattern, indicating a short-term bearish signal. The MACD fast and slow lines have crossed, and the histogram shows signs of crossing the zero axis. The rising support line on the daily chart has been broken, and the center of gravity has shifted downwards. If the rebound cannot break through, it will follow the bearish 123 rule.
Bitcoin
Panic sentiment is spreading in Bitcoin. Next week, pay attention to whether it can make a second attempt at a pin bar rebound, with resistance at 117,000 to 118,000. If the bulls want to continue, they need to maintain the daily chart within the range, which will require a longer period of oscillation. However, if yesterday's pin bar continues to break down, the short-term trend will continue downward. Although the probability of a rebound here is high, the cost-effectiveness is not as good as altcoins, like DASH, which rebounded 50% today.
Support: 102,000—108,000
Resistance: 117,000—118,000
Ethereum
In addition to moving within a high-level range, Ethereum also has a descending channel. If it can close above 4,060, it will be relatively optimistic. If it cannot recover, a second attempt is needed, as the rising trend line on the daily chart has been broken. If the subsequent rebound tests the rising trend line and cannot recover, there is still a risk of decline. Ethereum's weekly close has formed a double bearish engulfing pattern, which is not a good signal.
Support: 3,435—3,644
Resistance: 4,060—4,200
If you like my views, please like, comment, and share. Let's navigate through the bull and bear markets together!!!
The article is time-sensitive and for reference only, updated in real-time.
Focusing on K-line technical research, sharing global investment opportunities. Public account: BTC Trading Prince Fusu

免责声明:本文章仅代表作者个人观点,不代表本平台的立场和观点。本文章仅供信息分享,不构成对任何人的任何投资建议。用户与作者之间的任何争议,与本平台无关。如网页中刊载的文章或图片涉及侵权,请提供相关的权利证明和身份证明发送邮件到support@aicoin.com,本平台相关工作人员将会进行核查。


