On the night of October 10th to the early morning of October 11th, a Black Friday disaster struck, triggering the largest liquidation wave in the history of the cryptocurrency market, which also affected the USDE trading pair with USDT on Binance, causing it to drop to $0.65. Although it quickly rebounded, it left an absolute shadow over cryptocurrency market investors.
At the same time, on the evening of October 10th, U.S. President Trump once again proposed imposing a 100% tariff on Chinese goods, instantly pulling the U.S.-China trade war back to the brink of fear, severely impacting the investment market, including cryptocurrencies.
After 10 PM Beijing time on October 10th, the price of Bitcoin began to decline from above $122,000. By around 5 AM on the 11th, the spot price of Bitcoin on Binance plummeted to $102,000, while the OKX market dropped to $101,500, with Ethereum following suit. The bullish positions in the cryptocurrency market were violently crushed.
Trump's latest tariff decision is seen as a tough response to China's export controls on rare earths, causing global risk assets to plummet on the 10th, with the cryptocurrency market becoming the first line of defense. Apart from Bitcoin and Ethereum, mainstream altcoins like Solana also experienced double-digit declines.
The price crash directly triggered a rare liquidation wave, with nearly 1.5 million cryptocurrency investors being forcibly liquidated within 12 hours. The total amount reached $19 billion, setting a record for the second-highest single-day liquidation. Among the major liquidated cryptocurrencies, Bitcoin had a liquidation amount of about $5.3 billion, Ethereum about $4.36 billion, Solana about $614 million, and XRP about $432 million.
This bloodbath led to a massive influx of trades on-chain and on exchanges, causing delays or brief disconnections on exchanges, creating secondary risks for retail and institutional investors' capital operations, which may cast a long shadow over most cryptocurrency investors.
Bitcoin Four-Hour Chart
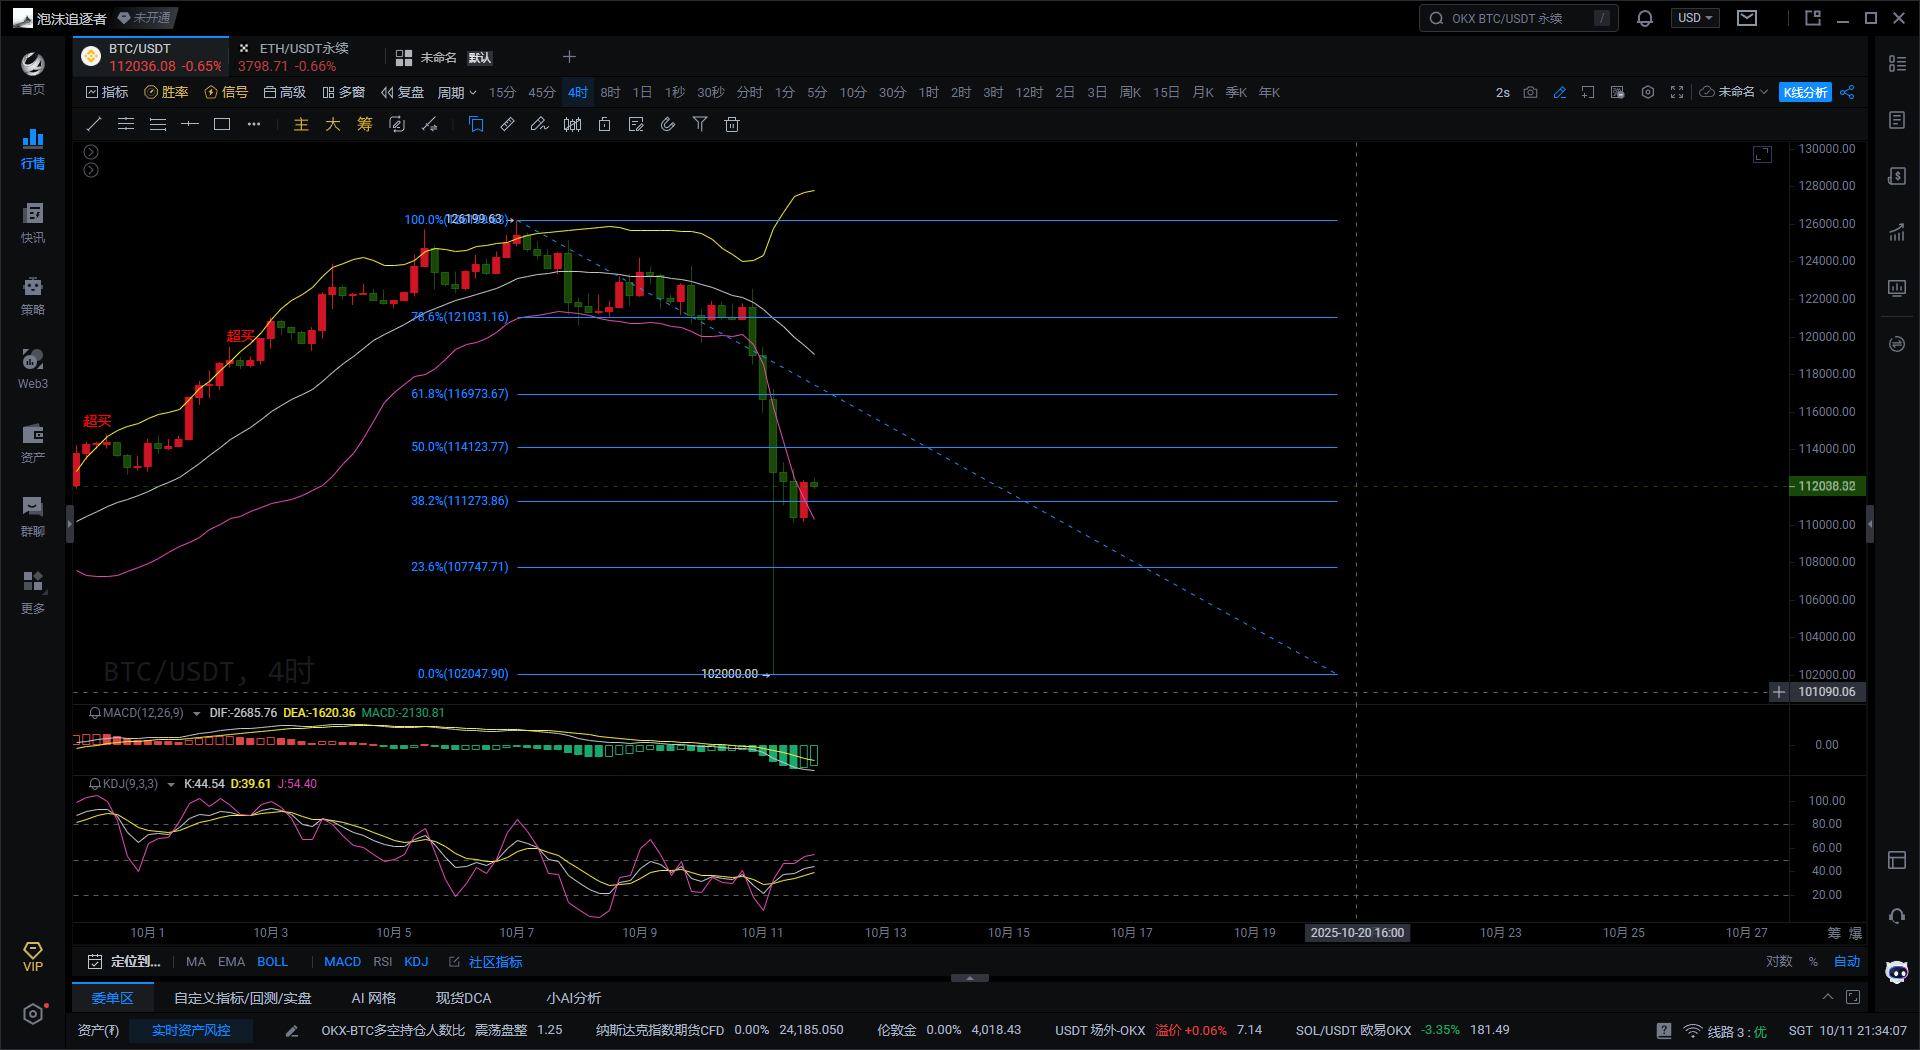
The current price range shows a high point around $126,200 and a low point at $102,000. According to Fibonacci retracement analysis, 23.6% corresponds to $107,747, 38.2% corresponds to $112,723, 50% corresponds to $114,123, and 61.8% corresponds to $116,973. The current price is around $112,000, which is just near the 38.2% retracement level, marking the first key resistance area for a rebound. If the price cannot effectively break through the $112,700-$114,000 range, the rebound may end, and the price may continue to oscillate weakly.
From the Bollinger Bands indicator, the current price is still operating near the lower band, indicating that the market is still in a low-level consolidation phase, and the bearish trend has not changed. The lower band is opening downwards quickly, suggesting increased volatility recently, with a bearish trend. If the price can stabilize and approach the middle band around $115,000, a short-term corrective rebound may form. However, if the price falls below the lower band again and expands the downward space, it may retest the support level at $102,000.
The MACD indicator is currently still operating below the zero axis, with the DIF line below the DEA line, and the MACD green histogram continues to extend downwards, indicating that the bears still dominate, but the downward momentum has slightly weakened. If the subsequent histogram shortens further and a golden cross occurs between the yellow and white lines, a short-term rebound may form. However, there is currently no obvious golden cross signal, and the rebound momentum still needs further confirmation.
Regarding the KDJ indicator, the three lines are rising from the oversold zone, with the K line value around 44, the D line value around 39, and the J line value around 54, indicating that the price is in the early stage of a rebound. If the K line value and D line continue to rise and form a golden cross, the rebound may extend to the $114,000 to $116,000 range. However, if the price encounters resistance at the current level and turns downward, it means the rebound has ended, and the price may retest the lows.
In summary, the current market is still in a weak pattern dominated by bears. Although there are signs of a short-term rebound, whether it can be sustained still requires observation of the breakthrough of key resistance levels. Close attention should be paid to the performance in the $112,000-$114,000 range, as well as changes in technical indicators, to assess the subsequent trend.
Based on the above, the following suggestions are provided for reference:
1. Go long on Bitcoin at the current price of $112,000, targeting $114,000-$115,000. If it stabilizes effectively at $115,000, it can continue to look towards $116,000.
2. If Bitcoin rebounds to $114,000 and encounters resistance, it can be shorted directly, targeting $112,000-$111,500.
Giving you a 100% accurate suggestion is not as good as providing you with the right mindset and trend. Teaching someone to fish is better than giving them fish; the suggestion may earn you temporarily, but learning the mindset will earn you for a lifetime!
Written on: (2025-10-11, 21:30)

(Text - Master Says Coin) Disclaimer: Online publication has delays; the above suggestions are for reference only. Investment carries risks; proceed with caution!
免责声明:本文章仅代表作者个人观点,不代表本平台的立场和观点。本文章仅供信息分享,不构成对任何人的任何投资建议。用户与作者之间的任何争议,与本平台无关。如网页中刊载的文章或图片涉及侵权,请提供相关的权利证明和身份证明发送邮件到support@aicoin.com,本平台相关工作人员将会进行核查。


