The city's night lights are dazzling, yet many of us feel lonely inside. Perhaps without certain people in our lives, we are left with endless silence. Those streets we once walked together, the words we shared, pierce the heart like needles. Sometimes I wish that when I turn around, you would still be behind me, but that is merely a hope…
Yesterday's market was characterized by typical fluctuations after a rise, aligning closely with our expectations. Initially, there was a slight increase following a drop, but it did not refresh the previous small cycle's high, reaching around 123700 instead. Subsequently, another pullback occurred, refreshing the low to below 120000, before returning to around 122000 for minor fluctuations. Overall, our planned operations from yesterday were quite in line with market expectations. After the first wave of rebound, we did not get the anticipated short position, but during the subsequent pullback, we suggested entering long below 120000, which was a very suitable short-term trading point. After all, according to yesterday's liquidity distribution, breaking below 120000 would effectively liquidate most of the short-term bulls below.
Turning to today's market, we first look at the liquidity distribution. After yesterday's pullback below 120000, the previously accumulated short-term bullish liquidity has been cleared. Currently, there is more bearish liquidity above, showing a layered distribution, primarily around 122600 and 123400. To clear the short-term bearish positions, a rise above 124700 is needed. Conversely, the short-term bullish liquidation is around 119200, requiring a drop below 118000 to complete the liquidation. Overall, the liquidity space has expanded, and combined with recent market trends, the likelihood of forming high-level fluctuations again has increased. In terms of spot premium, it has not been significantly affected by yesterday's drop, and there has not been a large decline in premium, indicating that market confidence remains substantial, and the current drop does not induce panic.
On the technical front, the daily chart shows a bearish candle with a lower shadow, and the price is running below the MA7 line, which has started to turn down. From the market structure, the daily chart is beginning to lean bearish in the short term. In terms of technical indicators, MACD is converging again, and the adjustment is nearing the correction zone. RSI continues to operate in the high region. Overall, as long as there is no significant rise to refresh the highs, the daily chart is likely to undergo a correction process.
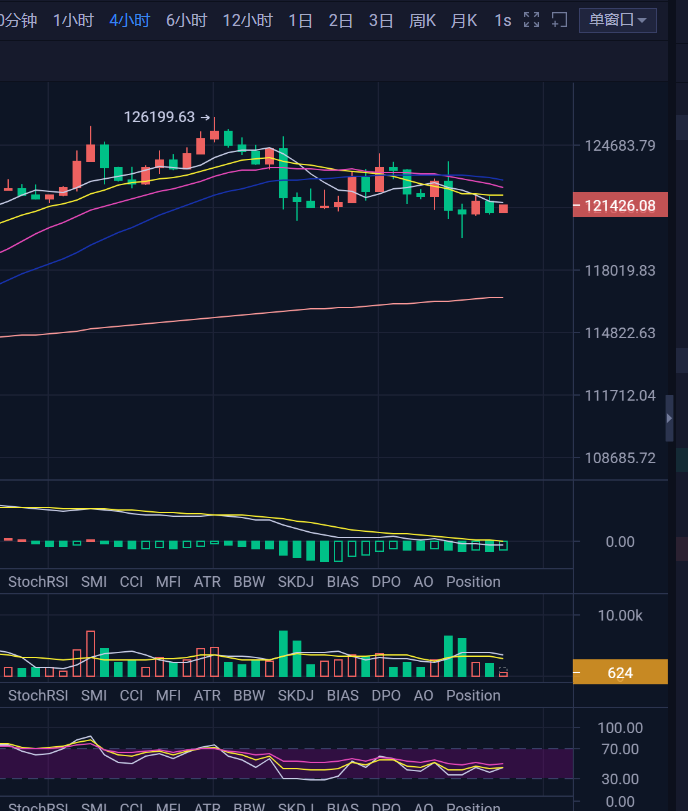
On the four-hour chart, the market structure is similar to yesterday's. The market has spent another day in a bearish cycle. Although a four-hour low was reached below 120000 yesterday, the candle left a long lower shadow. For the upcoming market, MACD is expected to enter a bullish cycle in the short term, and this is getting closer. After the four-hour bullish cycle completes, combined with the daily chart's correction structure, it may test support downwards again.
In terms of operations, yesterday's bullish positions yielded 2000 points. For short-term trading, one can reduce positions and continue holding. If there is another pullback during the day, one can continue to go long. A short position can be taken around 123500 during the rebound, waiting for further downward testing to occur.
【The above analysis and strategies are for reference only. Please bear the risks yourself. The article is subject to review and publication, and market changes in real-time may lead to delays in information, making strategies not timely. Specific operations should follow real-time strategies. Feel free to contact and discuss the market.】

免责声明:本文章仅代表作者个人观点,不代表本平台的立场和观点。本文章仅供信息分享,不构成对任何人的任何投资建议。用户与作者之间的任何争议,与本平台无关。如网页中刊载的文章或图片涉及侵权,请提供相关的权利证明和身份证明发送邮件到support@aicoin.com,本平台相关工作人员将会进行核查。


