Original Title: Where might ETH Top?
Original Author: Michael Nadeau, The DeFi Report
Original Translation: Luffy, Foresight News
Tom Lee recently suggested at the Korea Blockchain Week that Ethereum's mid-term target price is $60,000, stating that Ethereum is in a super cycle lasting 10-15 years.
If his judgment is correct, this super cycle will progress in waves, spanning multiple cycles, alternating between bull and bear markets.
Currently, we are in a bull market, but bull markets do not last forever.
Looking back at history, Ethereum fell by 94% in 2018 and by 80% in 2022, so we have reason to anticipate another significant correction in the future.
At this moment, we cannot determine when the correction will occur, but by tracking several key indicators, we can reference the levels Ethereum has reached in past cycles to provide a basis for future trends.
Key Indicator Analysis and Price Targets
200-Week Moving Average
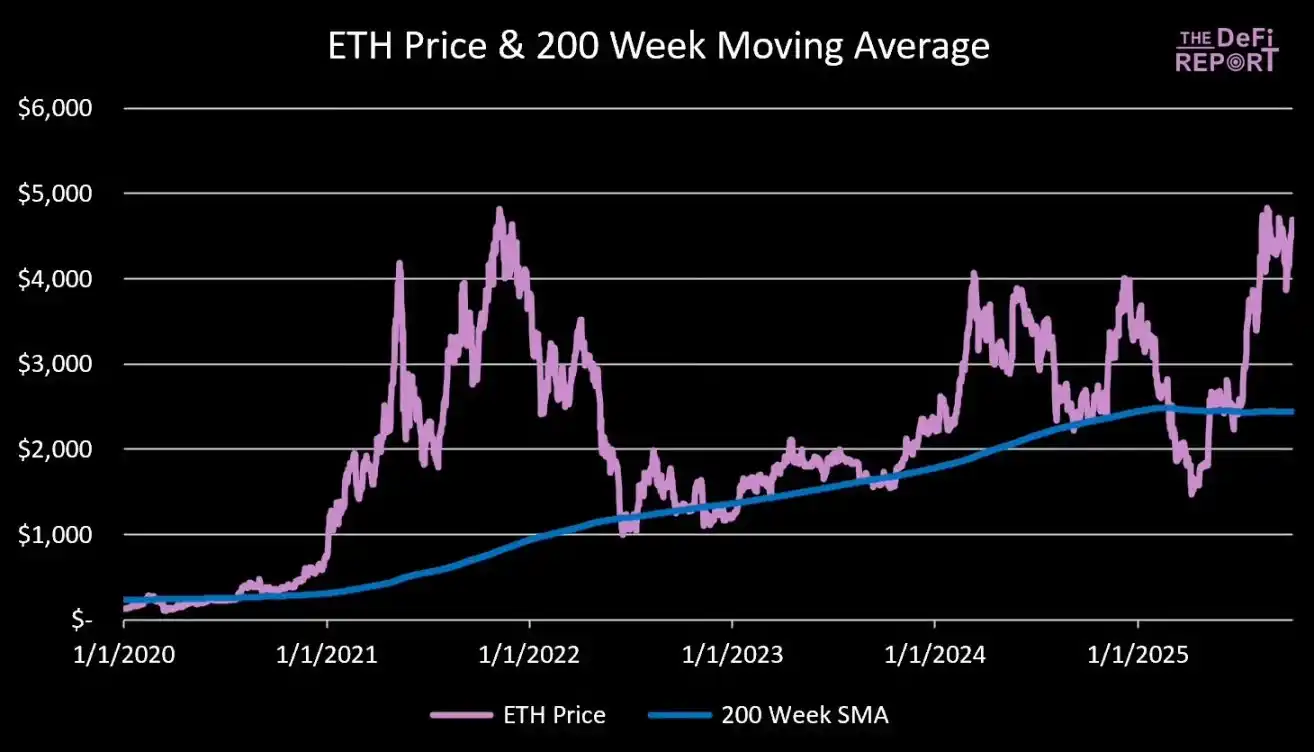
Data Source: The DeFi Report
Currently, Ethereum's trading price is 92% above its 200-week moving average ($2,400).
During the 2021 cycle, when the market peaked, Ethereum's price was 492% above the 200-week moving average.
Scenario Analysis:
· 200% above the 200-week moving average: Ethereum price is $7,300
· 250% above the 200-week moving average: Ethereum price is $8,500
· 300% above the 200-week moving average: Ethereum price is $9,800
· 350% above the 200-week moving average: Ethereum price is $11,000
· 400% above the 200-week moving average: Ethereum price is $12,200
Note: The 200-week moving average is a dynamic indicator, but over time, we are gradually replacing price data from about four years ago in the $3,000-$4,000 range for Ethereum. Therefore, it is expected that the fluctuations in the 200-week moving average will be very small by the end of this year.
Ethereum Price to Realized Price Ratio
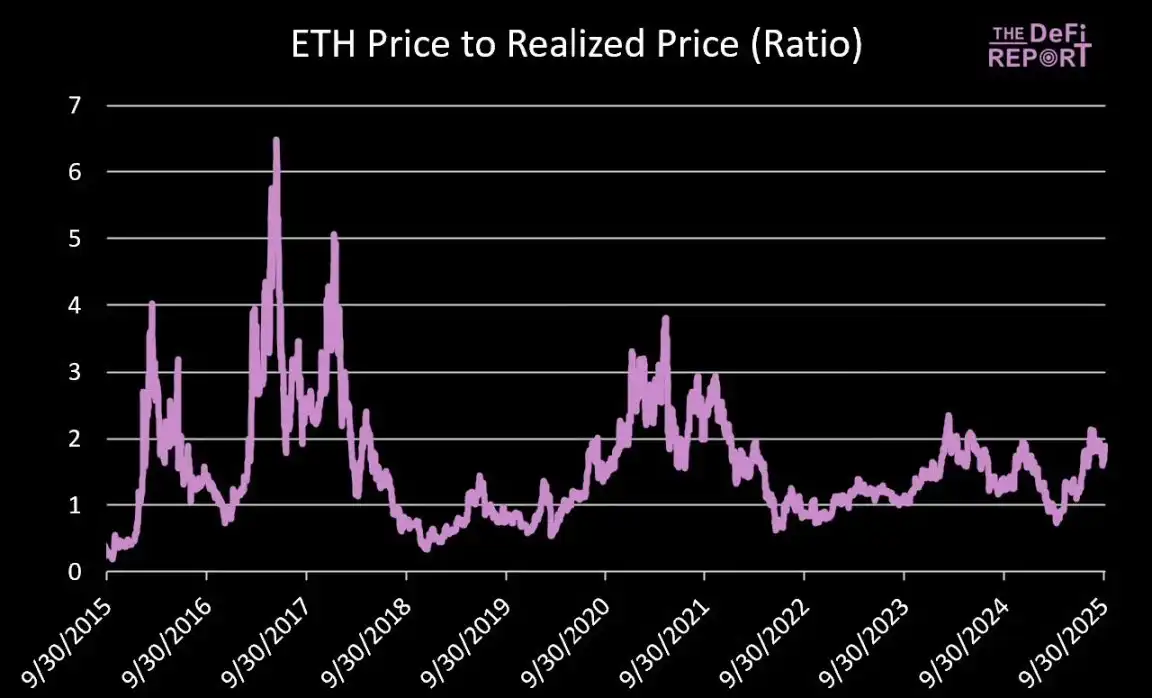
Data Source: The DeFi Report, Glassnode
The realized price can serve as an alternative benchmark for cost. Since January 1, 2017, the average ratio of Ethereum price to realized price has been 1.6. The current ratio is 1.9.
In the 2017 cycle, the peak ratio was 5; in the 2021 cycle, the peak ratio in April was 3.5, and in November, it was 2.9.
Scenario Analysis (assuming the ratio reaches 2.9):
· If the realized price is $3,000: Ethereum price is $8,700
· If the realized price is $3,500: Ethereum price is $10,200
· If the realized price is $4,000: Ethereum price is $11,600
MVRV Z-Score
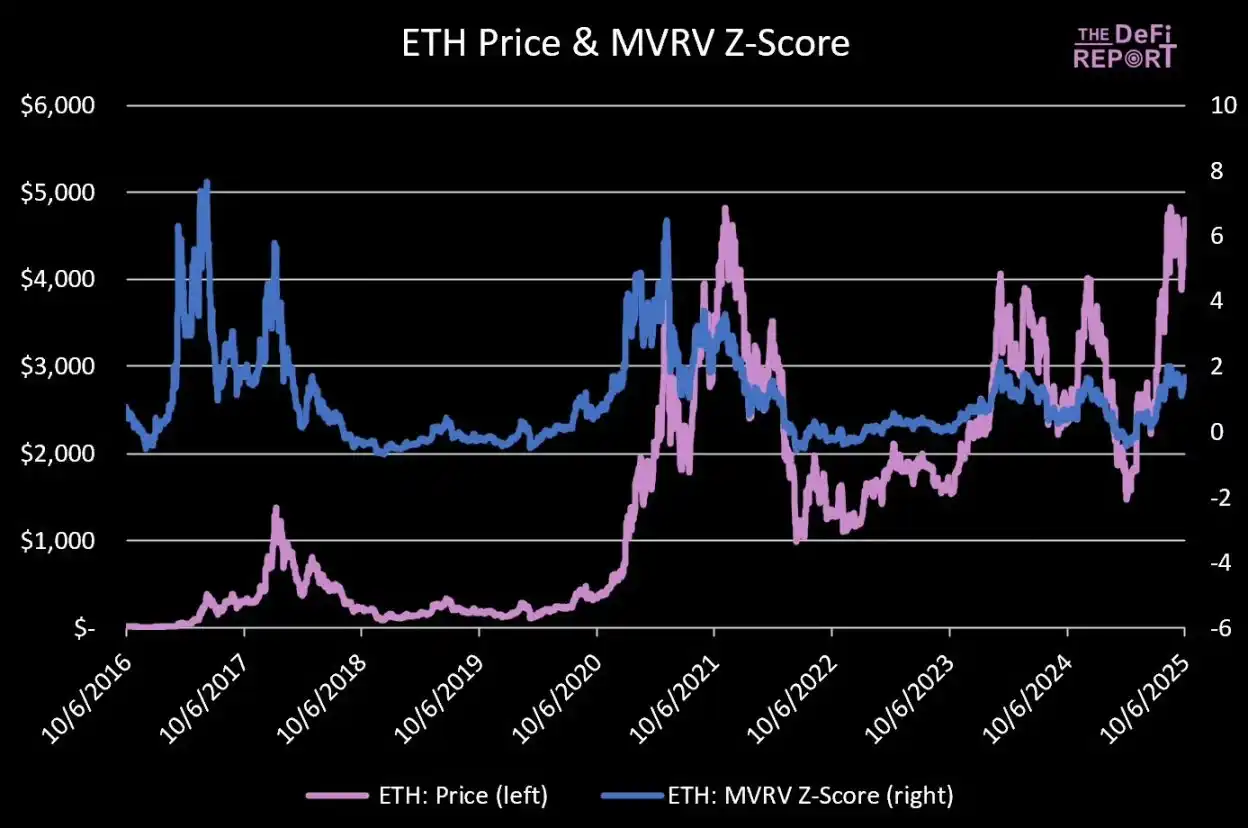
Data Source: The DeFi Report, Glassnode
The Z-score measures how much the market cap is above or below the on-chain cost benchmark in terms of "volatility units." A higher Z-score indicates that the market is overheated; a negative Z-score indicates that the market is undervalued.
Since January 1, 2017, Ethereum's average Z-score has been 0.99, indicating an overall optimistic market sentiment.
The current Z-score is 1.66, which is above the historical average but has not yet reached an overheated state.
In the 2021 cycle, the peak Z-score in April was 6.5, and in November, it was 3.48.
Scenario Analysis:
· If the Z-score is 2.21: Ethereum price is $7,000
· If the Z-score is 2.77: Ethereum price is $8,000
· If the Z-score is 3.33: Ethereum price is $9,000
· If the Z-score is 3.9: Ethereum price is $10,000
Note: Assuming that by the end of this year, the realized price increases by 22% (to $3,000). For reference, the realized price has increased by 24% since this April.
Ethereum to Bitcoin Market Cap Ratio
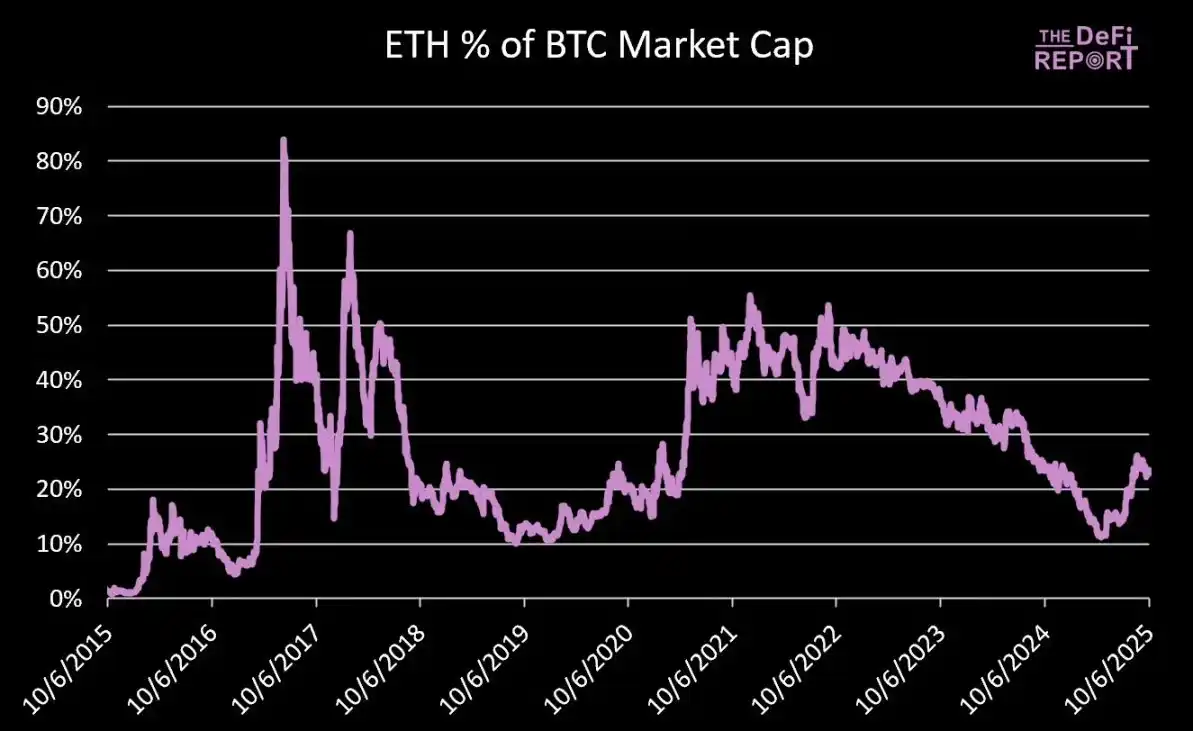
Data Source: The DeFi Report
Currently, Ethereum's market cap is about 23.4% of Bitcoin's market cap.
In November 2021, Ethereum's market cap reached 55.5% of Bitcoin's market cap.
If Bitcoin's price reaches $150,000 (up 23% from the current price), its market cap will reach $3 trillion.
Scenario Analysis:
· If Ethereum's market cap is 35% of Bitcoin's market cap: Ethereum's total market cap is $1.05 trillion, corresponding to a price of $8,658
· If Ethereum's market cap is 45% of Bitcoin's market cap: Ethereum's total market cap is $1.35 trillion, corresponding to a price of $11,132
· If Ethereum's market cap is 55% of Bitcoin's market cap: Ethereum's total market cap is $1.64 trillion, corresponding to a price of $13,559
The core question is whether Bitcoin will see a significant increase. Compared to the last cycle, will Ethereum's increase relative to Bitcoin be moderate or explosive?
Ethereum to Nasdaq Index Ratio
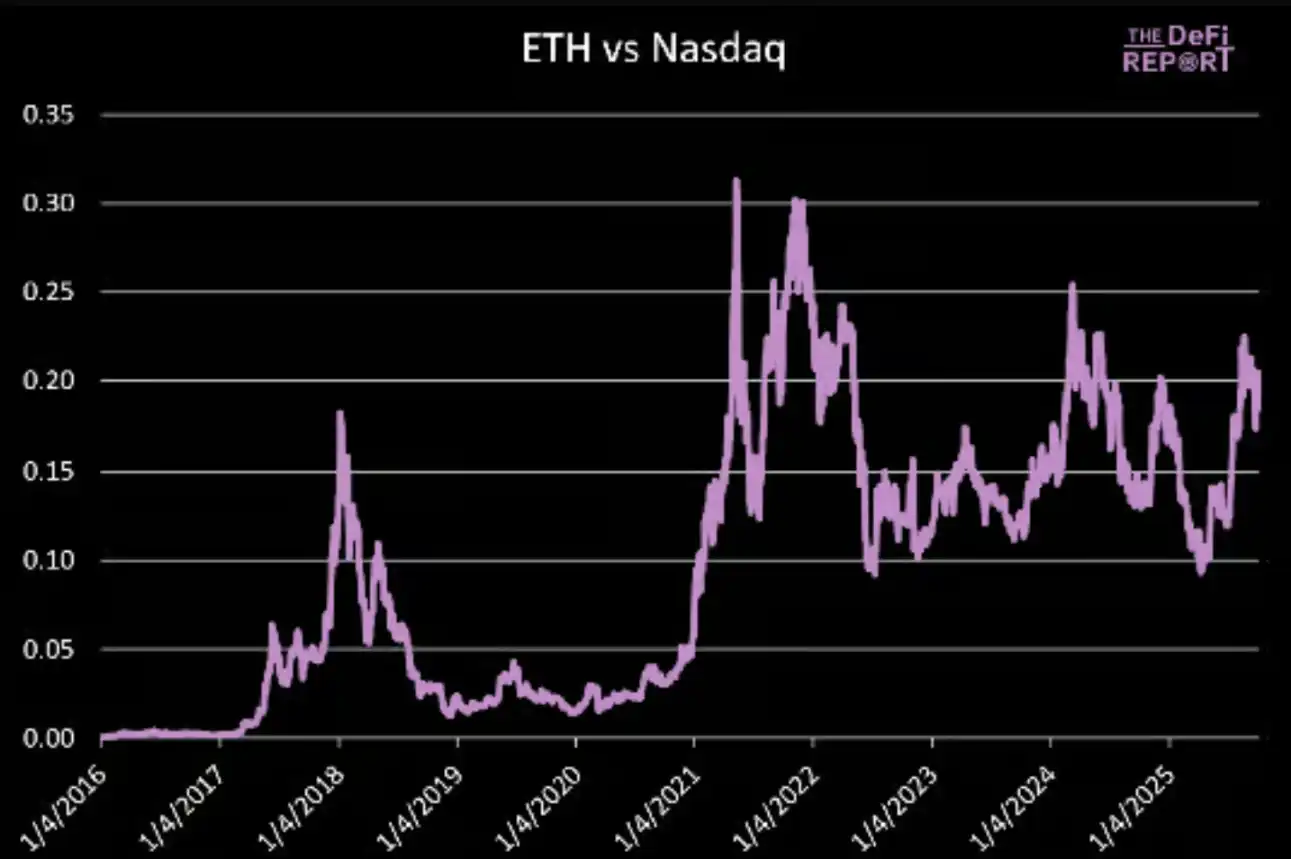
Data Source: The DeFi Report
In May and November 2021, the peak ratios of Ethereum to the Nasdaq index were 0.31 and 0.30, respectively.
The current ratio is 0.20, with the Nasdaq index currently at 22,788 points.
If the Nasdaq index rises by 5% by the end of this year (a cumulative increase of 23% for the year), its point level will reach 23,927 points.
Ethereum Price Scenario Analysis:
· If the ratio is 0.25: Ethereum price is $5,981
· If the ratio is 0.30: Ethereum price is $7,178
· If the ratio is 0.35: Ethereum price is $8,374
· If the ratio is 0.40: Ethereum price is $9,570
Our baseline assumption is that the ratio of Ethereum to the Nasdaq index will continue to rise throughout the cycle, and this cycle will set a new high (exceeding 0.30).
Conclusion
Our basic assumptions are as follows:
· Ethereum price is 250% above the 200-week moving average, corresponding to a price of $8,500;
· Realized price reaches $3,000, and if the price to realized price ratio is 2.9, the corresponding Ethereum price is $8,700;
· Ethereum's market cap reaches 35% of Bitcoin's market cap, and if Bitcoin's price is $150,000, the corresponding Ethereum price is $8,600;
· Ethereum to Nasdaq index ratio sets a new high, and if the ratio is 0.35, the corresponding Ethereum price is $8,300.
If the bull market continues, Ethereum's price may break $10,000; if the market turns bearish, Bitcoin's peak increase will be limited, and Ethereum will also be under pressure.
At the same time, as market sentiment heats up, there is increasing discussion about "extended cycles," which reminds me of the "super cycle" narrative that was prevalent in 2021.
As we mentioned earlier, the baseline assumption remains: within this quarter, Ethereum will reach the peak of this cycle.
免责声明:本文章仅代表作者个人观点,不代表本平台的立场和观点。本文章仅供信息分享,不构成对任何人的任何投资建议。用户与作者之间的任何争议,与本平台无关。如网页中刊载的文章或图片涉及侵权,请提供相关的权利证明和身份证明发送邮件到support@aicoin.com,本平台相关工作人员将会进行核查。


