Original Author: Michael Nadeau, The DeFi Report
Original Translation: BitpushNews
The adoption cycle of cryptocurrency typically includes a three-year growth expansion period, followed by a bear market lasting about a year.
Starting from the low point of BTC price in November 2022, the current expansion period has lasted 1,044 days. For reference, the expansion period in 2021 lasted 1,063 days, and in 2017 it was 1,065 days.
By this measure, we are clearly at the "end of the cycle" of the current expansion phase.
But how do the current data and key indicators compare to those in September 2021?
We will answer this question in this report.
Disclaimer: The views in this article are the author's personal opinions and should not be considered as investment advice.
Realized Profits and Holding Duration Destruction Indicators
Realized Profits
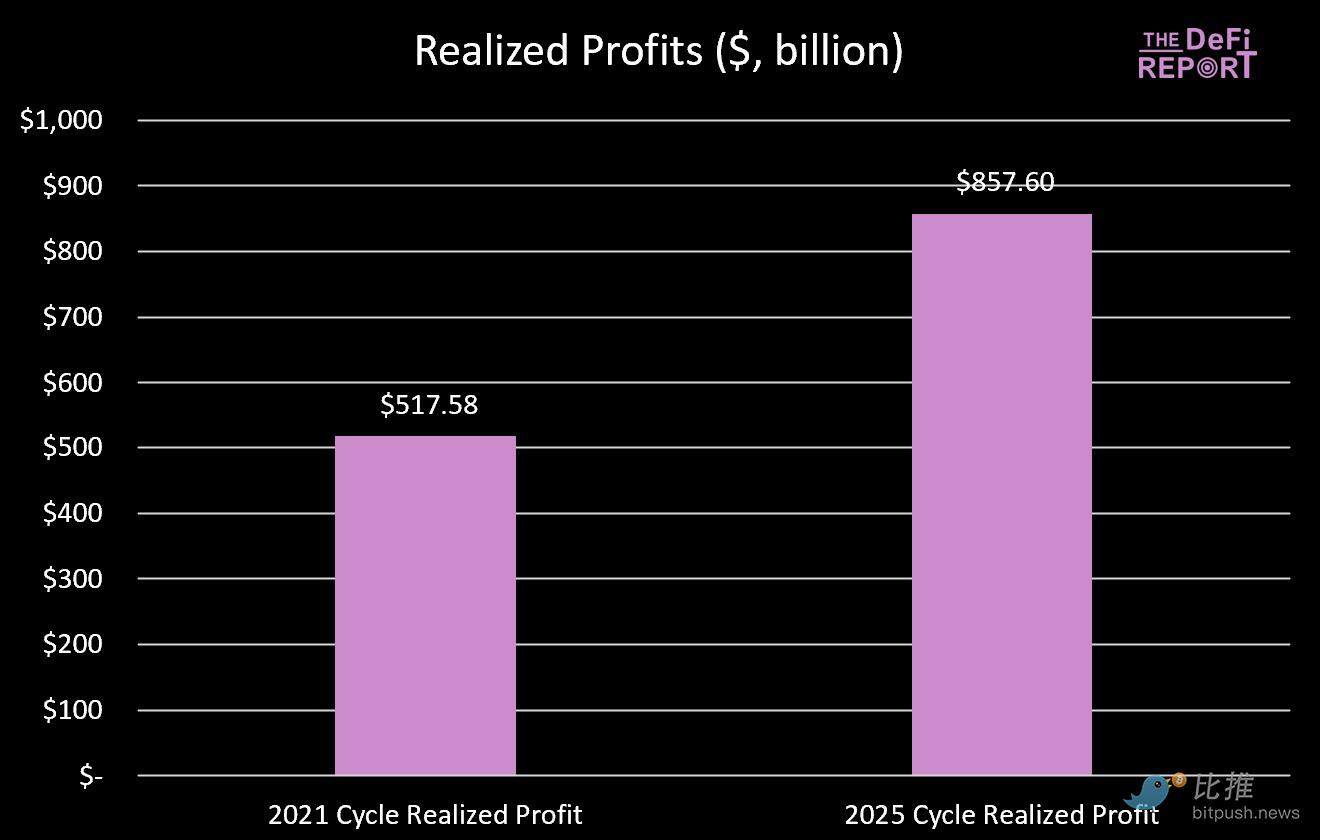
According to Glassnode data, BTC investors have realized $857 billion in profits during this cycle—65% higher than the 2021 cycle.
Given that the higher the BTC price, the more profits long-term investors gain each cycle, this phenomenon is expected.
A standardized way to compare is to measure realized profits against the market capitalization of each cycle.
The peak market capitalization of the 2021 cycle was $1.26 trillion, with a realized profit to market cap ratio of 0.41.
The current market cap of BTC is $2.28 trillion, and the current realized profit to market cap ratio for this cycle is 0.38.
Conclusion? From the perspective of "wealth creation," we have currently reached a level similar to that of the entire 2021 cycle.
Realized profits data chart
Holding Duration Destruction Indicators
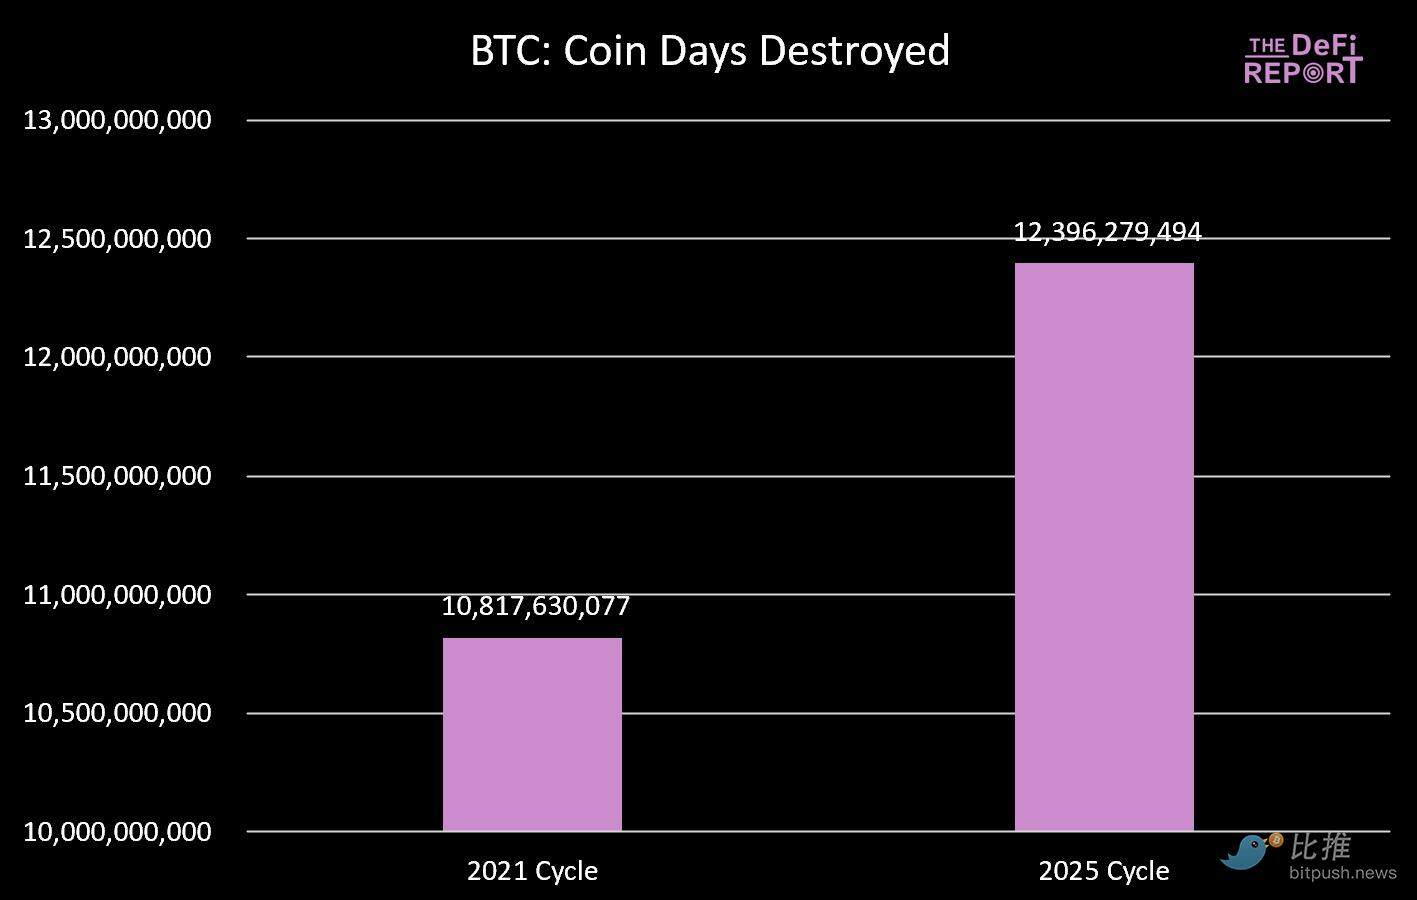
Another angle to examine profit-taking is the "holding duration destruction indicator."
According to Glassnode's definition, this indicator measures the total number of days tokens were held before being spent.
As shown in the figure below, the total "coin days destroyed" in this cycle has exceeded that of the 2021 cycle by 15%.
This also aligns with the characteristics of the "end of the cycle."
Coin days destroyed data chart
Long-Term Holder Supply
The behavior pattern of long-term holders in this cycle is similar to that of the previous cycle.
From October 2020 to March 2021, the supply of long-term holders decreased by 13.5% (corresponding to the first price peak in April 2021). Subsequently, the supply of long-term holders rebounded and continued to rise for the remainder of the cycle.
Similarly, from December 2023 to February 2025, the supply of long-term holders decreased by 12.4%, before rebounding to the current level of 73%.
Conclusion: Long-term holders tend to allocate tokens to new funds entering the market. In the 2021 cycle, this occurred during the first price peak in April 2021.
In the current cycle, this happened in the fourth quarter of last year and continued into the first quarter of this year.
If we expect an explosive fourth quarter, we need to see new funds flowing into the market—something we did not witness during the same period in the previous cycle.

Long-term holder supply data chart
Bitcoin Dominance
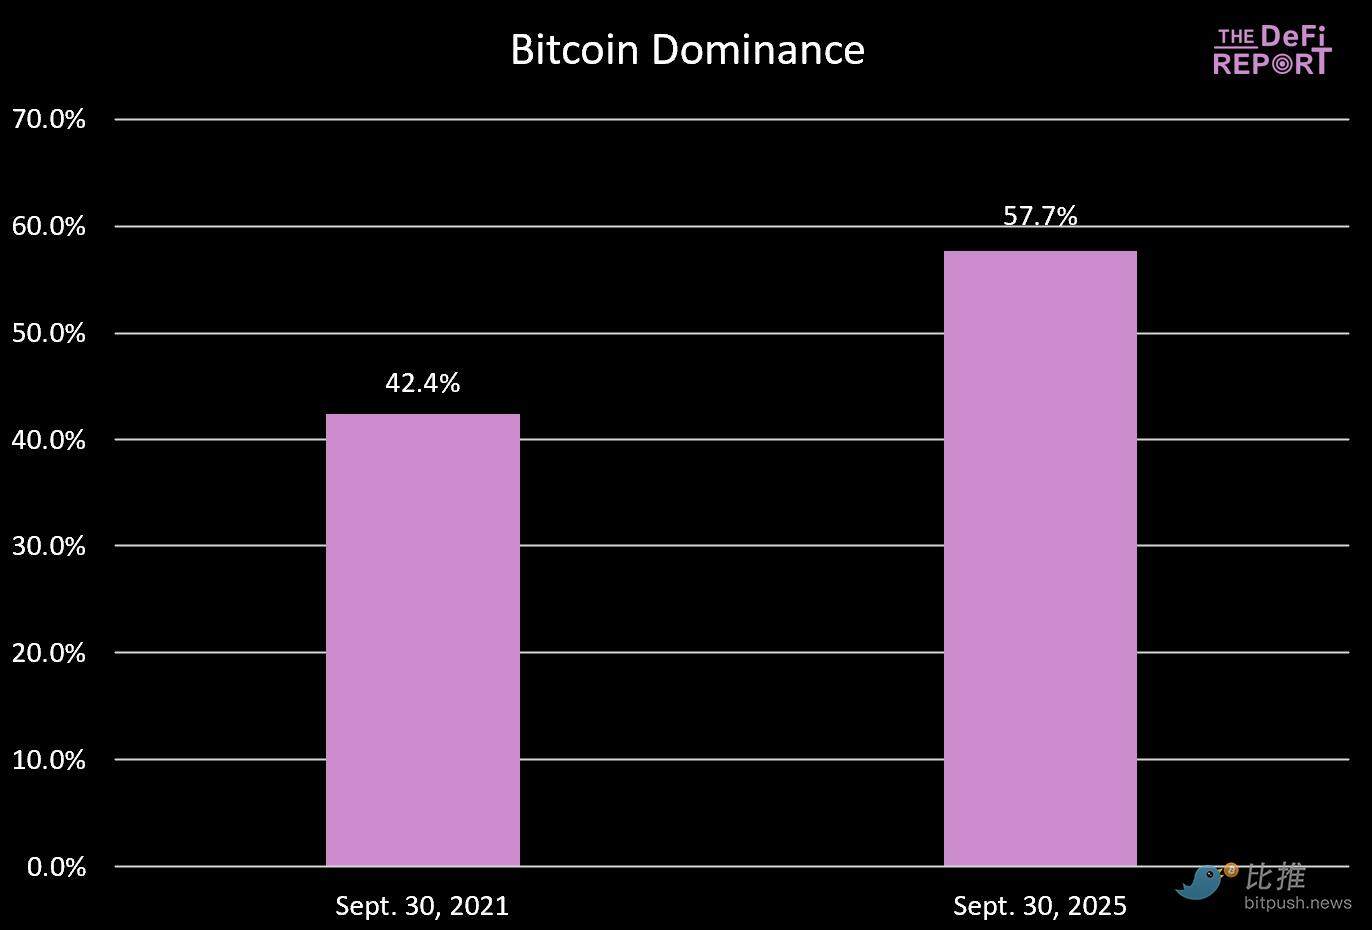
In the past two cycles, the market peaked when Bitcoin dominance fell to around 40%.
We are far from that level in this cycle. We believe there are several reasons:
- The financialization of BTC through ETFs and institutional participation in this cycle.
- The maturity of the cryptocurrency market. In the previous cycle, every L1, except Ethereum, was a "shiny new toy" for investors to speculate on. Additionally, NFTs and DeFi were still in their early stages—investors may have severely overestimated their maturity, use cases, and sustainability. The situation is different now; the market has matured.
- The 2021 cycle saw significant fiscal and monetary policy support due to COVID, a situation that may not repeat. When altcoins perform far better than BTC, there is little motivation to hold BTC. The situation is different now, and asset selection has become crucial.
We still believe that BTC dominance will decline further, but it will not reach the levels seen in the past.
Bitcoin dominance data chart
200-Week Moving Average
We closely monitor the 200-week moving average for two reasons:
- During bear markets, Bitcoin often falls to its 200-week moving average;
- In the past two cycles, when the 200-week moving average converged with the previous cycle's peak, Bitcoin peaked;
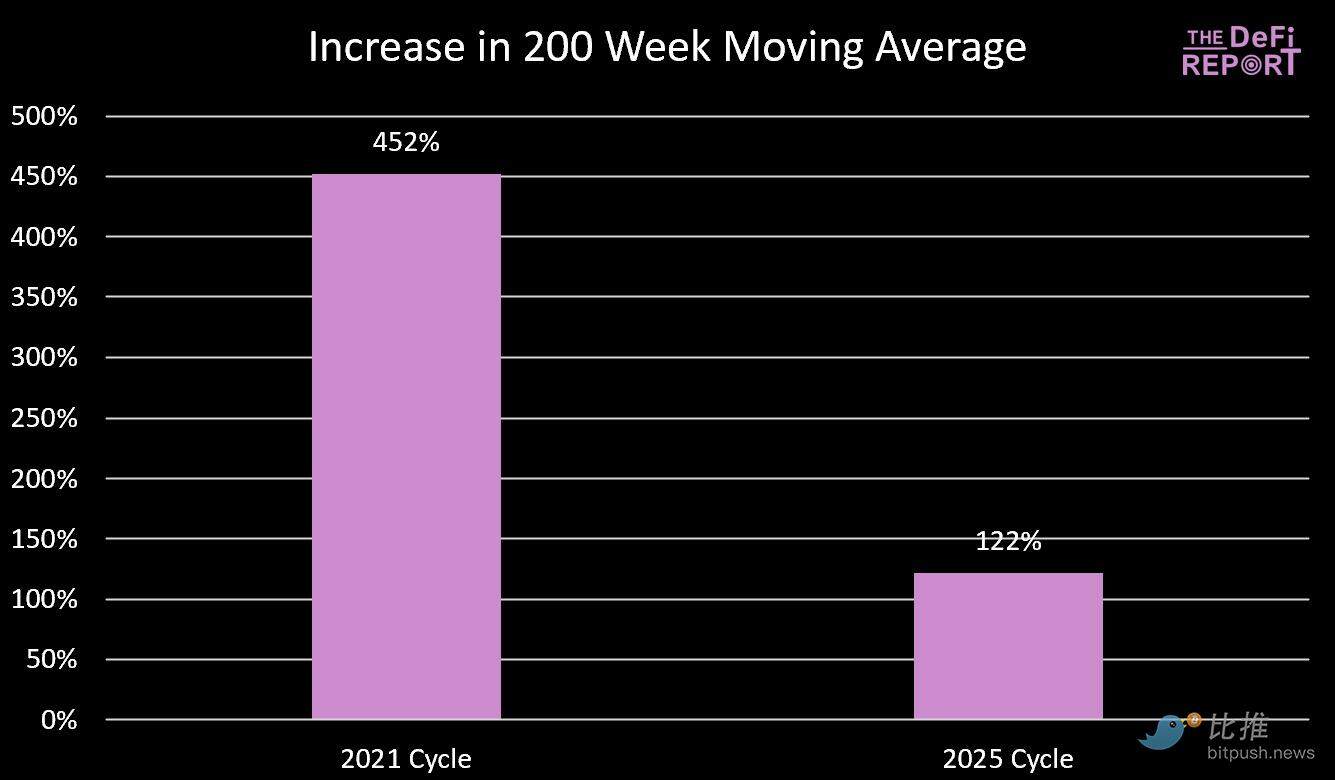
The current 200-week moving average is $53,100.
Will we eventually drop to $66,000 (the previous cycle's peak) this year?
The likelihood is low, as our estimates show that even with a 40% surge in the coming months, the 200-week moving average will be in the $57,000 range. Of course, if the cycle extends into next year, returning to those levels is possible.
Conclusion: As the cycle progresses, the law of diminishing returns is becoming evident, as shown in the figure below.
200-week moving average data chart
Realized Price and MVRV-Z Score
Realized Price
According to Glassnode data, Bitcoin's realized price (representing the cost basis of all coins on the network) is currently $53,800.
Similar to the 200-week moving average, Bitcoin often returns to its realized price during bear markets, and cycles typically peak when the realized price reaches levels consistent with the previous cycle's peak.
Like the 200-week moving average, we do not expect this indicator to reach the previous cycle's peak this year—further highlighting the law of diminishing returns.
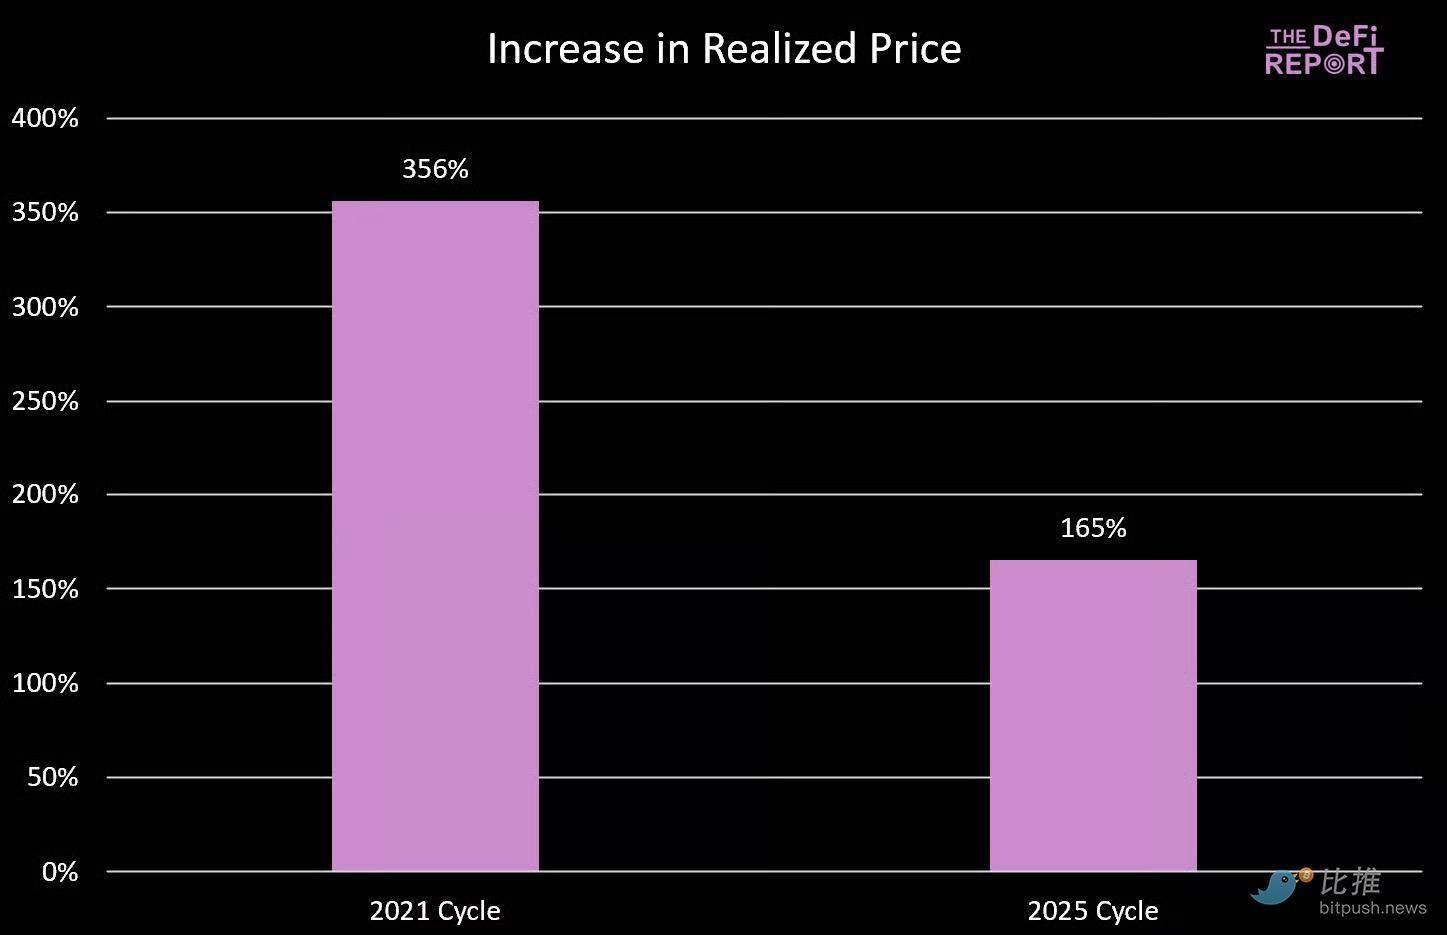
Realized price data chart
MVRV-Z Score
The MVRV-Z score measures how much Bitcoin's market cap is "stretched" relative to its realized value, adjusted for historical volatility.
The current reading of 2.28 indicates that Bitcoin's market cap deviates from its cost basis by about 2.28 standard deviations from historical norms.
Interestingly, we are now at a higher level than during the same period in the 2021 cycle. At that time, Bitcoin rose about 50% in October/November, ending the cycle with an MVRV-Z score of 3.49.
If this indicator approaches 3 in the current cycle, BTC prices could reach the range of $160,000 to $170,000 (a 40-50% increase).
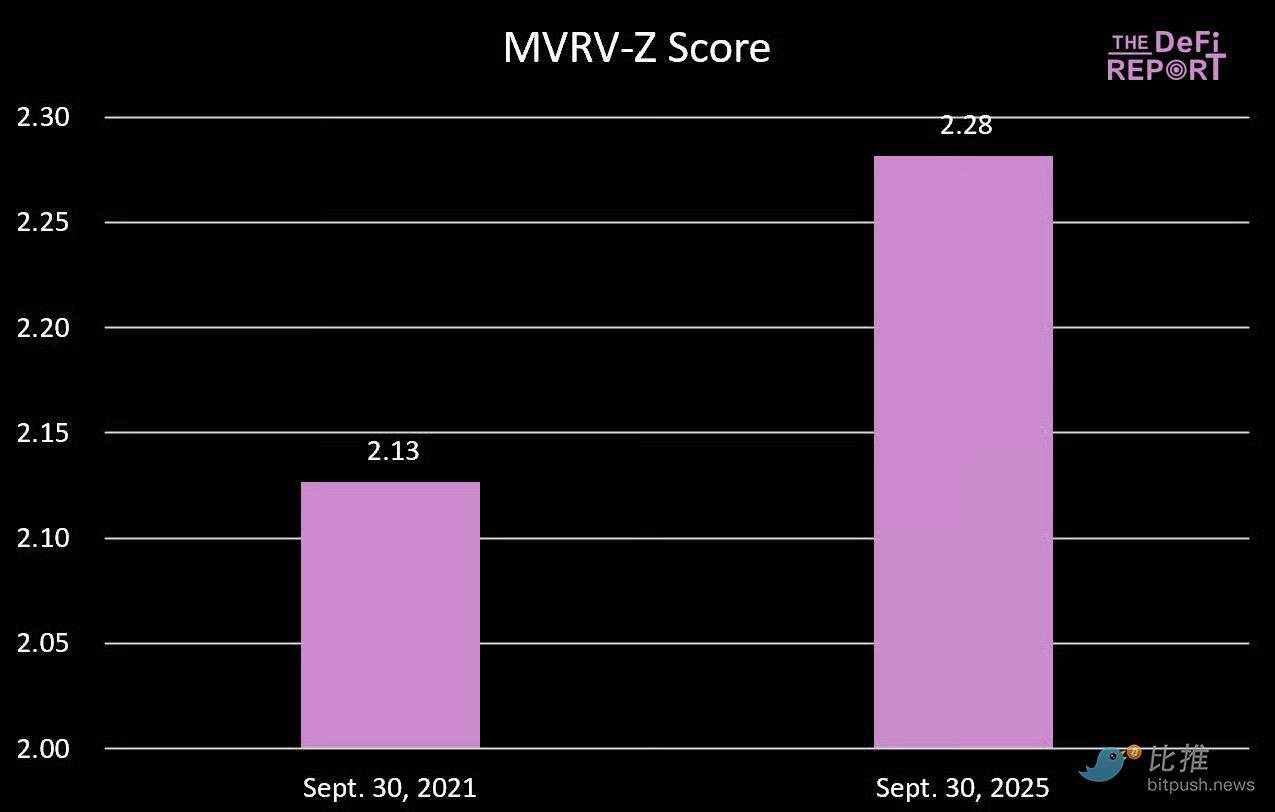
MVRV-Z score data chart
Fear and Greed Index
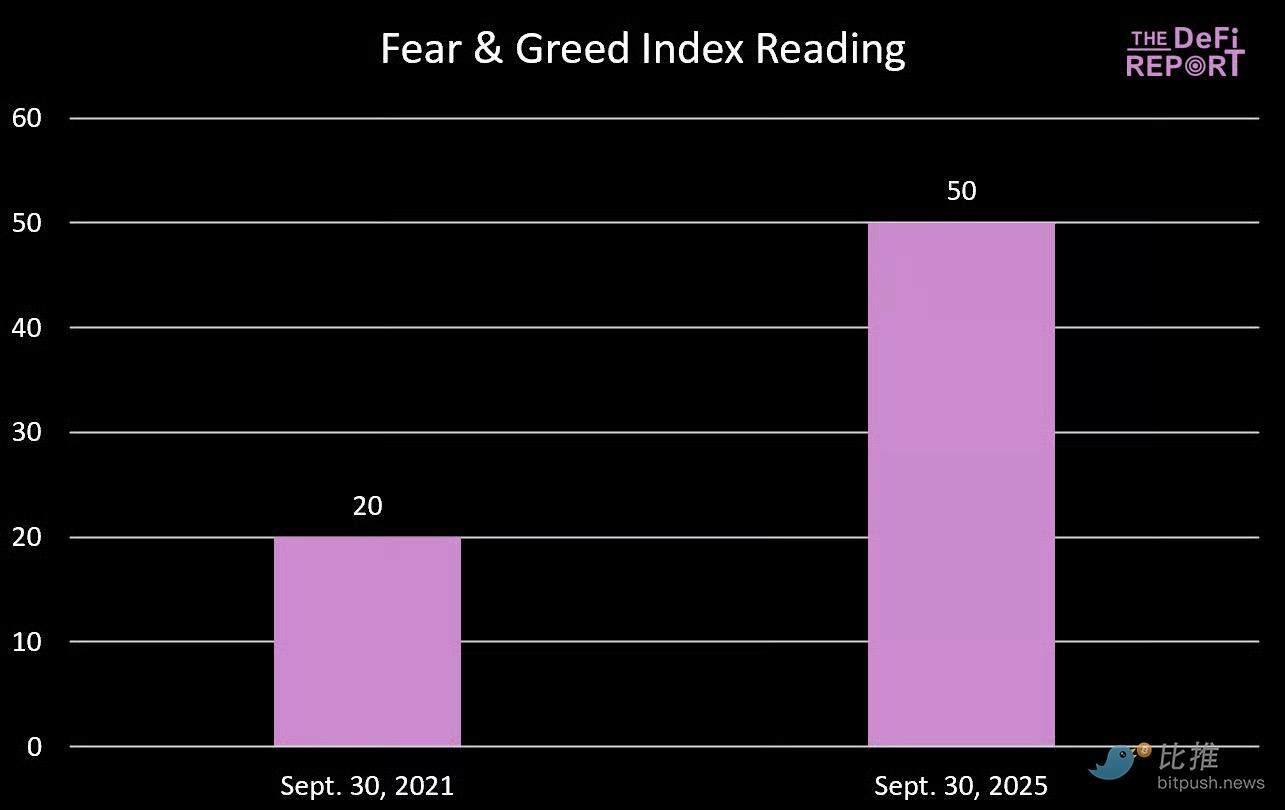
Fear and Greed Index data chart
If you think the current market is tense, the market was even more fearful during the same period in 2021. In fact, in September 2021, we were in a state of extreme fear. At that time, BTC had just pulled back 20%, dropping to $43,000, and then rose to a peak of $66,000 over the next five weeks (a 53% increase).
Summary Outlook
There is no law that requires Bitcoin to follow the "four-year cycle" path we have historically adhered to.
However, after closely examining the data, it is hard to deny the possibility of a peak in the fourth quarter.
Why?
We believe there are several reasons that maintain the "four-year cycle" framework:
- Narrative anchoring. Investors expect a "post-halving bull market," which influences investor positioning, the marketing cycles of crypto-native companies, and media coverage. Reflexivity makes this pattern self-fulfilling.
- Liquidity and credit cycles. Halving cycles have historically synchronized with global debt refinancing cycles, amplifying the liquidity needed to generate a crypto bull market.
- The mechanism of the four-year halving cycle and its impact on miner operations, tightening supply when demand often returns to the market.
- Product/innovation rhythm. Venture capital tends to fund the industry according to liquidity cycles synchronized with the four-year halving cycle. These projects take time to enter the market, and new innovations and narratives emerge explosively, amplifying the cryptocurrency adoption cycle.
- Volatility. Investors expect deep bear markets in the crypto market to buy their desired assets at a discount. This naturally affects profit-taking, creating a self-reinforcing feedback loop.
- Based on observed data and the deep-rooted qualitative/behavioral factors, our fundamental assumption is that BTC will peak again in the fourth quarter.
免责声明:本文章仅代表作者个人观点,不代表本平台的立场和观点。本文章仅供信息分享,不构成对任何人的任何投资建议。用户与作者之间的任何争议,与本平台无关。如网页中刊载的文章或图片涉及侵权,请提供相关的权利证明和身份证明发送邮件到support@aicoin.com,本平台相关工作人员将会进行核查。


