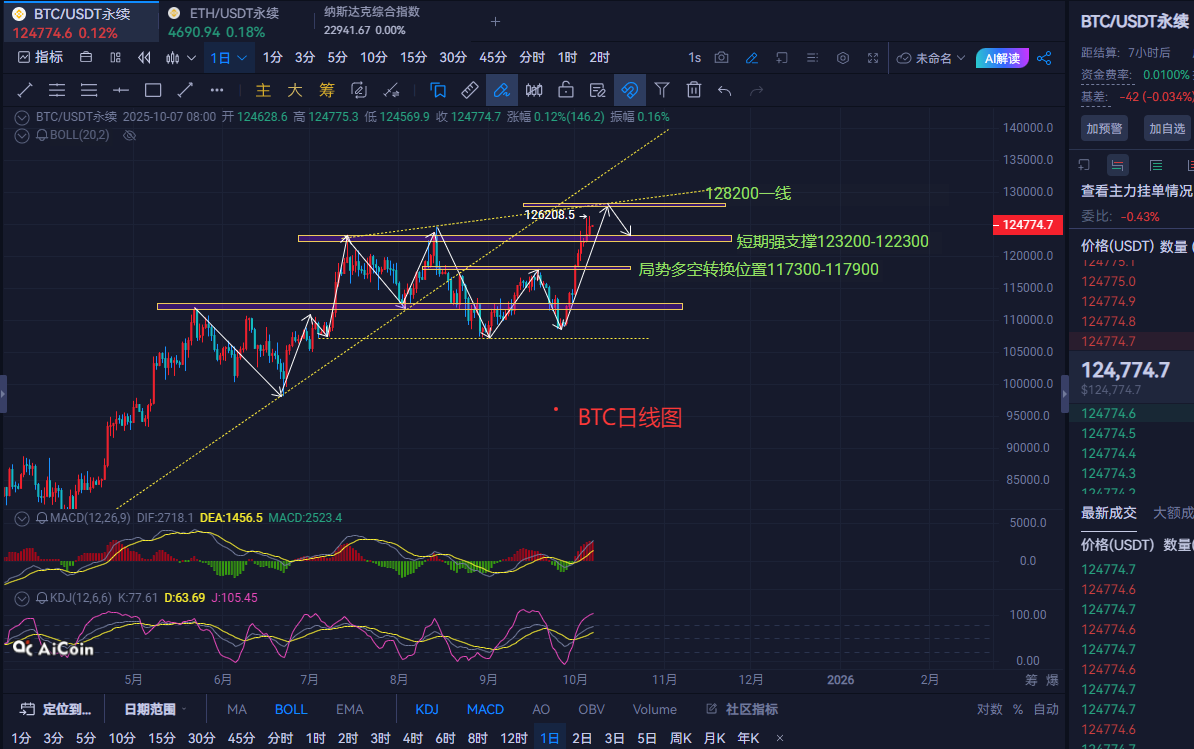
10 Morning Analysis: From the daily chart, the price of Bitcoin has closed positively for six consecutive days, reaching a new high around 2 AM in the new phase area. The current market and the overall technical indicators show a clear upward trend in the short term. Although there is a possibility of a short-term pullback, the bearish forces are struggling to form sustained pressure. Whenever the price dips to key support levels, it triggers a strong rebound, and the market's bullish sentiment is rising. It is difficult to analyze now; we can only provide support and resistance levels for reference based on the chart.
Ethereum's recent price, although showing a trend of oscillating upward, is still within a phase without breaking new highs, clearly driven by Bitcoin's rise. A small adjustment of bearish candlestick patterns has formed in the 4-hour cycle, indicating a weakening of short-term bullish momentum. The MACD technical indicator is above the zero line and continues to expand, but the histogram is starting to shorten, indicating a decline in upward momentum. On October 7, trading volume shrank, showing an increase in market wait-and-see sentiment, with a temporary balance between bullish and bearish forces.
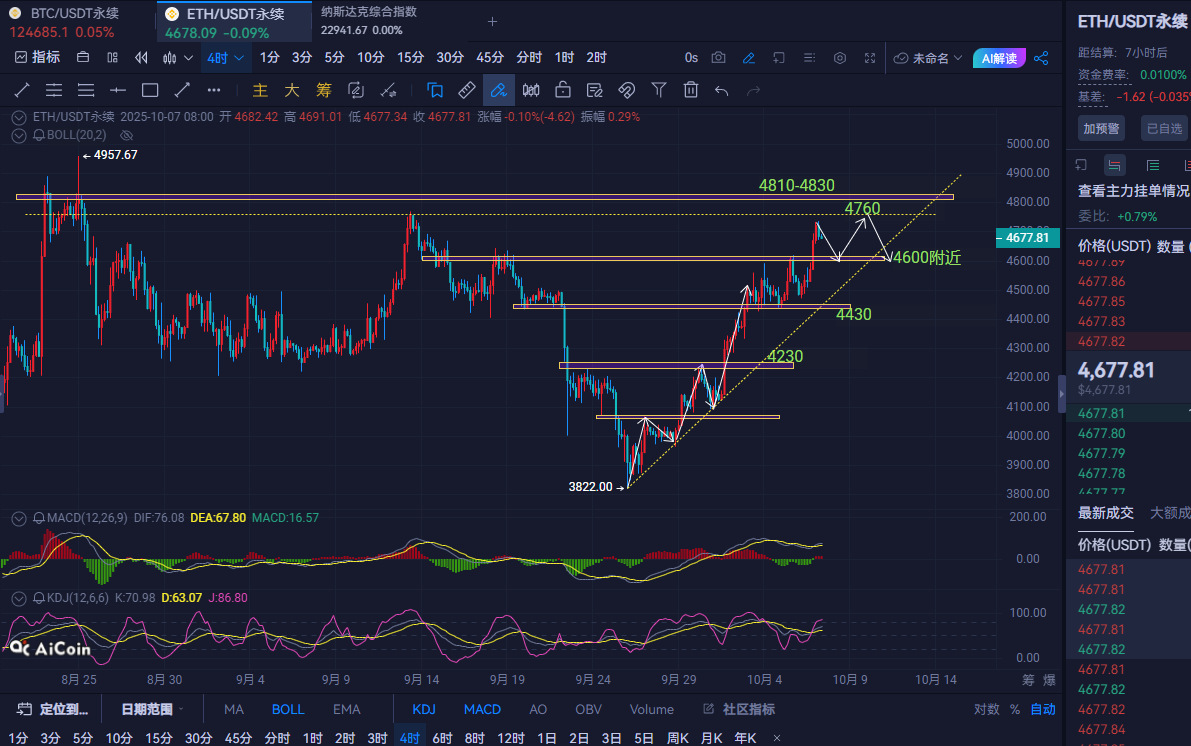
In summary, in the short term, whether for Bitcoin or Ethereum, the upward trend is too strong, and we can only focus on low buying. The volatility is significant, and we can only provide support and resistance levels for reference. Please invest cautiously and consider taking profits. (Follow the public account: Ethereum Kai)
免责声明:本文章仅代表作者个人观点,不代表本平台的立场和观点。本文章仅供信息分享,不构成对任何人的任何投资建议。用户与作者之间的任何争议,与本平台无关。如网页中刊载的文章或图片涉及侵权,请提供相关的权利证明和身份证明发送邮件到support@aicoin.com,本平台相关工作人员将会进行核查。


