The U.S. federal government officially shut down at midnight on October 1st Eastern Time due to a budget impasse, forcing hundreds of thousands of civil servants to take leave. The cryptocurrency market has been positively affected, with Bitcoin rising to $120,291 in the early hours of the 3rd, marking its highest point in nearly a month and a half. As of the time of writing, the price is $119,786, with a 24-hour increase of 4.1%. Ethereum has also seen a rise, currently priced at $4,433, with a 24-hour increase of approximately 5.33%.
Currently, the government shutdown is viewed by the market as a catalyst for pushing the Federal Reserve to accelerate easing. Additionally, the ADP employment report released on the evening of the 1st showed a decrease of 32,000 jobs, marking the lowest point in a year and a half, far below expectations. This is seen as a signal of economic cooling, leading to bets that the Federal Reserve will cut interest rates again.
The current interest rate cut schedule indicates that the probability of a 25 basis point cut at the October meeting is approaching 99%, with about a 90% chance of two cuts before the end of the year. Meanwhile, the 10-year Treasury yield has dropped from 4.16% to 4.09%, and the 2-year yield has decreased from 3.6% to 3.53%, potentially providing additional space for stock market valuations.
However, underlying short-term optimism may hide concerns. This shutdown is estimated to last for 11 days, and if it exceeds that, economic data will be significantly delayed. Key statistics such as unemployment claims and CPI may not be released on time, leading the market to price in a lack of information, which could amplify volatility in the cryptocurrency market. It is also important to note that once the U.S. government resumes operations, the progress of dozens of cryptocurrency spot ETFs awaiting SEC approval will accelerate, potentially having a significant impact on the crypto market.
Bitcoin Four-Hour Chart
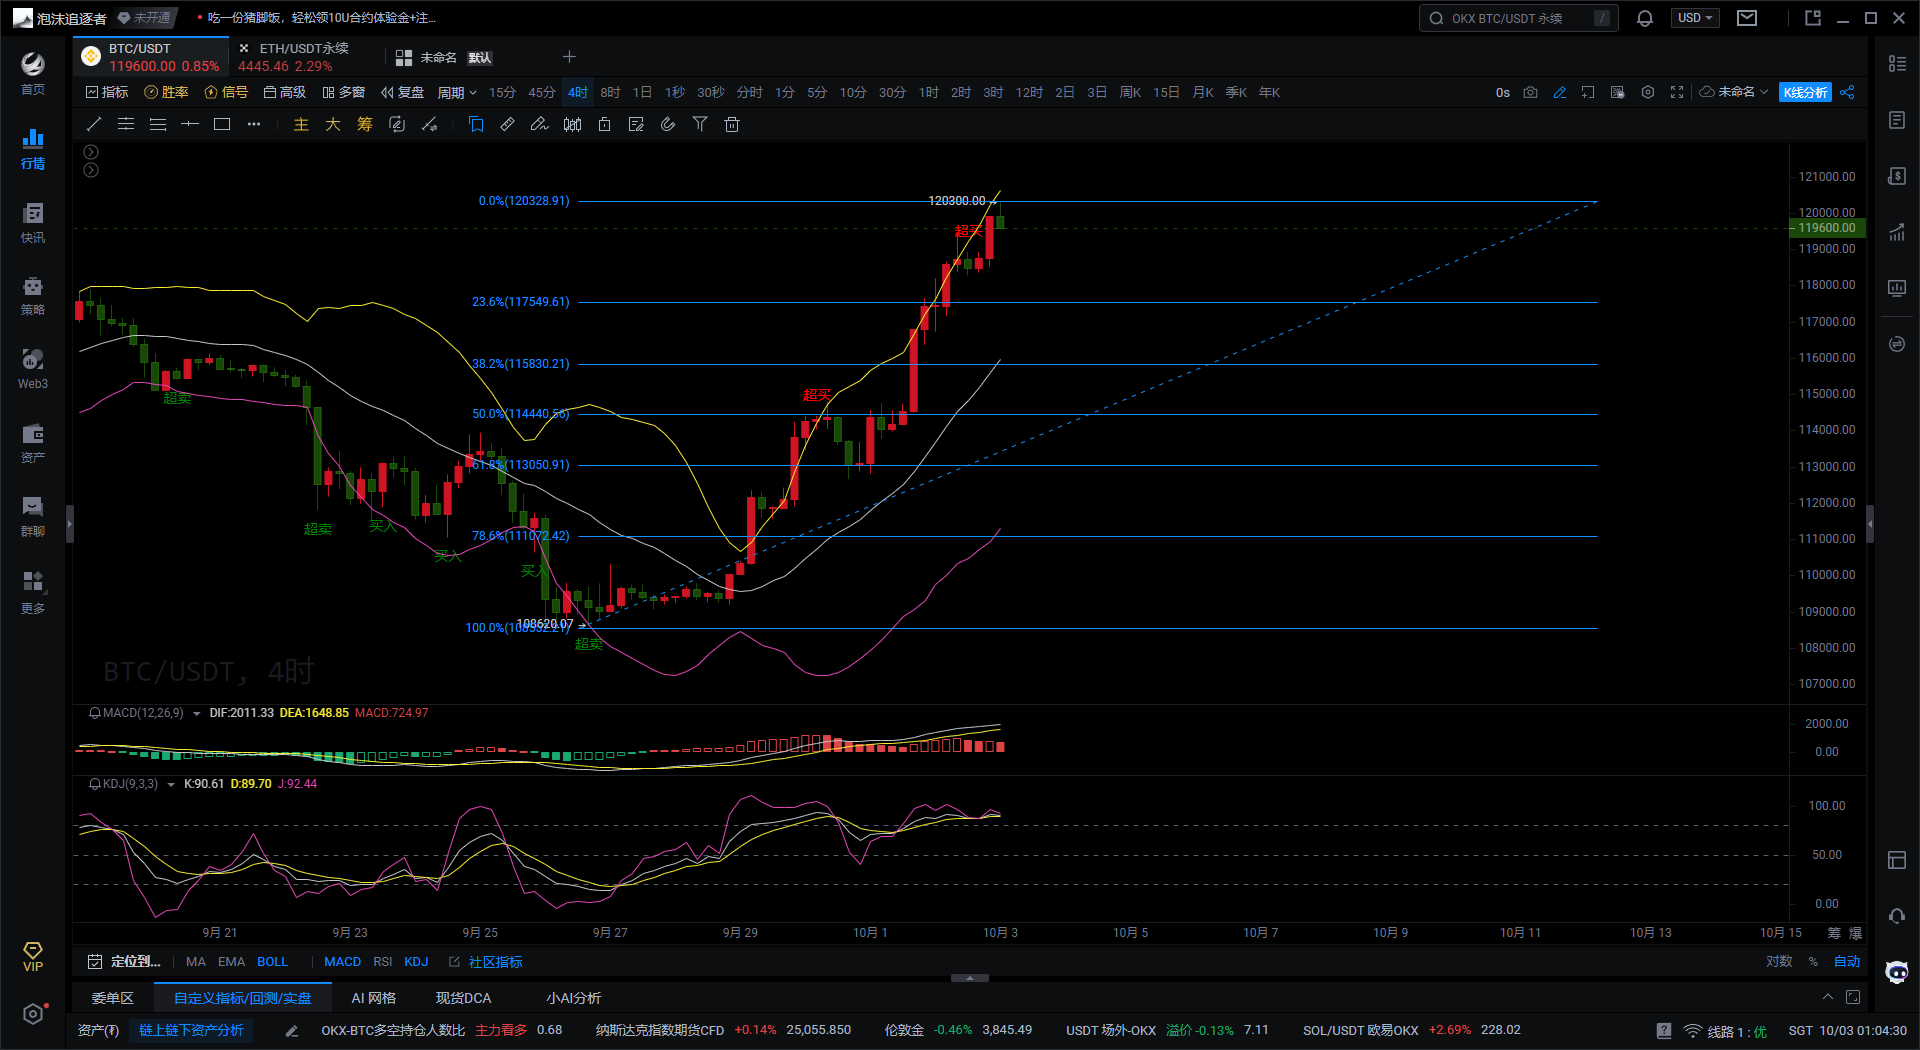
Bitcoin is currently priced around $119,600. This round of increases has risen from a low of $109,592 to a high of $120,300 before facing resistance and retreating. From a technical perspective, the market may face short-term pullback pressure, but overall it remains in a bullish pattern. The short-term support level at the 23.6% retracement is at $117,549, and if it pulls back to this level, it needs to be closely monitored. The 38.2% support level is at $115,830, and if it breaks below this, the rebound strength will weaken. The 50% strong support is at $114,440. The upper resistance level of $120,300 has been tested once; if it breaks through and stabilizes, it may further challenge the $122,000–$123,000 range.
The DIF line and DEA line are both operating above the zero axis, indicating a bullish trend. However, the MACD red histogram is gradually shortening, suggesting that upward momentum is weakening, and there may be short-term fluctuations or pullbacks. If the DIF crosses below the DEA, forming a death cross signal, it may trigger a deeper pullback.
Currently, the K, D, and J lines are all in the 90-92 overbought zone, indicating short-term overheating. The J line has turned downward, showing pullback pressure. If the K and D lines move down simultaneously to form a death cross signal, it may enter a pullback phase. The Bollinger Bands indicator shows that the price previously broke through the upper band to $120,300 and has now retreated to near the upper band. If it stabilizes above the upper band, the bulls remain strong; if it breaks below the upper band, it may approach the middle band at $115,500, coinciding with the Fibonacci 38.2%–50% support range, becoming a target for pullback.
In summary, if $120,000–$120,300 encounters resistance, it may experience high-level fluctuations or pullbacks, with support to watch at $117,500–$115,800. If it holds above $115,800 with increased volume, it may attack $120,300–$122,000 again; if it breaks below $114,400, it may indicate the end of the rebound, potentially retesting $112,000–$110,000.
Based on the above analysis, the following suggestions are provided for reference:
1. If Bitcoin pulls back to stabilize at $117,500–$115,800, consider going long, targeting above $120,000.
2. If Bitcoin faces continuous resistance at $120,300, consider shorting, targeting $117,500–$115,000.
Risk Warning: If it directly breaks through $120,300 and stabilizes effectively, the short strategy will be invalidated, and a bullish view should be taken.
Instead of giving you a 100% accurate suggestion, it is better to provide you with the correct mindset and trend. Teaching someone to fish is better than giving them fish; learning the mindset will help you earn for a lifetime!
Time of writing: (2025-10-03-01:00)

(Written by - Daxian Says Coin) Disclaimer: There may be delays in online publication; the above suggestions are for reference only. Investment carries risks; please proceed with caution!
免责声明:本文章仅代表作者个人观点,不代表本平台的立场和观点。本文章仅供信息分享,不构成对任何人的任何投资建议。用户与作者之间的任何争议,与本平台无关。如网页中刊载的文章或图片涉及侵权,请提供相关的权利证明和身份证明发送邮件到support@aicoin.com,本平台相关工作人员将会进行核查。


