Crypto Circle News
October 2 Hot Topics:
1. Lighter announces the launch of the Ethereum L2 mainnet and the start of the second season of the points program.
2. Former Susquehanna executive Bart Smith appointed CEO of Avalanche Treasury Company.
3. Musk becomes the world's first person with a net worth exceeding $500 billion.
4. Plasma clarifies rumors related to XPL: denies the team is ex-Blast and has not collaborated with Wintermute.
5. SUI Group partners with Ethena to launch two stablecoins aimed at reducing Sui's reliance on USDC.
Trading Insights
Moving averages! They will give you the most direct guidance! Think of the three moving averages as three guiding stars; understanding their "actions" means grasping the lifeblood of trading.
- Moving Average Roles: Each has its segment, each performs its duty.
- 5-day line: Short-term "sentinel," reacts the fastest, responsible for capturing immediate rise and fall signals.
- 30-day line: Medium-term "judge," anchors the mid-term trend, more stable movement.
- 60-day line: Long-term "stabilizer," determines the big direction, once clear, it's hard to reverse.
- Signal Interpretation: Understand the actions, execute precisely.
- When the 5-day line crosses above the 30-day and 60-day lines, it's a signal that the market is about to "power up"; conversely, if the 5-day line crosses below, you must immediately reduce your position—don't hesitate.
- The worst scenario is when moving averages "fight"—entering when the 5-day and 30-day lines are tangled is no different from gambling. The real opportunity is when all three lines "march in step" and point in the same direction.
- The more extreme the market, the more you need moving averages to "guide" you.
- Crypto market surges and drops? Don't be afraid; moving average strategies are even more effective: a breakthrough of the 5-day line is an "attack order," while a turn of the 60-day line is a "retreat order." Simple to the extreme, yet frighteningly precise.
- Discipline is the lifeline; execution must be "ruthless."
- How many people have their plans written down but get flustered in sudden market movements? Moving averages never lie; they force you to be an "emotionless executor."
- Remember: you can doubt your judgment, but never doubt the collective force of moving averages—this is a rule built on real money.
LIFE IS LIKE
A JOURNEY ▲
Below are the real trading group orders from the Big White Community this week. Congratulations to the friends who followed along; if your operations are not going smoothly, you can come and test the waters.
Data is real, and each order has a screenshot from the time it was issued.
**Search for the public account: *Big White Talks Coins*
BTC
Analysis
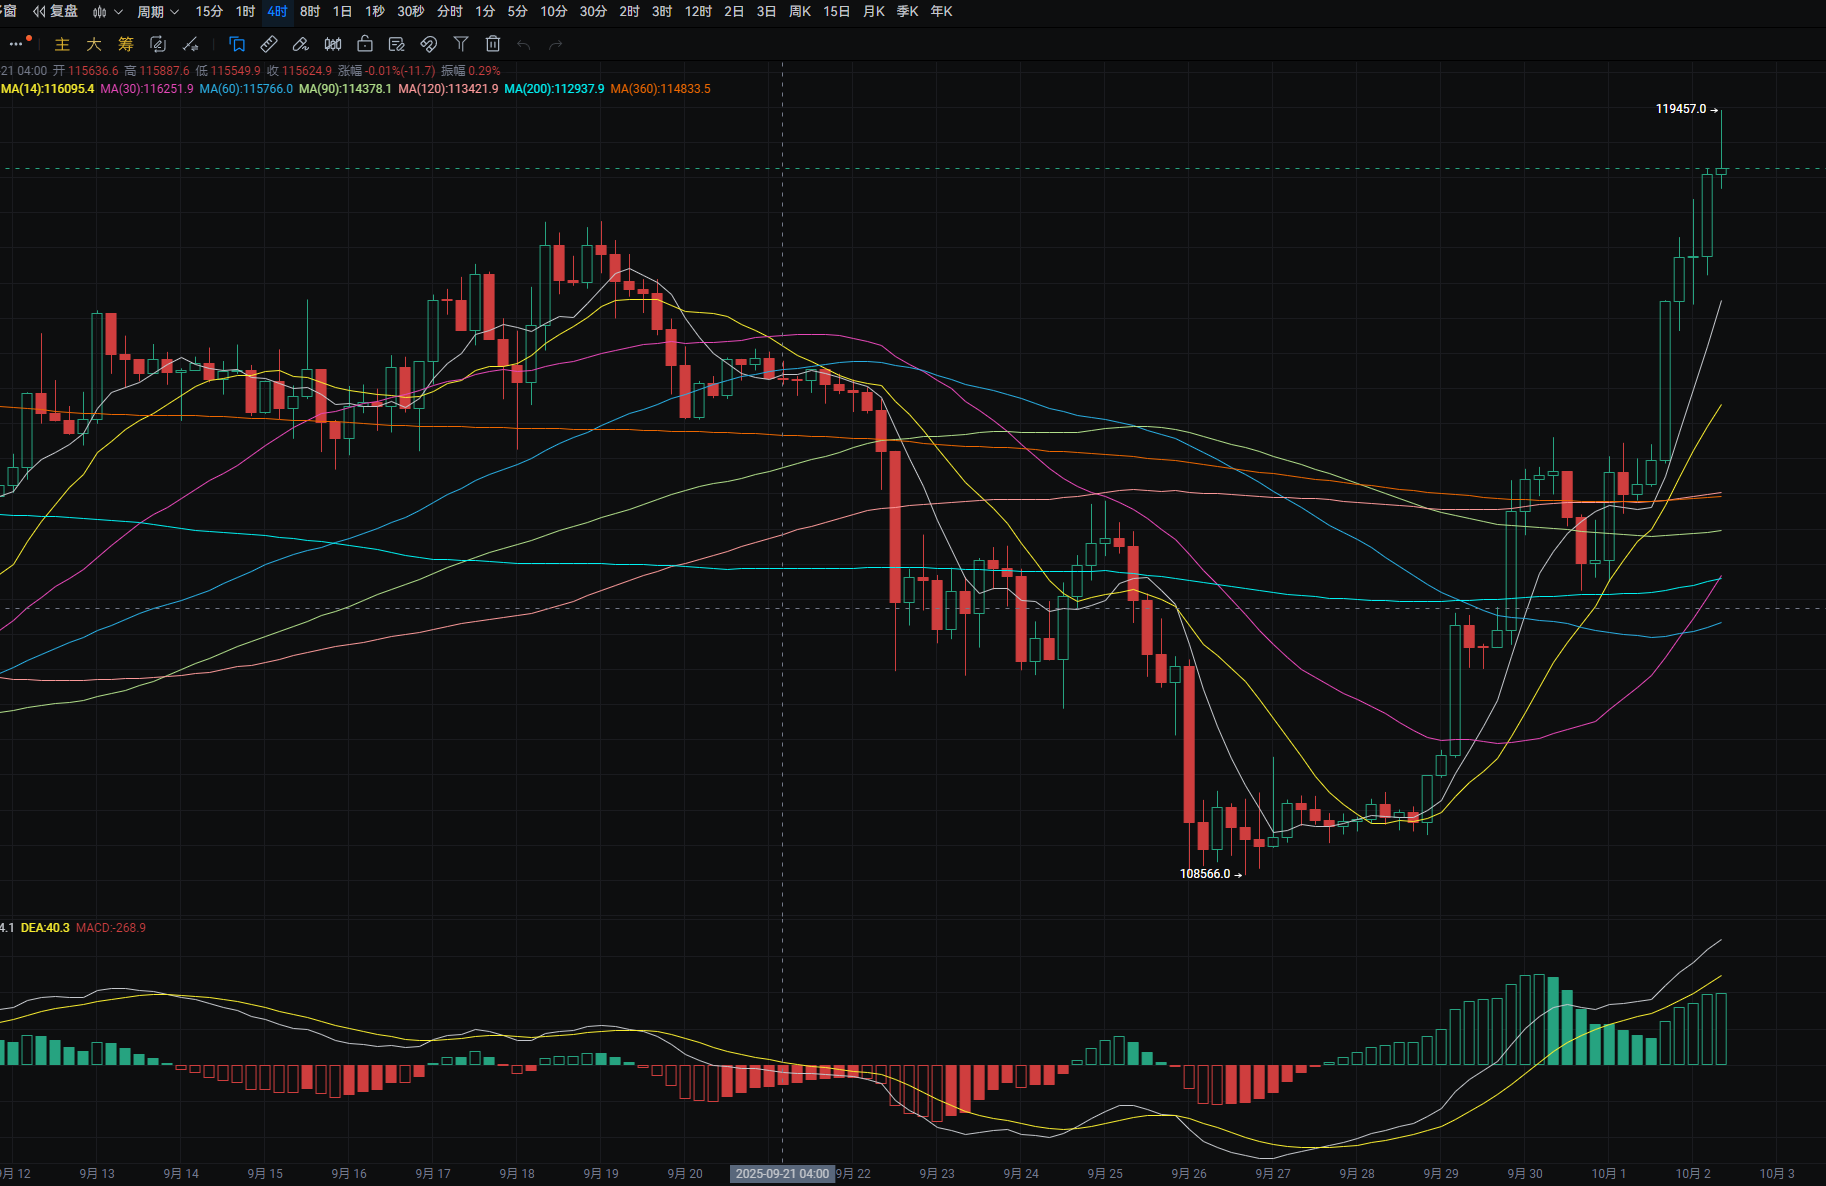
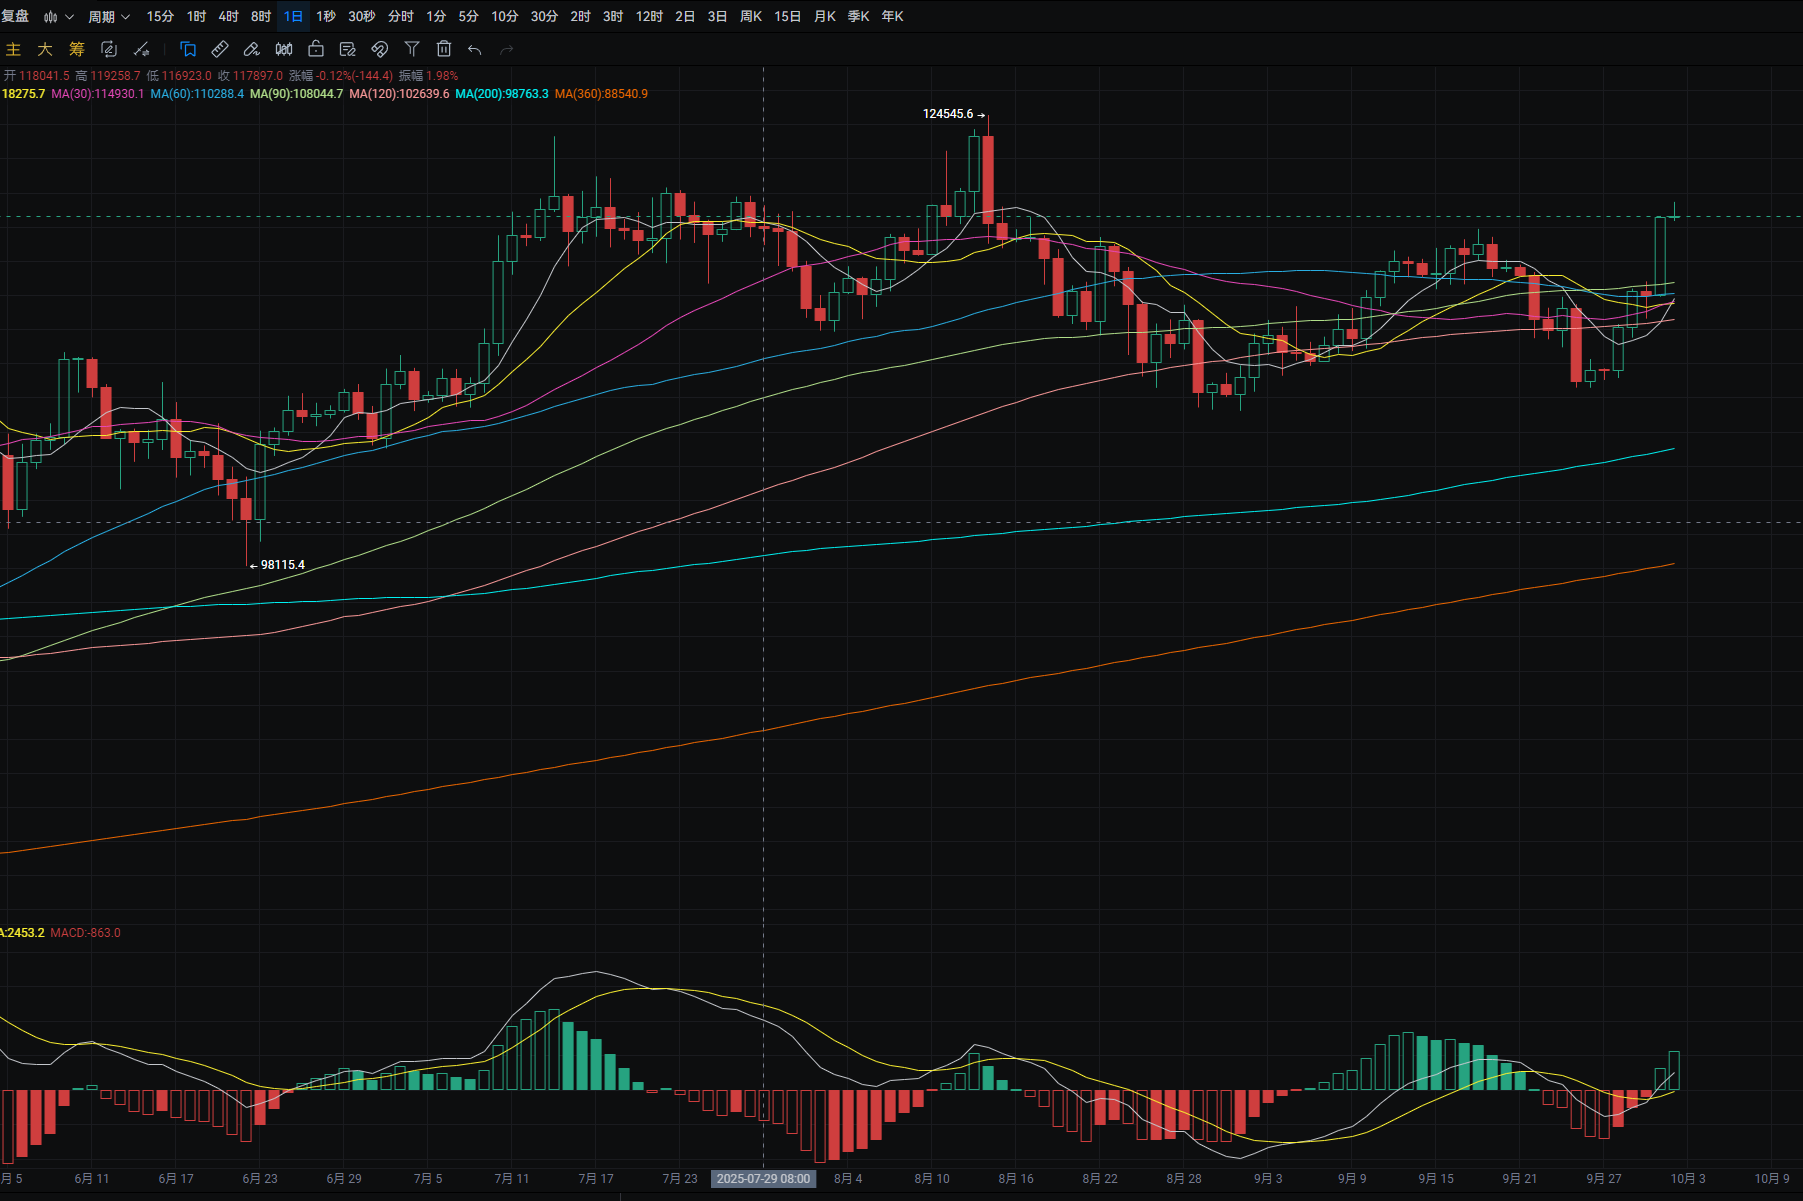
Bitcoin's daily line rose from a low of around 113,900 yesterday to a high of around 118,650, closing at around 118,550. The support level is around 117,000; if it breaks, it could drop to around MA90. A pullback can be used to buy near this level. The resistance level is around 120,000; breaking this could lead to around 121,500. MACD shows increasing bullish momentum, forming a golden cross. The four-hour support level is around 117,350; if it breaks, it could drop to around 115,850. A pullback can be used to buy near this level. The resistance level is around 119,450; breaking this could lead to around 120,950. MACD shows increasing bullish momentum.
ETH
Analysis
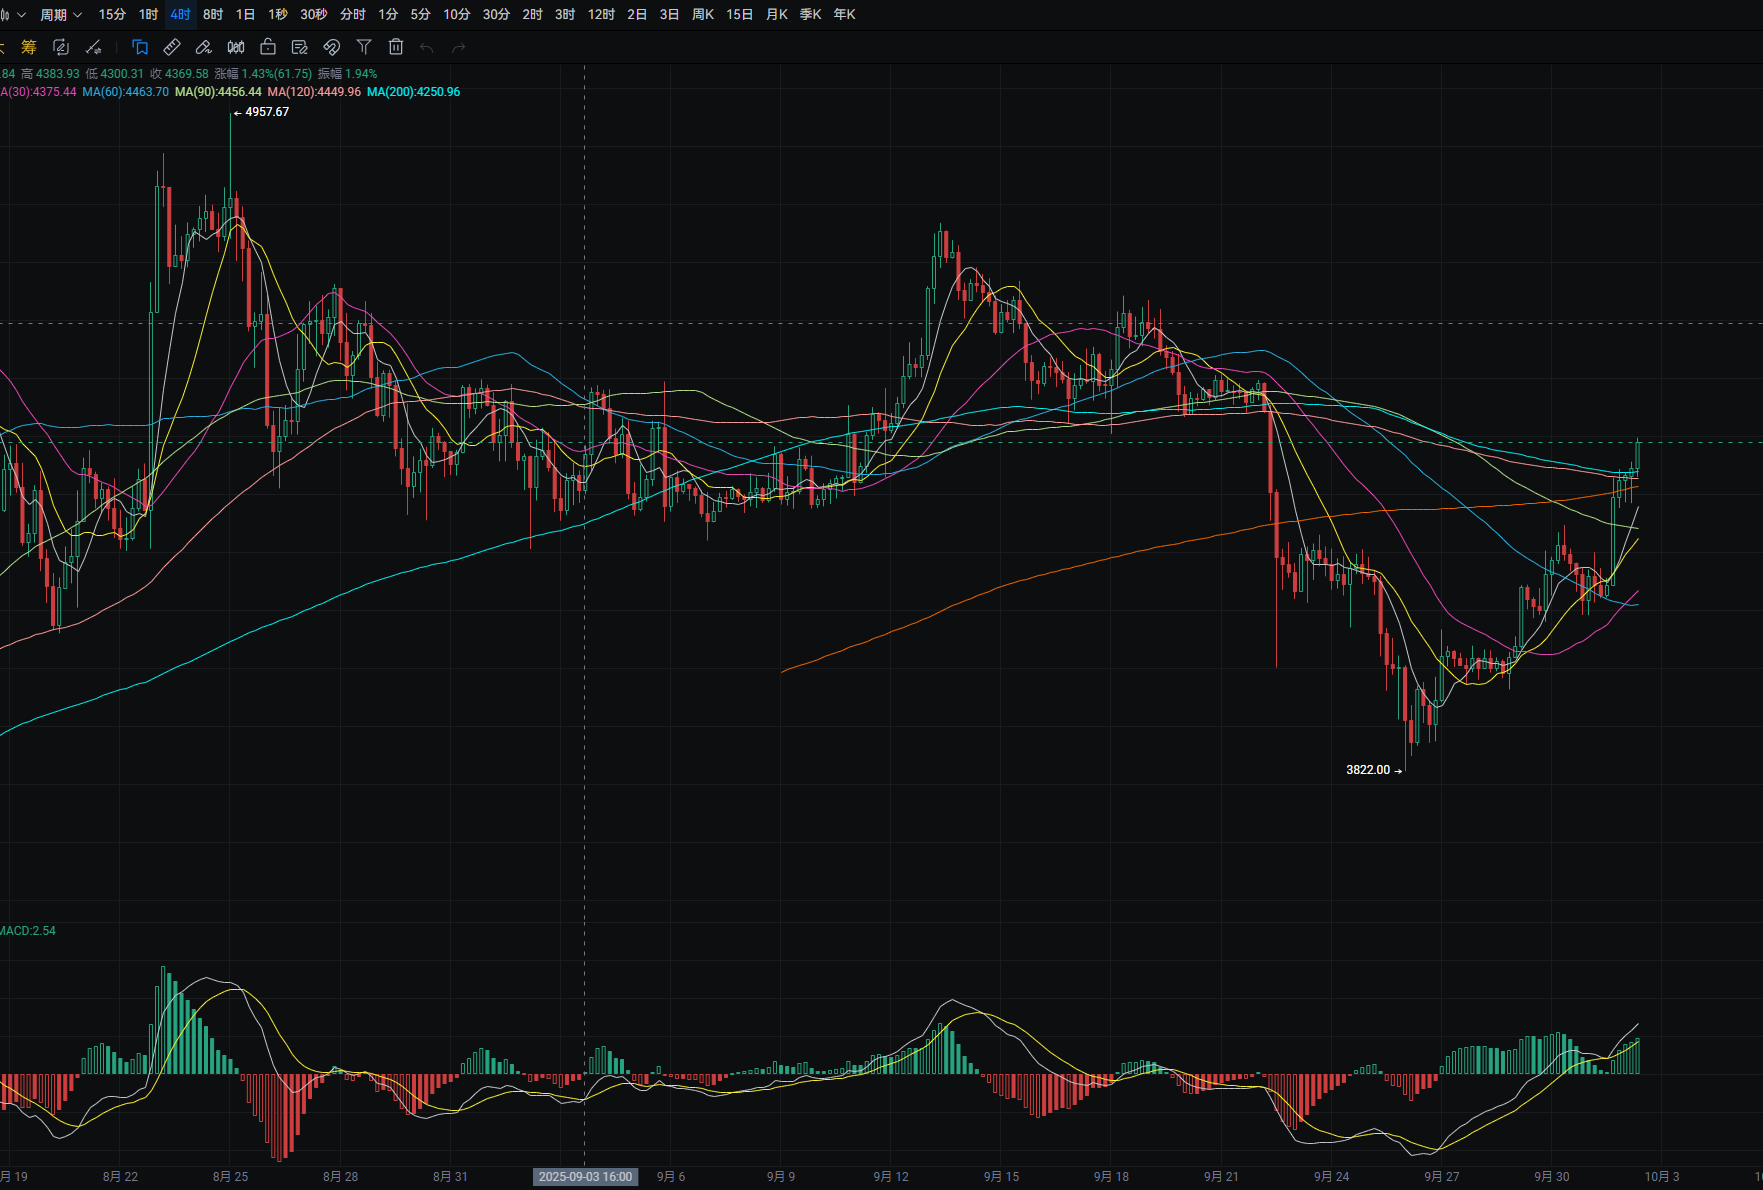
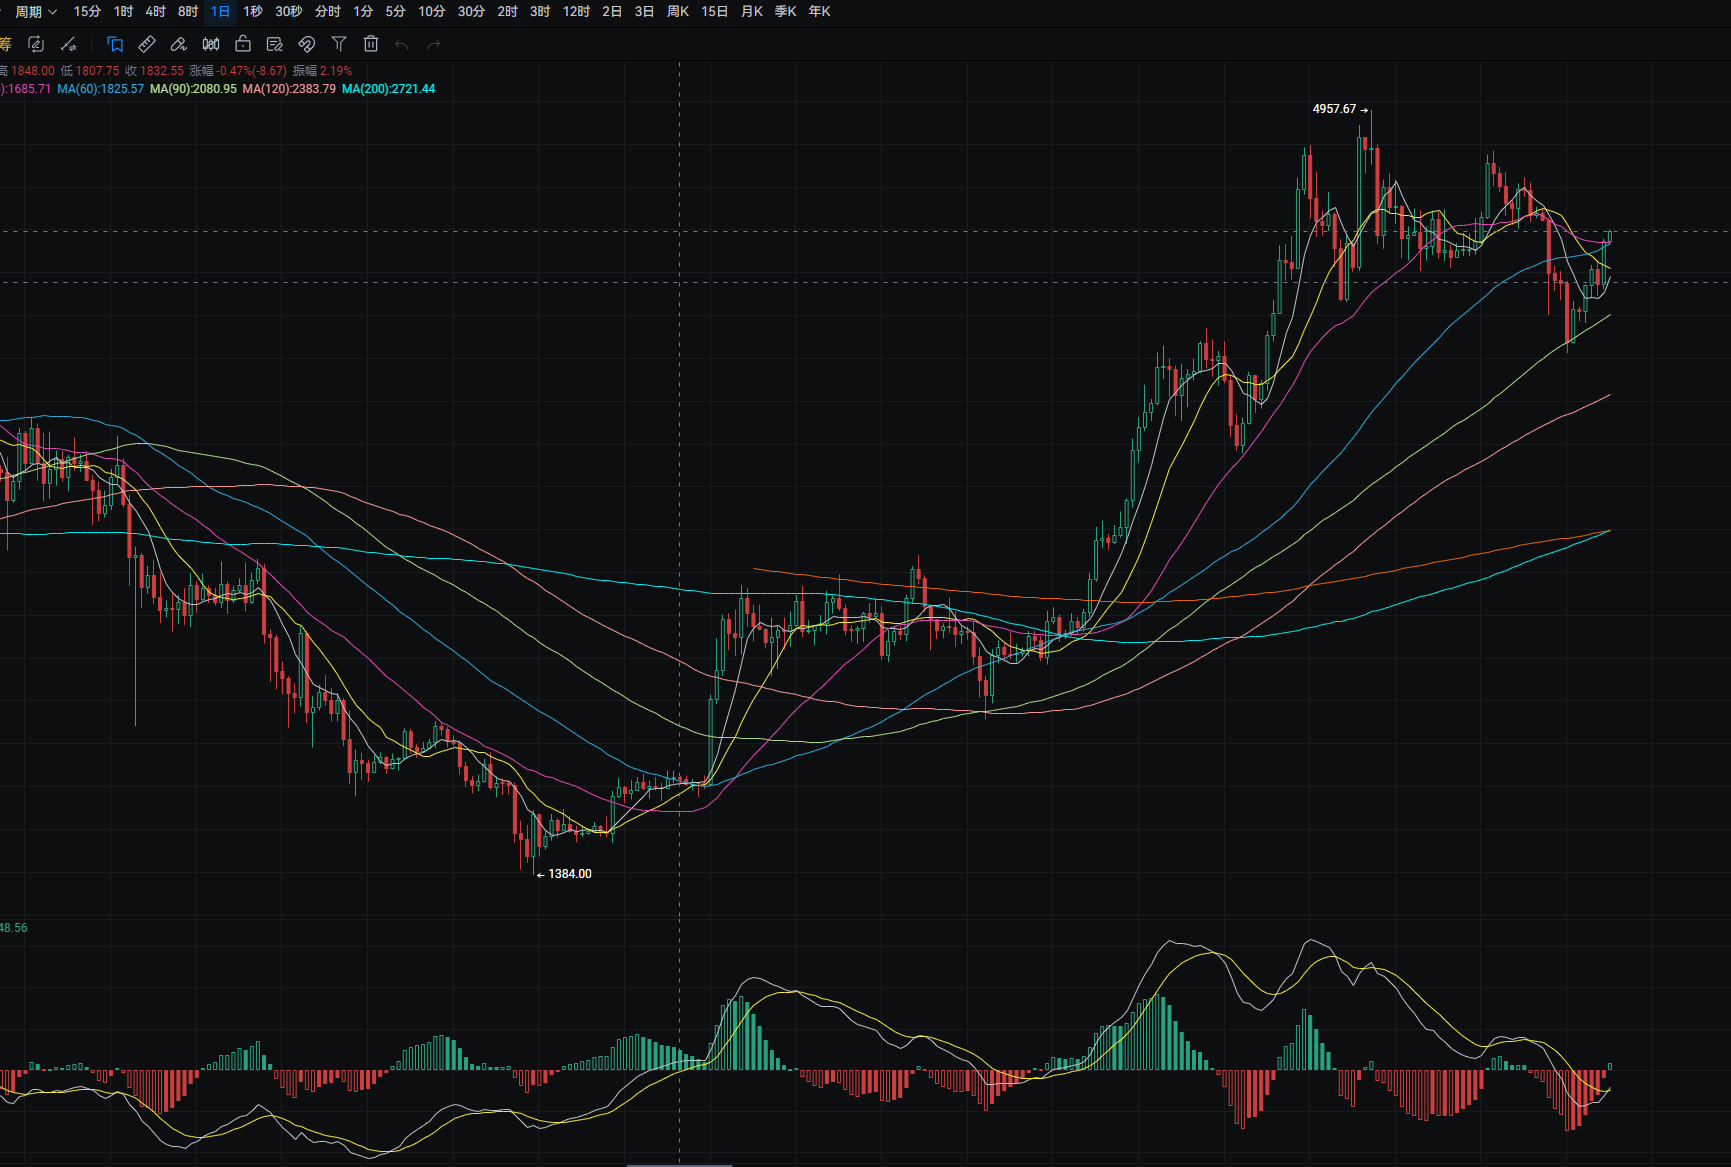
Ethereum's daily line rose from a low of around 4,120 yesterday to a high of around 4,355, closing at around 4,345. The support level is around MA14; if it breaks, it could drop to around 4,075. A pullback can be used to buy near this level. The resistance level is around 4,500; breaking this could lead to around 4,590. A rebound to this level can be used to sell short. MACD shows decreasing bullish and bearish momentum, with signs of forming a golden cross. The four-hour support level is around MA90; if it breaks, it could drop to around MA30. A pullback can be used to buy near this level. The resistance level is around 4,445; breaking this could lead to around 4,540. A rebound to this level can be used to sell short. MACD shows increasing bullish momentum.
Disclaimer: The above content is personal opinion and for reference only! It does not constitute specific operational advice and does not bear legal responsibility. Market conditions change rapidly, and the article has a certain lag; if there is anything you do not understand, feel free to consult.
免责声明:本文章仅代表作者个人观点,不代表本平台的立场和观点。本文章仅供信息分享,不构成对任何人的任何投资建议。用户与作者之间的任何争议,与本平台无关。如网页中刊载的文章或图片涉及侵权,请提供相关的权利证明和身份证明发送邮件到support@aicoin.com,本平台相关工作人员将会进行核查。


