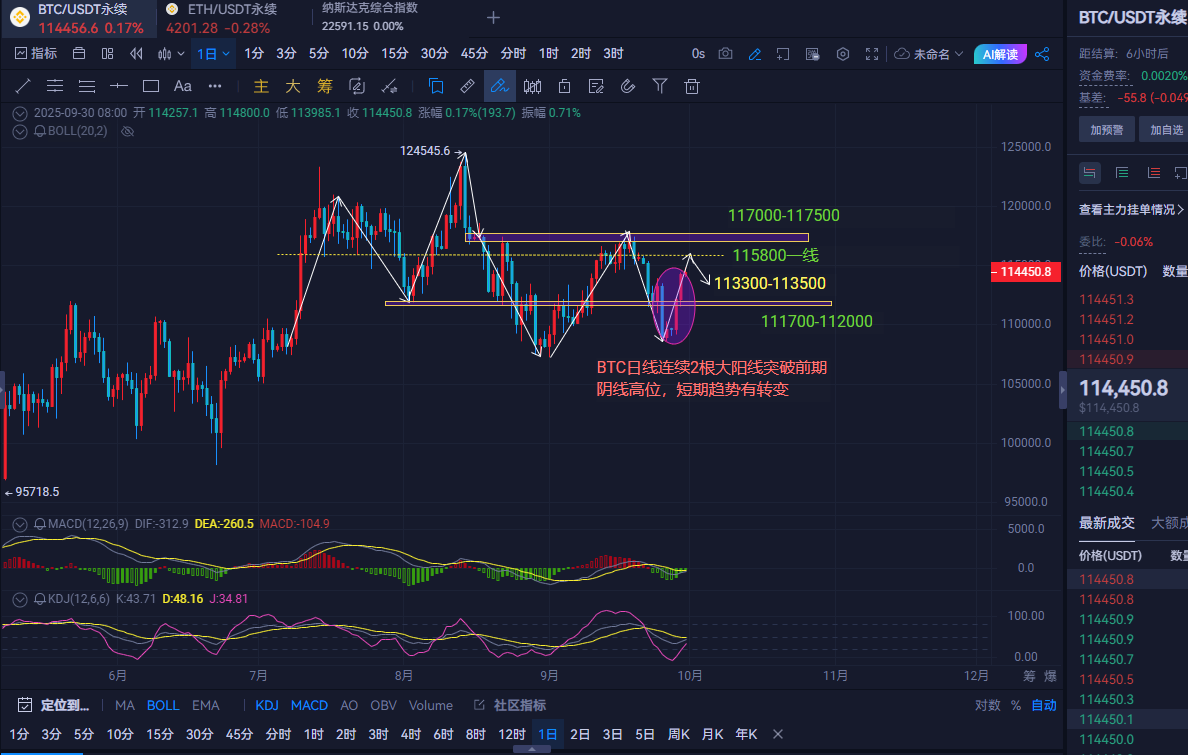
Morning Analysis: From the daily chart, Bitcoin has broken through the previous large bearish candle with three consecutive bullish candles, indicating a short-term trend change, but it is not yet complete. The daily chart has formed a W-shaped pattern, and the resistance has been tested several times around the 117000-117500 area, causing pullbacks. To change the upward trend, there is still a resistance area near 115800-116300. If it can break through today, there is hope for a breakout above 117500 this week.
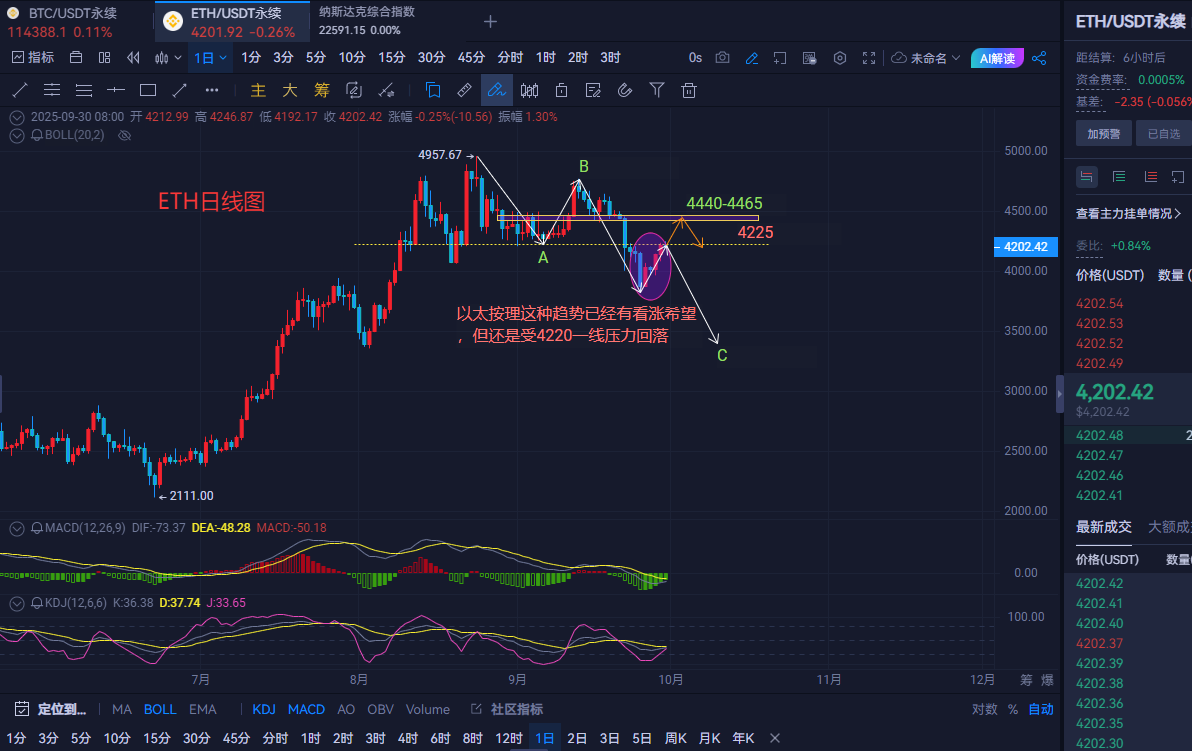
Ethereum's price experienced a sharp decline on September 25, followed by a gradual rebound in the following days, but it has not yet completely broken through the 4225 level. In the past two days, the candlesticks have shown slight pullbacks, with the closing price below the opening price, indicating strong resistance above. The technical indicators MACD currently show both DIF and DEA as negative values, and the MACD histogram continues to show green bars but is shortening, suggesting that bearish momentum is weakening and it may enter a phase of oscillation and rebound. If the daily chart can stabilize above 4225, the market may break through near the 4400 level.
Trading Suggestions: For Bitcoin, consider shorting in the 115300-115800 area, with a stop loss at 116300 and a target around 113600-113300. If it breaks down, look for levels around 112300-112800; if it does not break, consider going long.
For Ethereum, consider shorting in the 4230-4250 area, with a stop loss at 4290 and a target around 4180-4160. If it breaks down, look for levels around 4100-4120; if it does not break, consider going long.
This strategy is for reference only; please invest cautiously and secure your profits (Follow the public account: Ethereum Kai).
免责声明:本文章仅代表作者个人观点,不代表本平台的立场和观点。本文章仅供信息分享,不构成对任何人的任何投资建议。用户与作者之间的任何争议,与本平台无关。如网页中刊载的文章或图片涉及侵权,请提供相关的权利证明和身份证明发送邮件到support@aicoin.com,本平台相关工作人员将会进行核查。


