Crypto News
September 29 Hot Topics:
1. NYDIG: The mNAV metric frequently used by Bitcoin treasury companies may be misleading and inaccurate.
2. Telegram Founder: Refuses political censorship requests from French intelligence agencies.
3. "On-chain Detective" ZachXBT: Will not prioritize assistance for BSC or zkSync ecosystems for the time being.
4. Ethereum Foundation focuses on promoting the ERC-8004 "Trustless Agents" standard.
5. Falcon Finance will start the $FF token distribution on September 29.
Trading Insights
A Comprehensive Analysis of the 8 Stages of Bottom Fishing in the Crypto Market: Which Step Are We Currently In?
Core Characteristics of the 8 Stages of Bottom Fishing (in order)
First Stage: Confidence Boom Period - The atmosphere in the group is enthusiastic, everyone is full of confidence, making grand plans, and actively promoting daily, all believing they are "doing great things."
Second Stage: Confidence Weakening Period - The price enters a sideways trend, the increase stagnates, confidence in the group declines, but some still persist in promoting, not completely giving up hope.
Third Stage: Initial Bottom Fishing Period - The price starts to decline, most people see it as a "buying opportunity," and actively increase their positions.
Fourth Stage: Weak Bottom Fishing Period - The price continues to decline, previous bottom fishing funds are exhausted, people can no longer buy, discussions in the group decrease, and enthusiasm for promotion significantly cools.
Fifth Stage: Negative Outburst Period - Negative emotions spread in the group, voices of blame and insults towards the project team emerge, and dissatisfaction is concentratedly released.
Sixth Stage: Neglected Period - Almost zero discussions in the group, insults disappear—most people have cut losses and are completely indifferent to project developments.
Seventh Stage: Belief Shattered Period - The price continues to oscillate at a low level, wearing down the last remaining belief of retail investors, with some being forced to cut losses.
Eighth Stage: Recovery and Takeoff Period - The market begins to recover, the market makers test the waters (pulling up sharply) to observe retail investor reactions; after repeated testing, retail investors dare not chase the rise, and market makers initiate a real upward trend.
Key Questions: Which Stage Are We Currently In?
This needs to be assessed based on the specific cryptocurrency's price trend (whether it is in a low-level sideways trend or continuously declining), community activity (discussion volume/emotions), and retail investor behavior (whether they are still bottom fishing or have exited).
Comprehensive Judgment:If there are still insults in the community and some people are observing, it is likely in the 5th-6th stage;
If it is in a low-level sideways trend and the community is silent, it may be in the 7th stage;
If there is a test pull-up and retail investors dare not chase, it may have entered the early stage of the 8th stage.
LIFE IS LIKE
A JOURNEY ▲
Below are the actual trading signals from the Big White Community this week. Congratulations to the friends who followed along; if your trades are not going well, you can come and test the waters.
The data is real, and each trade has a screenshot from the time it was sent.
**Search for the public account: *Big White Talks About Coins*
BTC
Analysis
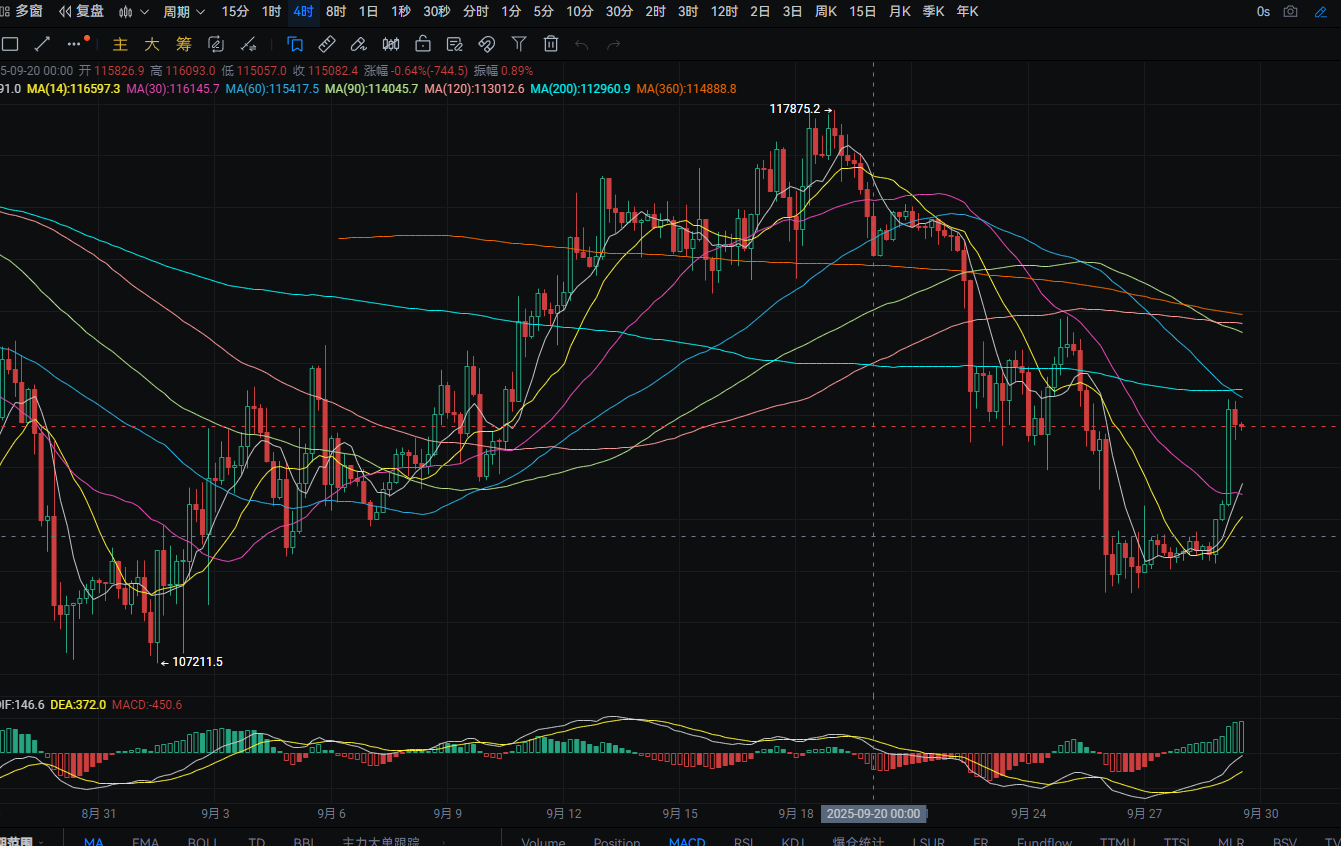
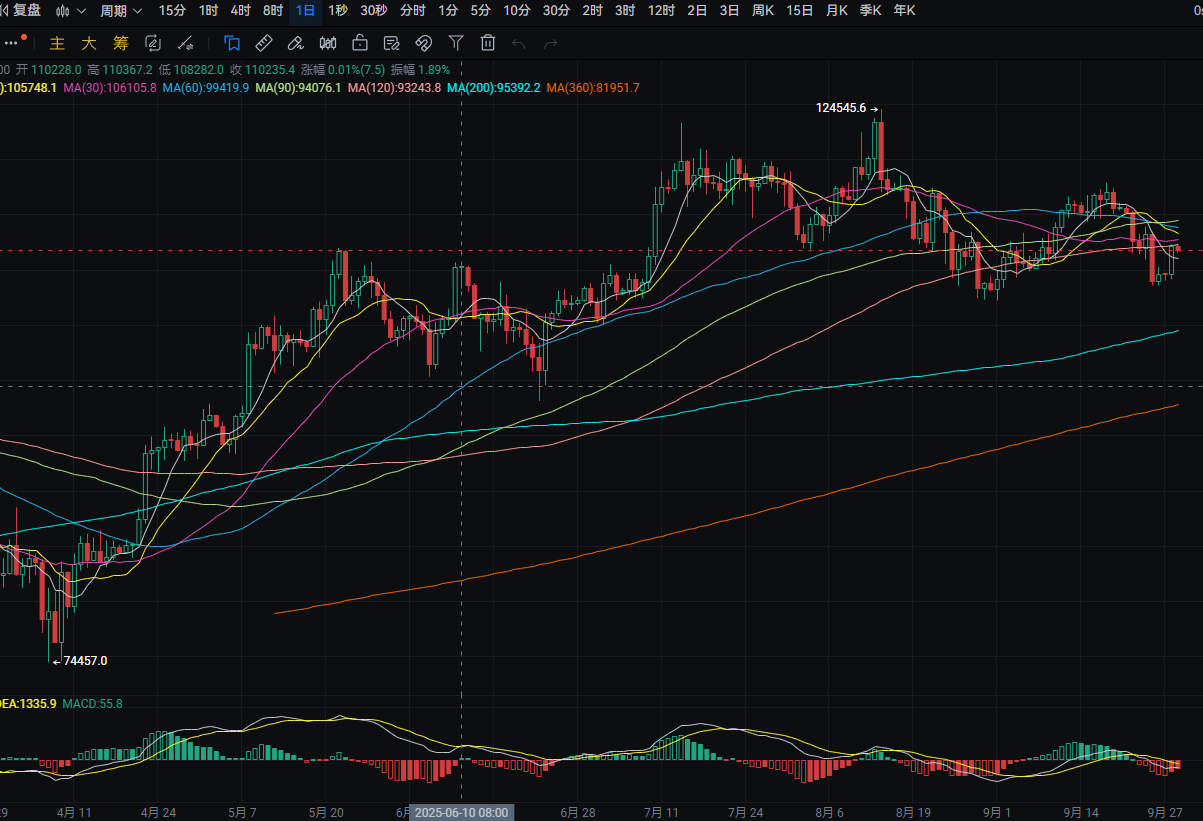
Bitcoin's daily line rose from a low of around 109,150 to a high of around 112,300 yesterday, closing around 112,100. The support level is around 110,000; if it breaks, it could drop to around 108,250. A pullback can be used to buy near this level. The resistance level is around MA14; if it breaks, it could rise to around 115,300. A rebound to this level can be used to short. MACD shows a decrease in bearish volume. The four-hour support level is around MA30; if it breaks, it could drop to around 108,950. A pullback can be used to buy near this level. The resistance level is around 113,000; if it breaks, it could rise to around MA360. A rebound to this level can be used to short. MACD shows an increase in bullish volume.
ETH
Analysis
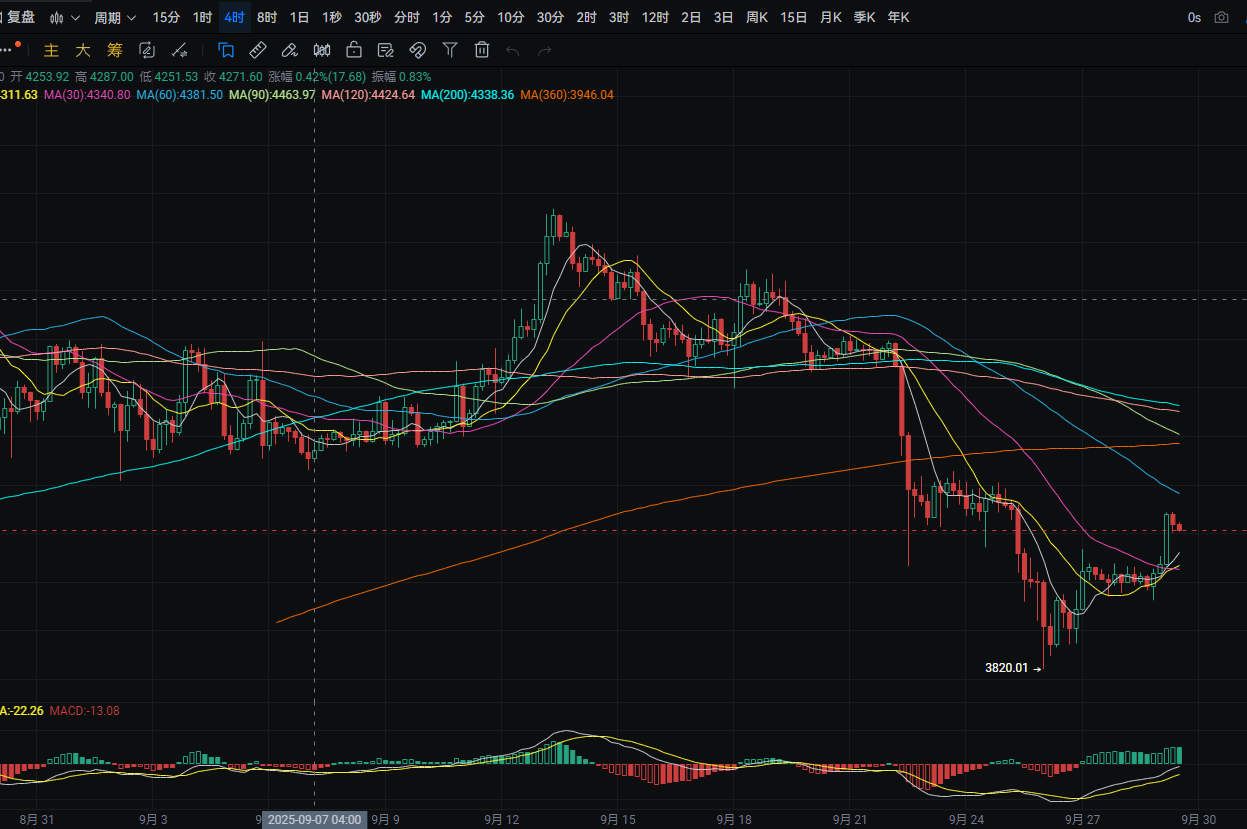
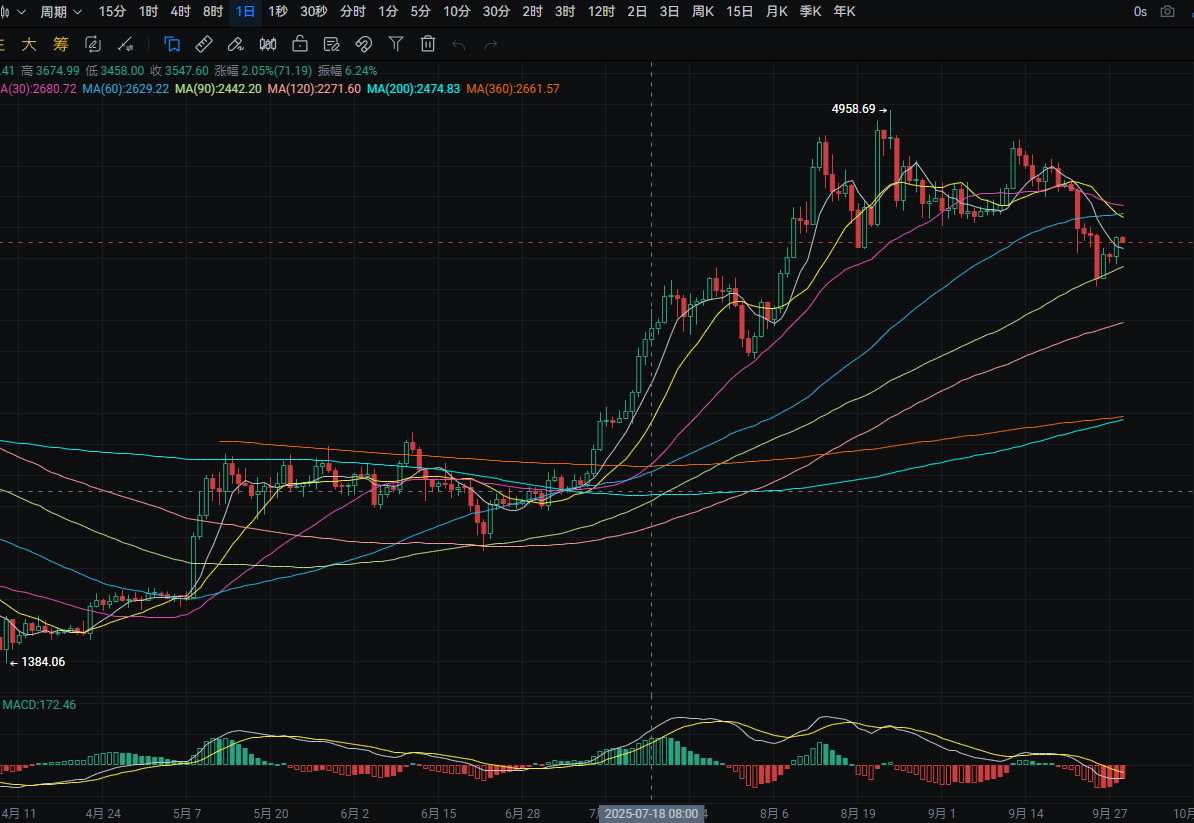
Ethereum's daily line rose from a low of around 3,965 to a high of around 4,145 yesterday, closing around 4,140. The support level is around MA90; if it breaks, it could drop to around 3,870. A pullback can be used to buy near this level. The resistance level is around MA14; if it breaks, it could rise to around 4,450. A rebound to this level can be used to short. MACD shows a decrease in bearish volume. The four-hour support level is around MA30; if it breaks, it could drop to around 3,905. A pullback can be used to buy near this level. The resistance level is around 4,200; if it breaks, it could rise to around MA90. A rebound to this level can be used to short. MACD shows an increase in bullish volume.
Disclaimer: The above content is personal opinion and for reference only! It does not constitute specific trading advice and does not bear legal responsibility. Market conditions change rapidly, and the article has a certain lag; if you have any questions, feel free to consult.
免责声明:本文章仅代表作者个人观点,不代表本平台的立场和观点。本文章仅供信息分享,不构成对任何人的任何投资建议。用户与作者之间的任何争议,与本平台无关。如网页中刊载的文章或图片涉及侵权,请提供相关的权利证明和身份证明发送邮件到support@aicoin.com,本平台相关工作人员将会进行核查。


