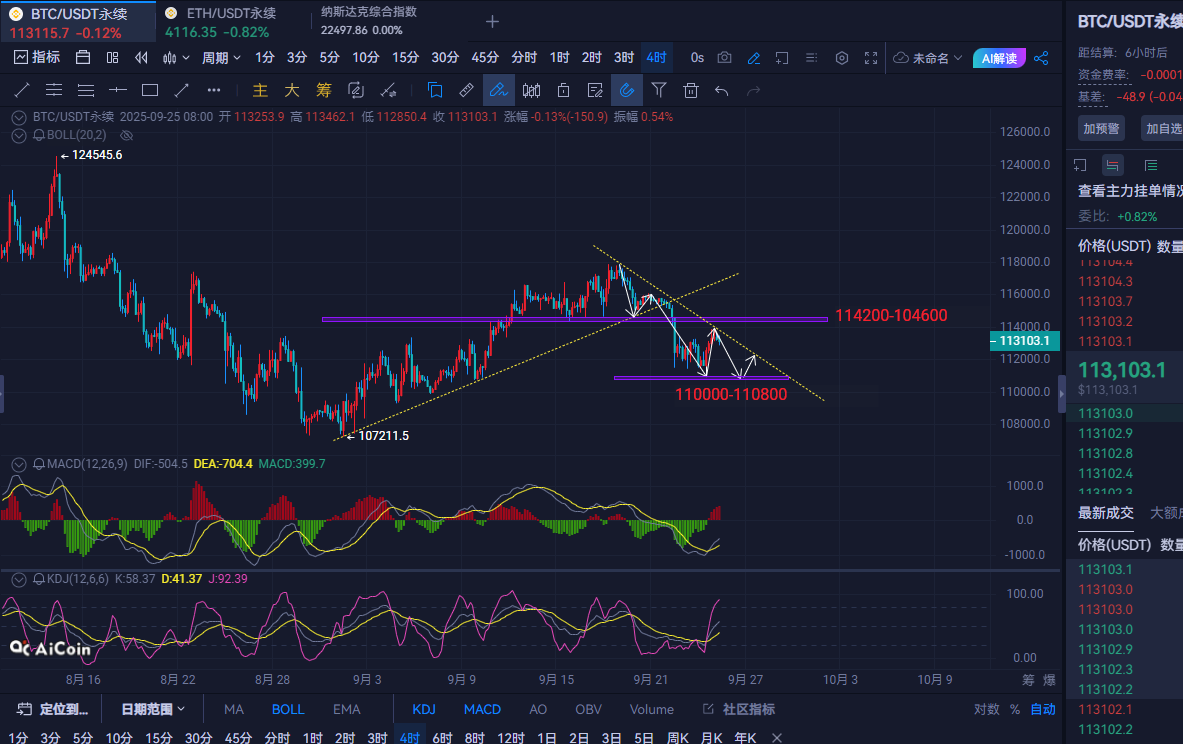
September 25 Morning Analysis: From the 4-hour chart, Bitcoin's movement yesterday indeed provided a rebound, but it did not reach the ideal position. It faced resistance in the 114200-114600 area and fell back, subsequently showing a two consecutive bearish trend close to the middle Bollinger Band. The K-line has consistently formed long upper shadows, indicating that the pressure from above still exists. Additionally, the middle Bollinger Band continues to trend downward. If it cannot break above 114600 during the day, the bears will continue to probe important support levels around 110000-108000.
The daily chart of Ethereum shows consecutive bearish candles, with the price continuously falling from around 4450 to about 4130, displaying a clear downtrend. Multiple attempts to test the resistance near 4220 have been met with rejection, indicating that this level remains strongly pressured. Previously, this level was a solid support, and moving above it later will require close attention to the breakout situation at 4220. In the 4-hour cycle, recent K-lines have frequently shown long upper shadows, indicating heavy selling pressure from above, while the lows are gradually moving down.
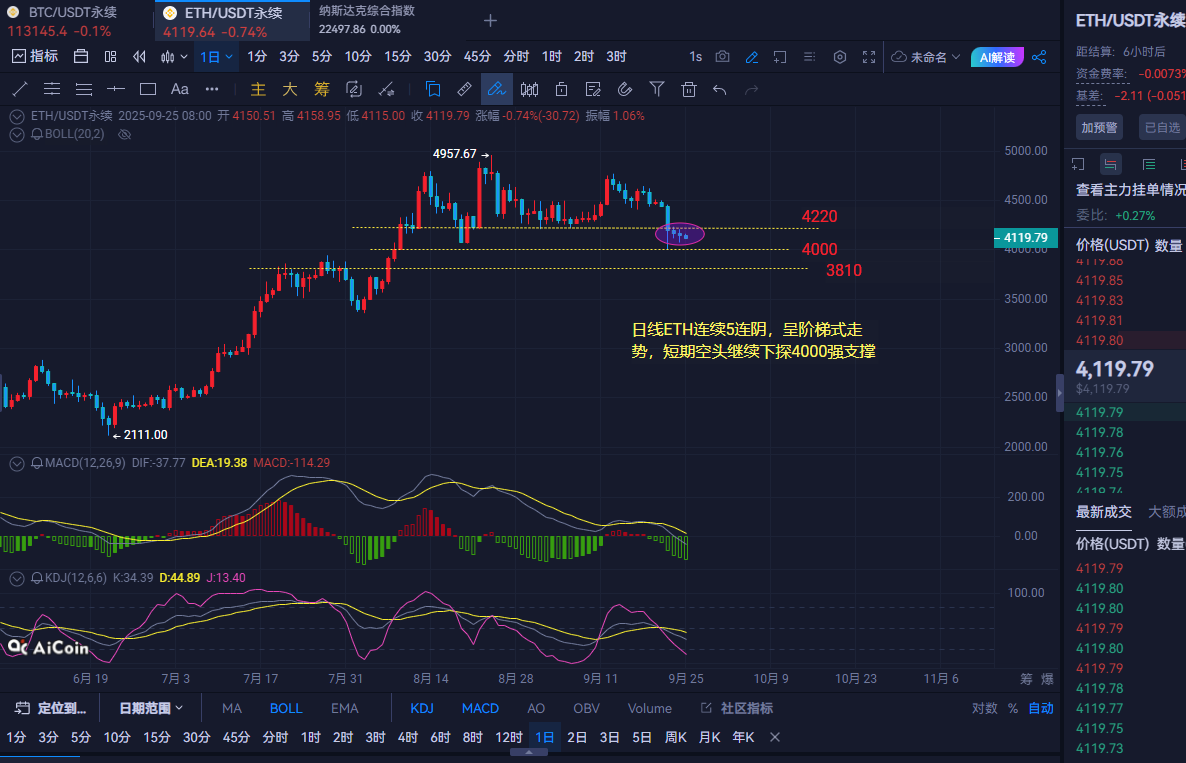
Technical Indicators MACD: Both the daily and 4-hour charts are below the zero line, with DIF and DEA operating in negative territory, indicating that bearish momentum is dominant. However, the short-term histogram is shortening, showing signs of weakening. Currently, the market is once again testing support near 4000. If it breaks down, it will continue to look downward; if it does not break, consider buying near the upper levels, and manage your profits accordingly.
The strategy is for reference only; please invest cautiously and secure your profits. (Follow Dan on WeChat: Ethereum Kai)
免责声明:本文章仅代表作者个人观点,不代表本平台的立场和观点。本文章仅供信息分享,不构成对任何人的任何投资建议。用户与作者之间的任何争议,与本平台无关。如网页中刊载的文章或图片涉及侵权,请提供相关的权利证明和身份证明发送邮件到support@aicoin.com,本平台相关工作人员将会进行核查。


