Please believe that life can suddenly get better. When we possess a bright and uplifting vitality, we will discover that in every moment of life, countless hands are lifting us up. We deserve all the wonderful things that are yet to come!!

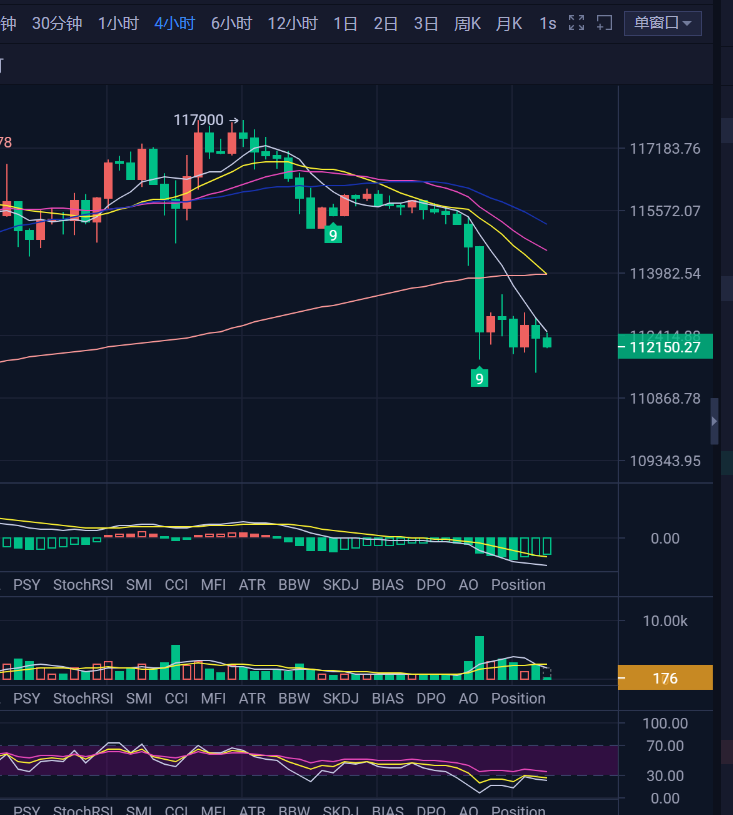
Unexpectedly, the first day of the new week saw significant market fluctuations. Yesterday, the market basically declined, dropping from around 116,000 to a low point below 112,000, with no strong rebound in sight. Based on this trend, we may need to further adjust our expectations for the market's movement. Initially, we expected the market to experience some consolidation before seeing a decline, but now that the downward momentum has begun to appear, it may lead to a more premature bearish sentiment. In terms of operations, the bottom-fishing for a short-term rebound we hoped to see yesterday did not materialize, resulting in our long positions being stopped out. Encountering a direct downward market has unfortunately turned our long positions into fuel for the bears. For now, let's see how the subsequent market develops.
Today, we will first observe the distribution of liquidity. Yesterday's drop cleared out the short-term bullish liquidity that had accumulated below. From the current distribution, it is quite evident that there is significantly more bearish liquidity above, while new liquidity has not yet re-accumulated below in the short term. During the market's decline, the short-term high-leverage bearish liquidity has now reached around 114,000, primarily from newly emerging short positions, while new bullish liquidity has temporarily started to appear around 110,500. If the market continues to dip today, this level is likely to be the primary target. In terms of spot premium, it was another day of declining premium rates, but it still remains within a positive rate, indicating that the market's panic selling sentiment is not very strong yet, likely because it hasn't broken through the psychological expectation level.
On the technical front, a large bearish candlestick has appeared on the daily chart, currently retracing to the MA120 daily support level. The continuous appearance of bearish candlesticks makes the bearish sentiment more pronounced. The moving average MA7 has officially entered a death cross today, and what we see on the daily cycle is essentially a bearish trend. In terms of technical indicators, the MACD has begun to transition from a bullish cycle to a bearish cycle, which may indicate that the strength of this bearish cycle could be significant. Currently, on the daily level, there is some support around 108,000. If a lower low appears during the daily cycle's retracement compared to the previous retracement cycle, then the larger-scale daily retracement cycle will need to be confirmed, making it difficult to predict subsequent low points.
On the four-hour level, according to our expectations from yesterday, the market has been in a bearish cycle for quite some time, and there may be a need for a market indicator to recover. Therefore, we planned to take a long position yesterday, but so far, the four-hour chart did not perform as hoped for a recovery, instead continuing to decline in the bearish cycle and refreshing the low points. Currently, although there is some rebound in the market, looking at the closing of the previous few cycles, the earlier rebound had a bearish doji close, and the last cycle closed down as a bearish candlestick, indicating that the strength of this rebound is likely to be limited in the short term, with a greater possibility of further dips. In terms of technical indicators, the MACD is currently rebounding in the bearish cycle. If the subsequent rebound can complete the recovery of the indicators, then it would be most appropriate to plan for a short position.
In terms of operations for today, if the market dips again, a short-term long position can be taken around 110,500. If it rebounds first, then a short position can be planned above 114,000, and we will not take long positions at 110,500 again.
Ethereum's recent performance has also been quite interesting. From the larger trend perspective, after breaking the previous high of the upward cycle, it started to oscillate and retrace without moving much further. As of today, it has tested the 4060 price level twice. Therefore, it can be confirmed that the key price level in the weekly trend structure is here. Above this level, one can continue to hold spot positions while waiting for a new trend to emerge. However, if the weekly chart breaks below this level, the previous breakout will be considered a false breakout, potentially leading to the end of the trend.
【The above analysis and strategies are for reference only. Please bear the risks yourself. The article is subject to review and publication, and market conditions change in real-time. The information may be outdated, and specific operations should be based on real-time strategies. Feel free to contact us for discussions on market conditions.】
免责声明:本文章仅代表作者个人观点,不代表本平台的立场和观点。本文章仅供信息分享,不构成对任何人的任何投资建议。用户与作者之间的任何争议,与本平台无关。如网页中刊载的文章或图片涉及侵权,请提供相关的权利证明和身份证明发送邮件到support@aicoin.com,本平台相关工作人员将会进行核查。


