Yesterday we mentioned that the market has reached a turning point again, and this week the market makers will judge the bulls or bears. Unexpectedly, the market makers took action on Monday. This at least indicates that our analysis of the market through technical indicators is still valid, so we will continue to analyze the market using indicators.
Weekly Level
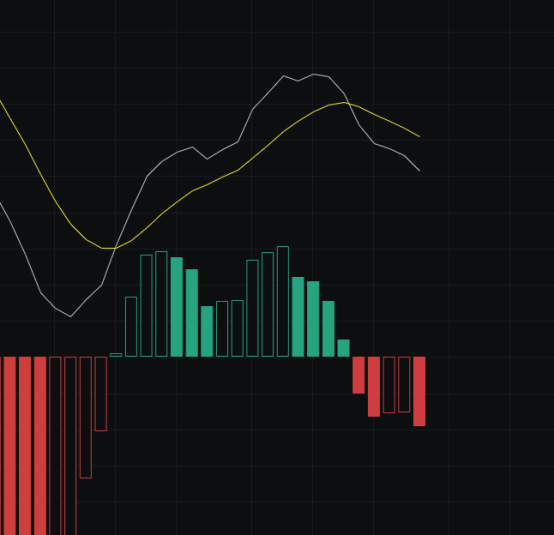
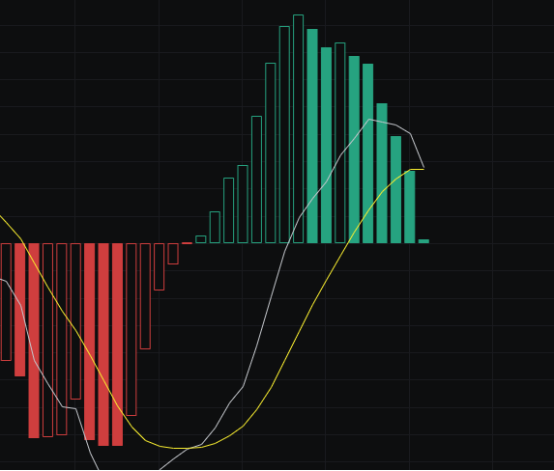
From the MACD perspective, there is a death cross ahead on the weekly chart, the fast line continues to move downward, and the energy bars are also below the zero axis, indicating a bearish trend.
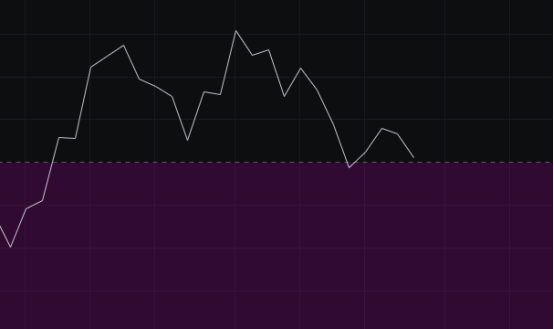
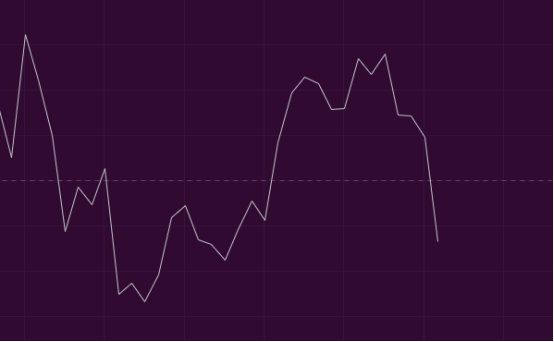
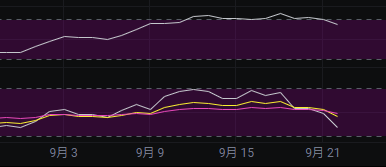
From the CCI perspective, it is about to touch 100 again. The first touch resulted in a rebound, and the second touch may really lead to a decline, so the market may drop in the future.
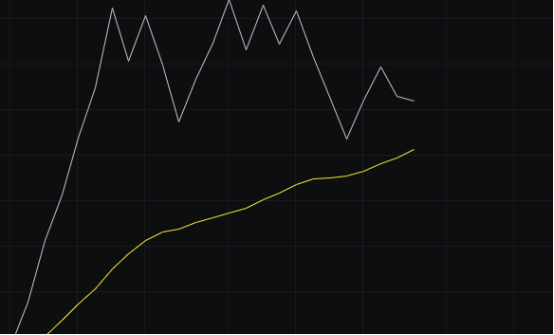
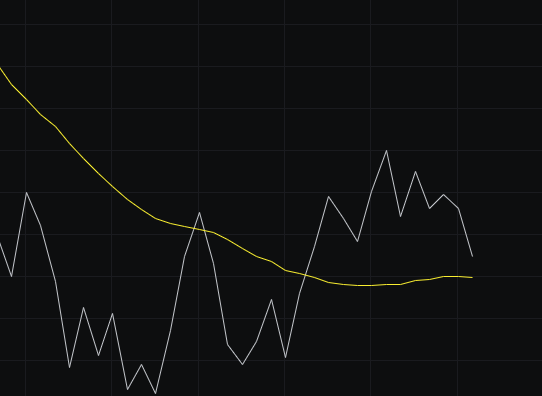
From the OBV perspective, with last week's bearish close, the OBV has retraced but is still above the slow line. We will observe whether the fast line will move downward and cross the slow line.
From the KDJ perspective, it has currently dropped from above to below 50 and shows no signs of slowing down, so the KDJ is also bearish.
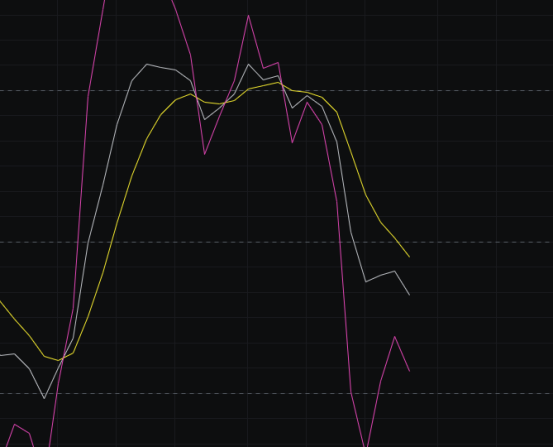
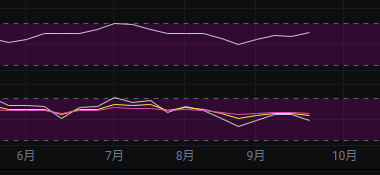
From the MFI and RSI perspectives, the MFI is moving upward while the RSI is moving downward, indicating a lack of consensus between bulls and bears, suggesting that the market may experience fluctuations.
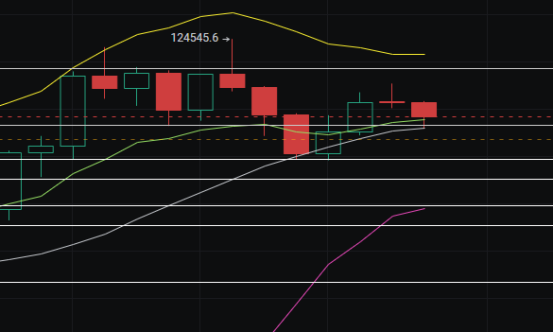
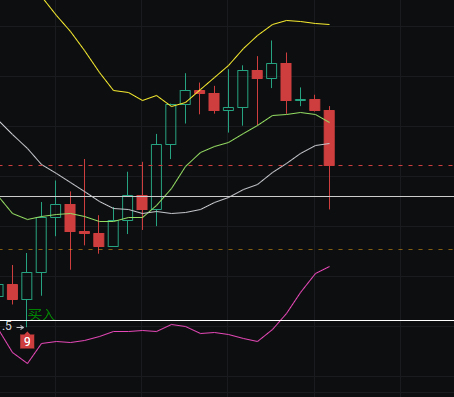
From the moving average perspective, the price has currently fallen below the BBI, and we will see if the BBI can provide support.

From the Bollinger Bands perspective, the upper and lower bands continue to converge. Currently, it is still in a wide fluctuation, but the distance between the upper and lower bands is the narrowest in history for this asset. A trend is definitely coming, but whether it will be upward or downward needs further observation. Currently, last week closed with a bearish candlestick cross, indicating a bearish outlook.
Daily Level
From the MACD perspective, the fast line is turning downward and is about to intersect with the slow line. We will see if there can be a rebound here; if there is, the bulls may have a chance to push upward; if not, it will continue to decline.
From the CCI perspective, it has currently fallen below the zero axis. We have been warning the bulls to pay attention to risks in the past few days, and today the risk has materialized.
From the OBV perspective, the fast line continues to press down, and the slow line has also flattened. We will see if the fast line continues to press down and intersects with the slow line, and then observe the movement of the fast line.
From the KDJ perspective, the KDJ continues to decline, similar to the weekly chart, with no signs of turning around, so it may continue to decline or move sideways.
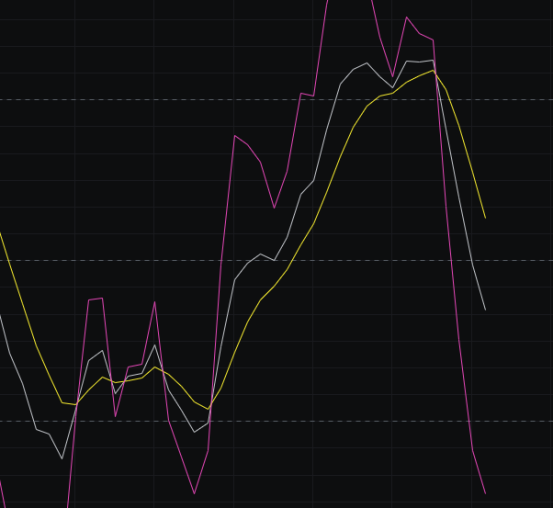
From the MFI and RSI perspectives, both indicators are moving downward together, indicating that the bulls have no action in the short term.
From the moving average perspective, today’s decline has broken below the 120 line, but it has now regained the 30 line. We will see if the 30 line can provide support.
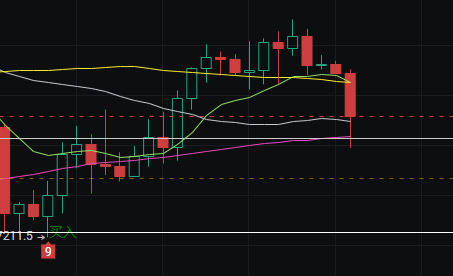
From the Bollinger Bands perspective, it is still in a wide fluctuation. If tomorrow also closes bearish, the market will accelerate its wide fluctuation trend, and it will continue to test downward, with the 120 line not necessarily holding.
In summary: Last week we mentioned that the market makers would initiate a judgment this week, and unexpectedly it started on Monday. We believe that the decline at this position will not lead to an immediate rebound; if the market performs well, it will move sideways; if not, it will continue to decline. Today's support is seen at 112000-110000, and resistance is at 114500-115500.
免责声明:本文章仅代表作者个人观点,不代表本平台的立场和观点。本文章仅供信息分享,不构成对任何人的任何投资建议。用户与作者之间的任何争议,与本平台无关。如网页中刊载的文章或图片涉及侵权,请提供相关的权利证明和身份证明发送邮件到support@aicoin.com,本平台相关工作人员将会进行核查。


