Master Discusses Hot Topics:
Why do I feel like this market is hopeless every Monday throughout September? Let's talk about the macro situation first. Over in the U.S., aside from H-1B, there’s nothing new; the press conference just touched on some goose-related matters, which isn’t enough to change the narrative of the U.S. stock market.
He hasn’t even criticized the Federal Reserve and Powell yet, and the market has completely lost its rhythm. With no significant data in the short term, the trend is just following the U.S. stock market in a mixed fluctuation. Liquidity is getting worse, turnover continues to shrink; although it’s not as bad as last week, it still shows that everyone is completely uninterested in this lousy price.
The interest rate game has long been over, and the short-term funds' sentiment has been exhausted; now we are in a vacuum period. To put it bluntly, investors are all confused, not knowing which way to go.
Stop bringing up those two rate cuts; everything that needed to be expressed was already expressed in the September meeting. Now we are just waiting for data, which is of no use in the short term.
Back to the market, this morning’s accelerated drop directly hit the 4-hour EMA200, and the support line at 114K is about to be crushed. The previous price channel has already been broken, and the lower Bollinger Band has been torn open; the next stop is the 0.618 level in the 124K to 107K range.
Both the daily and weekly charts are filled with bearish sentiment, and today’s move is a confirmation signal. The pullback and downward mode is fully opened, and before mid-October, the main theme will be bearish. Last week, the weekly chart closed with a long upper shadow doji, which has already dealt a blow to the bulls.
The key resistance level is 117K; if it doesn’t reclaim that level, it will continue to drop. The pullback target is directly looking at 105K to 93.8K. There’s no good news about rate cuts anymore; rate cuts depend on the environment, they are not a cure-all. If the economy is going to recession, rate cuts are just stepping on the gas downhill.
This wave of decline is due to the exhaustion of good news and insufficient liquidity, and the result is bound to be downward. Next, we’ll see if the bearish momentum can spread from the 4-hour to the daily chart; once it spreads, the daily trend will also collapse.
Before the rate cut on October 30, the market might give you a breather, but don’t expect a major reversal. Those looking to catch the bottom are just retail investors; if it really drops for two weeks, it’s hard to say if your account can hold up.
Ethereum is even worse; Monday’s crash has become a regular feature. The 4-hour support has been broken, and the next step is to look for a rebound around 4229. The key support below is at 4200, with the daily lower band at 4187, and if it gets worse, it could go to 4158.
But don’t be fooled by these numbers; Ethereum is essentially dying along with Bitcoin. The so-called risk release sounds nice, but in essence, it’s the market stabbing you with a knife.
Is it okay if the daily doesn’t break and you think the big direction is fine? Nonsense, the overall environment is filled with bearish sentiment; any rebound is just distribution, and it’s impossible to go bullish. Any short-term bounce is just the main force unloading their positions; if you believe in it, you’re just delivering packages for others.
Master Looks at Trends:
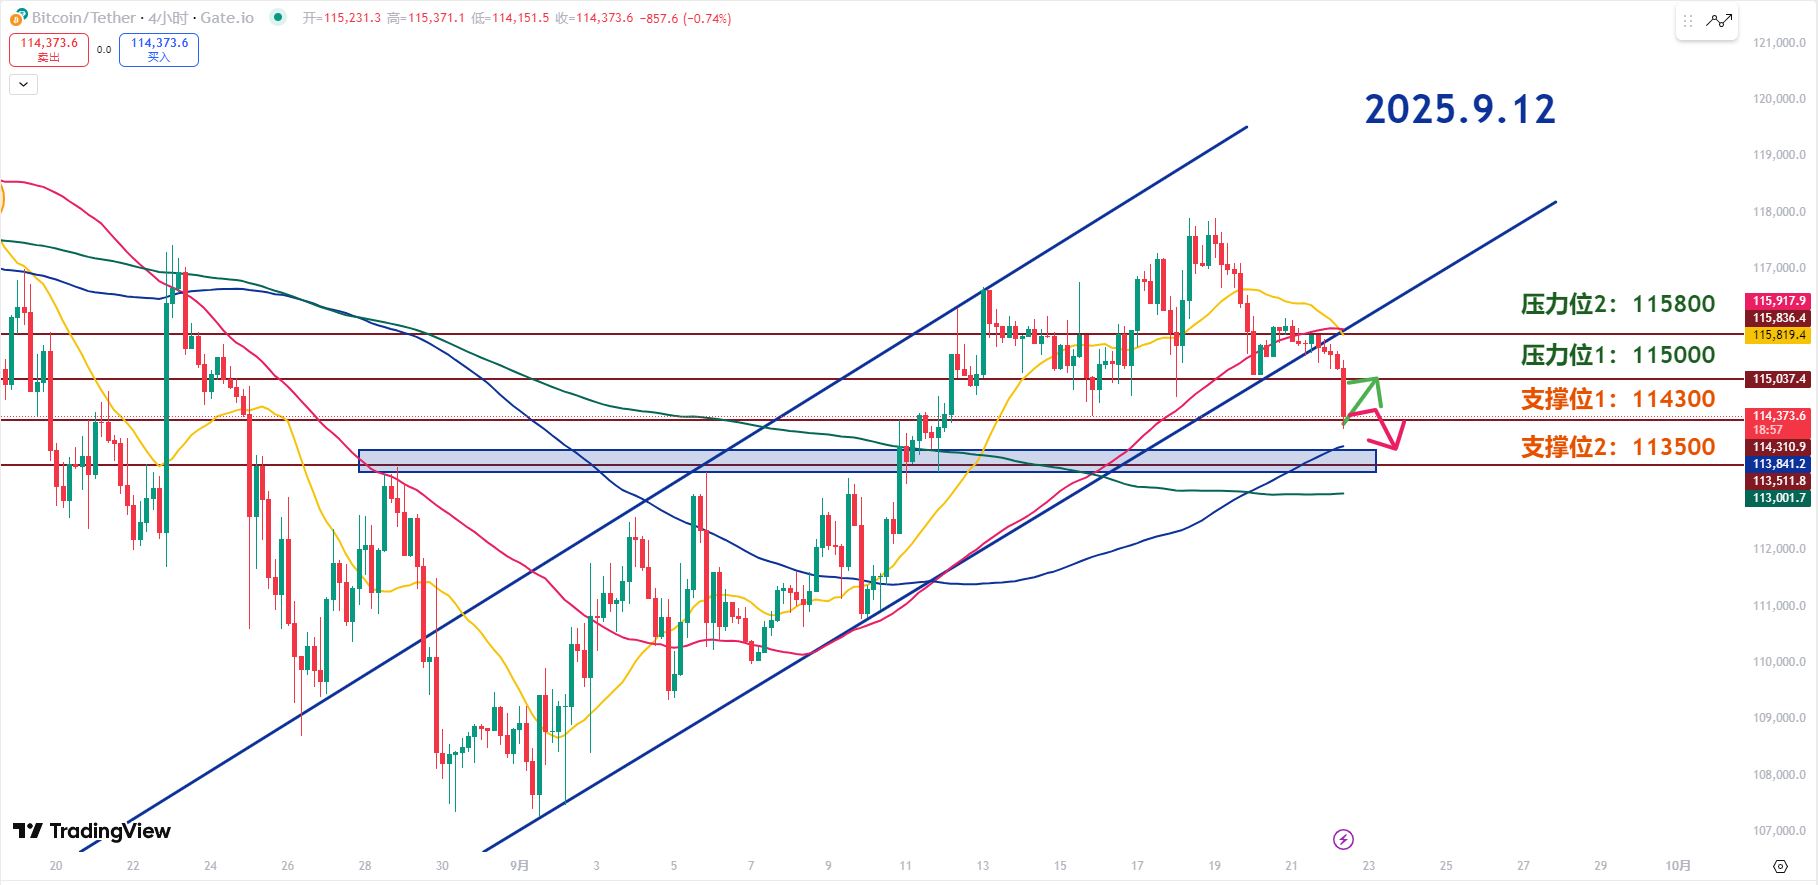
Resistance Level Reference:
Second Resistance Level: 115800
First Resistance Level: 115000
Support Level Reference:
First Support Level: 114300
Second Support Level: 113500
In the short term, Bitcoin failed to return to the upward channel yesterday, and the trend has completely turned bearish. Now it’s a critical moment to confirm whether the rebound strength will continue to drop. It’s either a forced V-shaped rebound or a direct N-shaped decline. If the rebound is weak, then it will continue to fall.
Yesterday’s 114.3K short-term support has now become the key support; if it can’t hold, it will continue to drop. More crucial below is 113.5K, which is today’s lifeline. If it can’t hold, the short-term downward space will be fully opened.
On the daily level, it’s currently barely holding on the 20-day moving average, which can allow for a technical rebound, but don’t be overly optimistic. All the pressure zones above are filled with trapped positions; any rebound will just lead to selling pressure.
The first pressure level of 115K was still considered support yesterday, but now it has turned into a hard ceiling. If the rebound lacks volume, this is the point to sell. The second pressure level is 115.8K, but first, we need to reclaim 115K. However, based on the current rebound momentum, it will take time to stabilize at 115K.
The first support level of 114.3K is currently just barely holding on; if it drops, we’ll directly look at 114K, with hardly any buffer space. The second support level of 113.5K is considered the last chance for a rebound; if it can’t hold, the short-term decline will accelerate directly.
Yesterday, after breaking the ascending channel I previously mentioned, it plunged directly; this wave of bearish signals has already hit us in the face. Don’t easily fantasize about a bullish rise today; going long can only be a super short-term gamble, and you should run at the right moment. If the rebound reaches the pressure zone without volume, it’s time to go short, following the trend.
9.22 Master’s Wave Strategy:
Long Entry Reference: Not Applicable
Short Entry Reference: Short in the 115000-115800 range in batches; Target: 114300-113500
If you truly want to learn something from a blogger, you need to keep following them, rather than making hasty conclusions after just a few market observations. This market is filled with performers; today they screenshot long positions, and tomorrow they summarize short positions, making it seem like they "catch every top and bottom," but in reality, it’s all hindsight. A truly worthy blogger will have a trading logic that is consistent, coherent, and withstands scrutiny, rather than jumping in only when the market moves. Don’t be blinded by flashy data and out-of-context screenshots; long-term observation and deep understanding are necessary to discern who is a thinker and who is a dreamer!
This article is exclusively planned and published by Master Chen (WeChat public account: Coin God Master Chen). If you want to learn more about real-time investment strategies, liquidation, spot trading, short, medium, and long-term contract trading techniques, operational skills, and knowledge about candlesticks, you can join Master Chen for learning and communication. A free experience group for fans has been opened, along with community live broadcasts and other quality experience projects!

Warm reminder: This article is only written by Master Chen on the official account (as shown above); other advertisements at the end of the article and in the comments are unrelated to the author!! Please be cautious in distinguishing between true and false, thank you for reading.
免责声明:本文章仅代表作者个人观点,不代表本平台的立场和观点。本文章仅供信息分享,不构成对任何人的任何投资建议。用户与作者之间的任何争议,与本平台无关。如网页中刊载的文章或图片涉及侵权,请提供相关的权利证明和身份证明发送邮件到support@aicoin.com,本平台相关工作人员将会进行核查。


