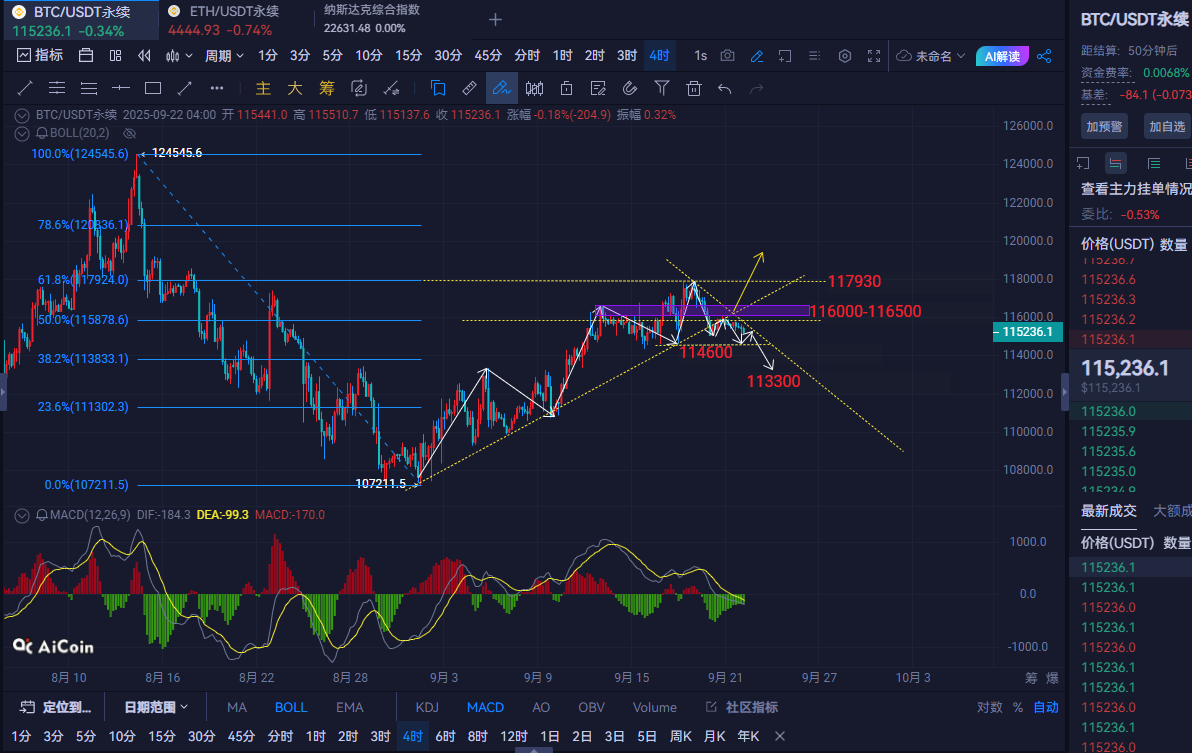
Morning Analysis: From the 4-hour chart, after the previous historical high, the Bitcoin price has been in a rebound phase since it hit a low of around 107200. There was hope to rise above 120000 again, but this time the interest rate cut was ineffective, and it was blocked at the 61.8 position of 117924 before falling below the key 50.0 position of 115878. Currently, the price is around 115200. Overall, although it is in an upward phase, as long as it does not break and stabilize above the resistance area of 116000-116500, the market will still be dominated by short positions.
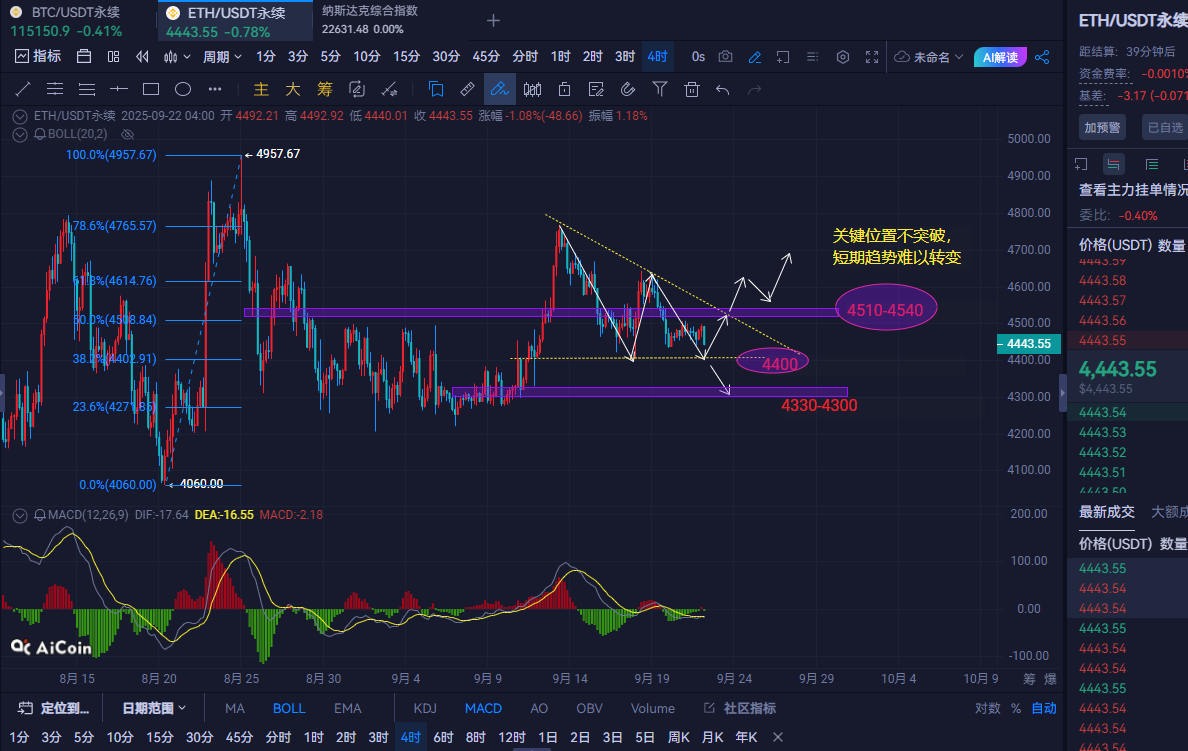
Ethereum, from the daily chart, shows that the recent price has been fluctuating around 4500, with a long lower shadow appearing on September 19, indicating strong support below. From the 4-hour cycle, the recent K-lines show consecutive bearish candles, with bears dominating in the short term. The technical indicators MACD 4-hour DIF and DEA are both below the zero axis, and the histogram has turned from red to green, indicating an increase in bearish momentum. Overall, it is in a downtrend, and without breaking the key resistance area of 4510-4540, the market will continue to test the strong support around 4400.
Trading Suggestions: For Bitcoin, consider shorting around 115800-116200, with a stop loss at 116800 and a target of 115000-114600. If it breaks, look for 114200-113800; if it does not break, consider going long.
For Ethereum, consider shorting around 4490-4510, with a stop loss at 4545 and a target of 4440-4410. If it breaks, look for 4390-4370; if it does not break, consider going long.
This strategy is for reference only; please invest cautiously and secure profits. (Follow Dan on WeChat: Ethereum Kai)
免责声明:本文章仅代表作者个人观点,不代表本平台的立场和观点。本文章仅供信息分享,不构成对任何人的任何投资建议。用户与作者之间的任何争议,与本平台无关。如网页中刊载的文章或图片涉及侵权,请提供相关的权利证明和身份证明发送邮件到support@aicoin.com,本平台相关工作人员将会进行核查。


