Written by: CryptoVizArt, Chris Beamish, Antoine Colpaert
Compiled by: AididiaoJP, Foresight News
In the rebound following the Federal Open Market Committee meeting, Bitcoin's trading price is above $115,200, with 95% of the supply in profit. The futures market shows a short squeeze, with open interest in options reaching a record 500,000 Bitcoin before the expiration on September 26. Holding above $115,200 is crucial, while a drop below this level could lead to a decline towards $105,500.
Summary
- Bitcoin exhibited a moderate upward momentum before the Federal Open Market Committee meeting on September 17. The derivatives market has shifted from a risk-off stance to a more balanced position allocation, alleviating concerns of a downturn following the FOMC meeting. The spot market shows mild selling pressure, while perpetual contracts are harvesting liquidity through a short squeeze.
- Open interest in perpetual contracts peaked at 395,000 Bitcoin but fell back to around 380,000 Bitcoin due to volatility liquidating leveraged traders. The liquidation pattern confirmed that shorts were squeezed before the FOMC meeting, followed by long liquidations during the pullback after the interest rate decision.
- Open interest in options reached a record 500,000 Bitcoin, with the September 26 expiration set to be the largest delivery in history. The expiration cash flow around the $110,000 maximum pain level could have a strong impact on spot prices.
- The volatility re-pricing before the FOMC meeting pushed the 1-month implied volatility (IV) and realized volatility (RV) spread wider, while the market makers' position allocation suggests that hedging cash flows can sustain upward momentum and buffer against declines.
- On-chain, Bitcoin's trading price is above the cost basis of 95% of the supply ($115,200). Maintaining this level is critical for sustaining upward momentum, while losing this level could lead to a drop towards $105,500.
Since early September, the Bitcoin market has shown moderate upward momentum, driven by expectations of an FOMC rate cut and optimistic sentiment regarding its potential impact.
This article examines the market dynamics in the days leading up to the meeting, as well as the structure of the perpetual and options markets following the interest rate decision. Finally, we turn to on-chain metrics to assess the broader macro cycle and determine whether the foundation for a sustained trend is forming.
Perpetual Market Analysis
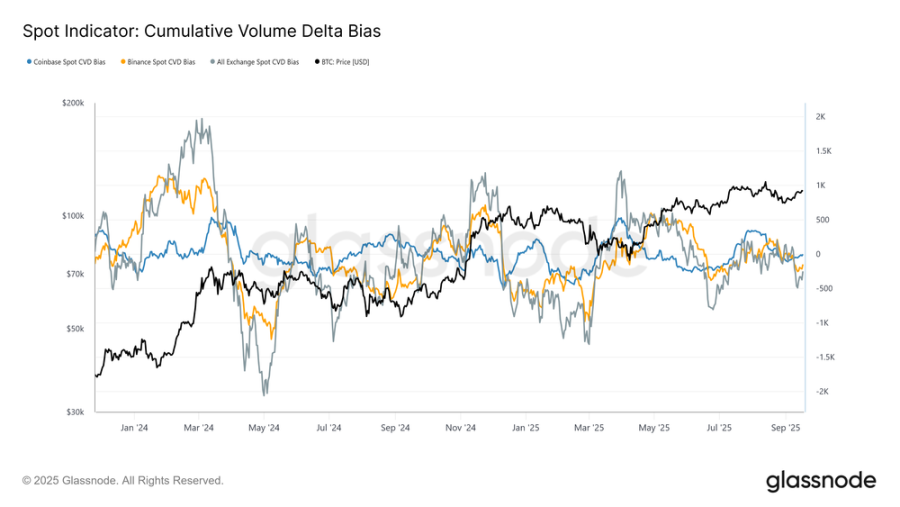
Throughout September, Bitcoin stabilized around $107,800, consistent with the cost basis of short-term holders. From this level, the market structure shifted from balance to a slight seller-driven state. This bias is captured by the cumulative volume delta (CVD) deviating from its 90-day median baseline.
In the days leading up to the FOMC meeting, CVD on Coinbase, Binance, and all major exchanges showed mild negative deviations, highlighting net selling pressure in the spot market and a cautious attitude among participants.
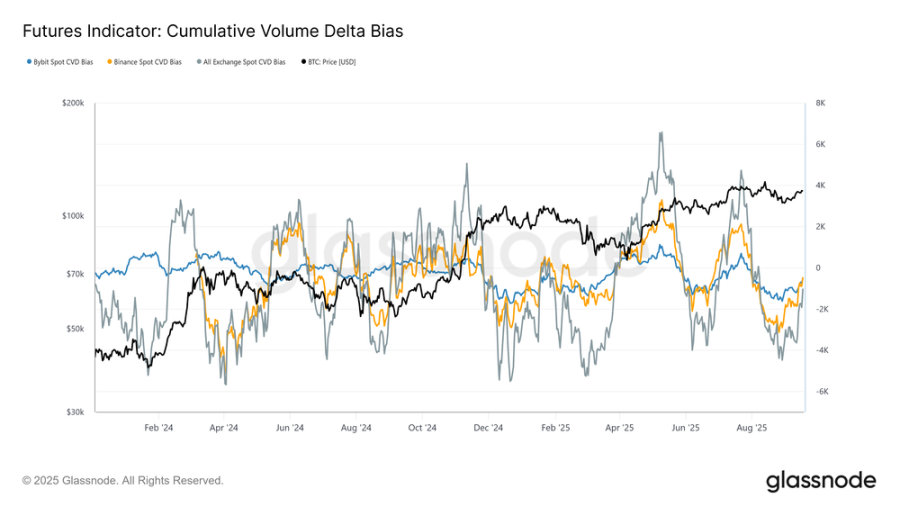
If we extend the same perspective to the perpetual market, the cumulative volume delta CVD indicates a significant shift from extreme selling to an almost balanced state. This reflects a notable return of liquidity, as buyer cash flows offset ongoing selling pressure from late August to the FOMC meeting.
This stability underscores the core role of the futures market in supporting the rebound, as speculators positioned themselves ahead of the rate cut, anticipating positive policy outcomes.
Perpetual Contract Open Interest
Given the significant role of futures in the current market dynamics, perpetual contract indicators provide a clearer view of short-term sentiment.
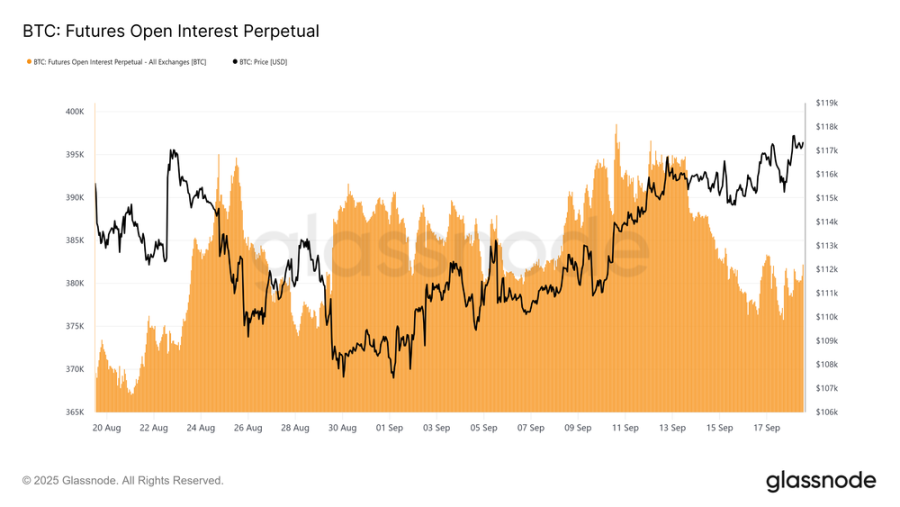
Open interest (OI) in perpetual contracts surged to a cycle high of approximately 395,000 Bitcoin on September 13, reflecting aggressive position building. However, by Monday, September 16, the choppy price action drove OI down to 378,000 Bitcoin, a decline of about 4.3%.
Since the FOMC meeting, OI has stabilized between 378,000 and 384,000 Bitcoin, a pattern consistent with rising intraday volatility and the liquidation of leveraged traders around key macro events. This highlights the increased sensitivity of the futures market to policy-driven catalysts.
Short Squeeze and Long Liquidations
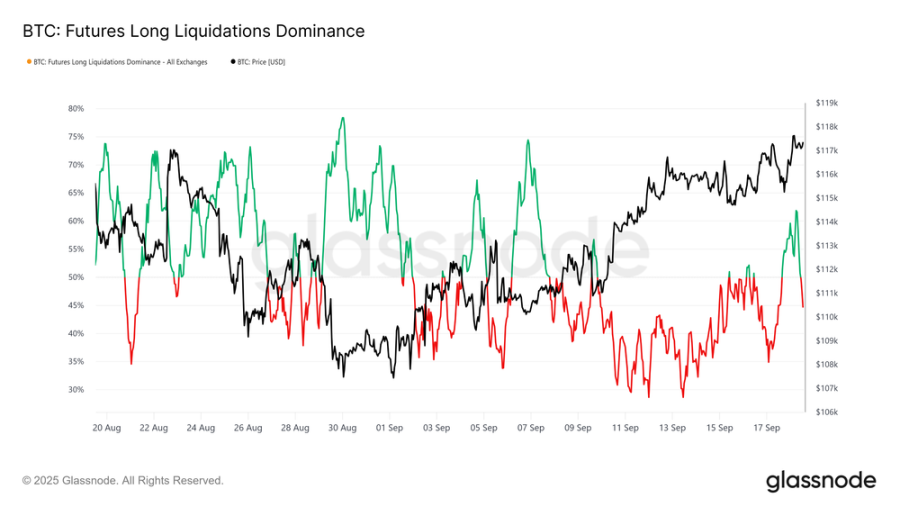
Observing the dominant liquidation situation over the past 30 days shows that the decline in open interest from September 13 to 17 was primarily driven by short liquidations. This translated into a series of short squeezes before the FOMC announcement, driving momentum for long positions in perpetual contracts.
However, this state was abruptly interrupted when prices sharply retraced to $115,000 after the rate cut, triggering a wave of high-leverage long liquidations and pushing the long liquidation dominance ratio up to 62%.
We can simultaneously highlight recent long liquidations and the short-term maximum pain levels. The indicators in this dashboard serve as proxies for liquidation prices, accurately pinpointing the levels at which traders face forced liquidation risks and helping to predict potential cascading liquidations. These indicators are based on the 1,000 largest Bitcoin positions on Hyperliquid, providing highly relevant proxies for broader market positions.
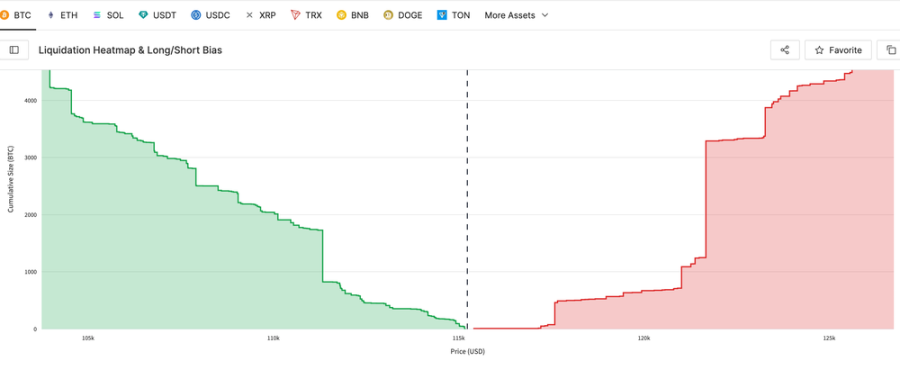
Maximum Pain
We start with the liquidation wall to measure the most direct maximum pain levels for long and short positions. The latest hourly snapshot highlights potential liquidation "walls": prices below the spot price indicate long liquidations, while prices above the spot price indicate short liquidations.
Currently, the maximum pain level for longs is at $112,700, while the maximum pain level for shorts is at $121,600, with the spot trading price at $117,200. This indicates that the market is in a fragile balance, where a downward move could trigger long liquidations, while an upward breakout could drive a short squeeze, pushing prices towards recent highs.
Options Market
Turning our focus to the options market, we utilize position allocation and expiration dates to assess short-term volatility expectations.
Rising Options OI and Expiration Dynamics
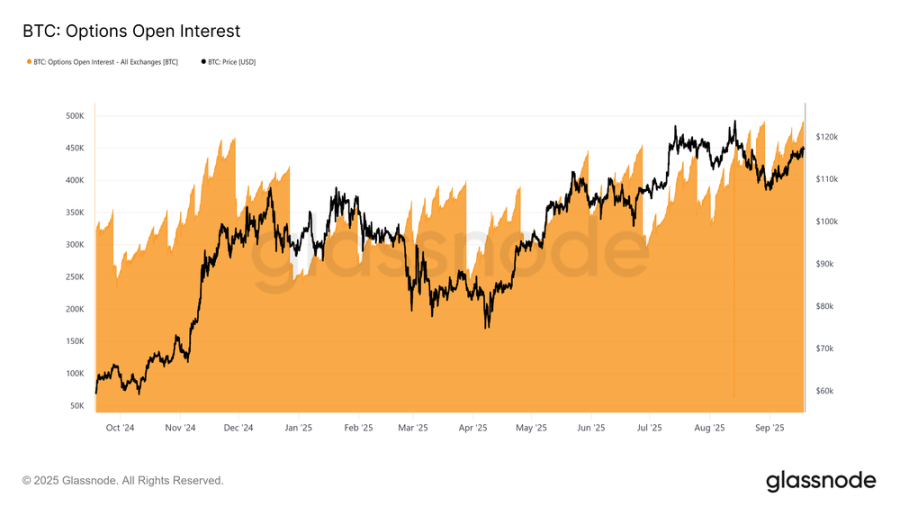
Open interest (OI) in Bitcoin options has surged to nearly 500,000 Bitcoin, reaching an all-time high, highlighting the growing adoption of options for hedging and speculation. OI typically declines at the end of the month, with more pronounced drops at the end of the quarter, before rebuilding. This pattern reflects the dominance of monthly expiration dates, while weekly options are only listed 2-3 weeks in advance. Quarterly expiration dates, often referred to as "triple witching," combine weekly, monthly, and quarterly expirations, concentrating cash flows and liquidity.
Although the rising OI does not reveal directional bias, it indicates that the market is maturing and deploying complex structures to manage risk. Importantly, as OI peaks near expiration, the gamma effect may amplify spot volatility, as market makers hedge more aggressively, making the expiration date increasingly impactful on Bitcoin price movements.
Record Setting
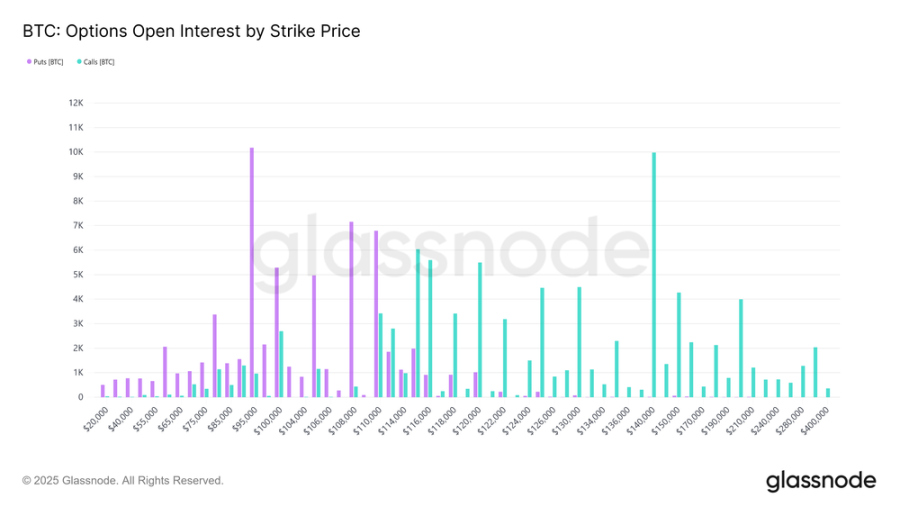
Based on the continuously rising open interest, the September 26 expiration date has become a key event in the options market.
This expiration is set to be the largest in Bitcoin's history, reflecting nine months of accumulation since its listing. The distribution of strike prices is exceptionally broad, with open interest concentrated in the downward direction at $95,000 put options and upward direction at $140,000 call options. While these levels are likely to expire out of the money, they highlight the positions traders have taken for speculation or hedging throughout the year.
The maximum pain point is around $110,000, the price level at which most options will become worthless, which typically exerts gravitational pull before expiration. Given the massive scale of this contract, hedging cash flows could have a significant impact on spot prices until the rolling settlement at 8:00 AM UTC on September 26. Once expired, the market may release more intense volatility.
FOMC Repricing
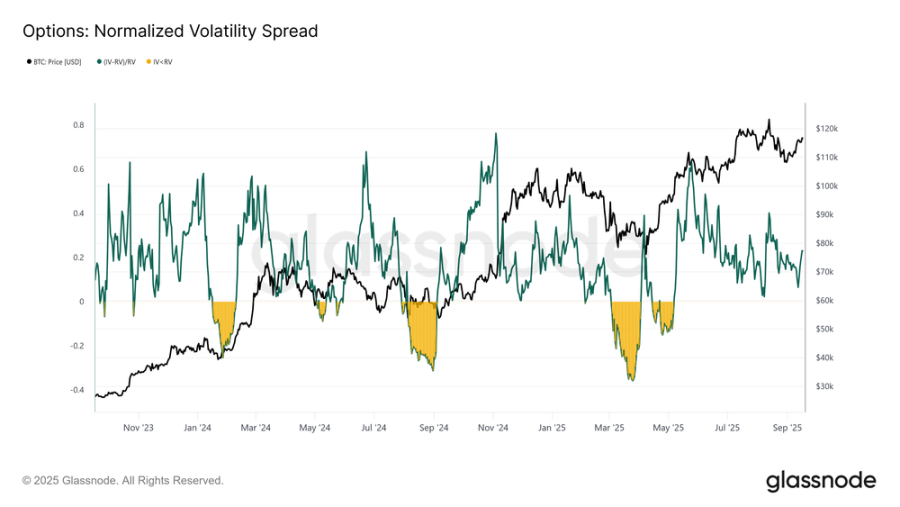
Turning to volatility, the standardized 1-month spread shows how options traders positioned themselves around the FOMC meeting.
For most of September, implied volatility (IV) closely tracked realized volatility (RV), but surged before the meeting event as market makers repriced risk, with traders scrambling to buy call options. The spread is now at 0.228, still within a normal range but slightly elevated. This reflects the additional premium demanded by sellers to absorb risk, providing income opportunities in an otherwise subdued volatility environment.
Focus on Market Maker Cash Flows
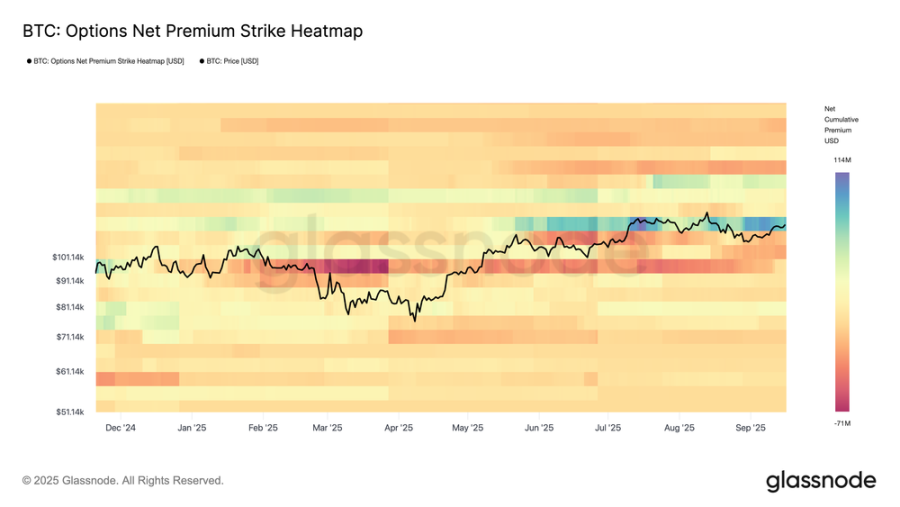
As a complement to the volatility spread, the options net premium strike price heatmap reveals how traders are positioning themselves across different strike prices.
Recent months have shown a consistent selling of put options below the spot price and buying of call options above the spot price, with increased demand in the upward direction in recent days. This structure forces market makers to be short on the upside and long on the downside, compelling them to buy hedge simultaneously during both upward and downward movements. The resulting cash flows provide momentum for extending upward moves while buffering against declines, reinforcing stability around key strike price areas.
Using On-Chain Data for Macro Navigation
After reviewing perpetual and options indicators, we now turn to on-chain metrics to assess the market from a macro and investor behavior perspective.
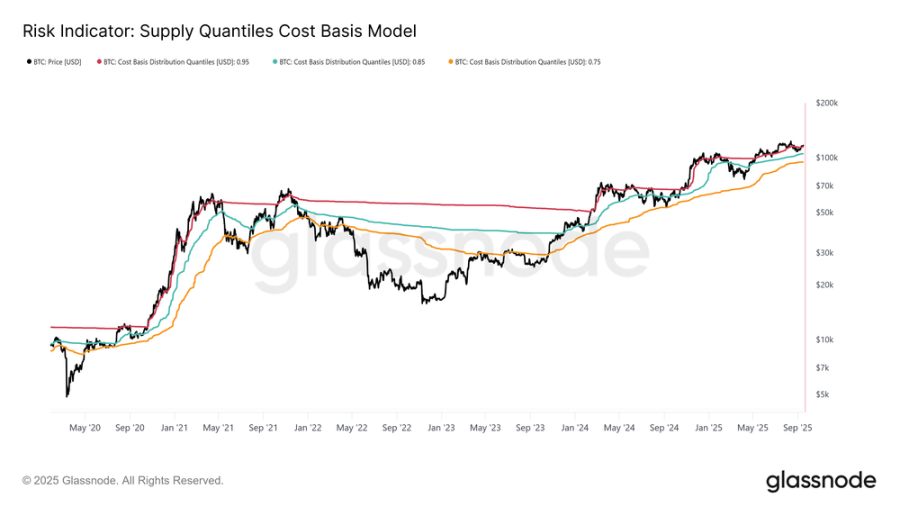
After the FOMC meeting, Bitcoin rose to $117,200, pushing most of the supply back into profit. The supply quantile cost basis model shows that the current price is now above the cost basis of 95% of the supply ($115,200). Maintaining above this level is crucial for sustaining demand-side momentum. Conversely, failing to hold above this level would increase the likelihood of price contraction back into the 85%-95% quantile range between $105,500 and $115,200, where belief may weaken and new selling pressure could emerge.
Conclusion
Following the FOMC-driven rebound, the Bitcoin market remains in a delicate balance. In the futures market, the net selling pressure in the spot market is offset by new liquidity in perpetual contracts, with short squeezes and liquidations playing a key role.
The options market highlights record open interest and historic quarterly expirations, pointing to increased volatility potential, with market maker cash flows providing support during declines and driving momentum during rises.
On-chain, Bitcoin's trading price is above the cost basis of 95% of the supply, and this level is now a critical dividing line. Holding above $115,200 will maintain demand-driven momentum, while losing this level could lead to a drop towards the range of $105,500 to $115,200. In summary, these signals indicate that the market is waiting for confirmation, with stability above the key cost basis level potentially expanding upside space, while the fragility of cash flows keeps downside risks present.
免责声明:本文章仅代表作者个人观点,不代表本平台的立场和观点。本文章仅供信息分享,不构成对任何人的任何投资建议。用户与作者之间的任何争议,与本平台无关。如网页中刊载的文章或图片涉及侵权,请提供相关的权利证明和身份证明发送邮件到support@aicoin.com,本平台相关工作人员将会进行核查。


