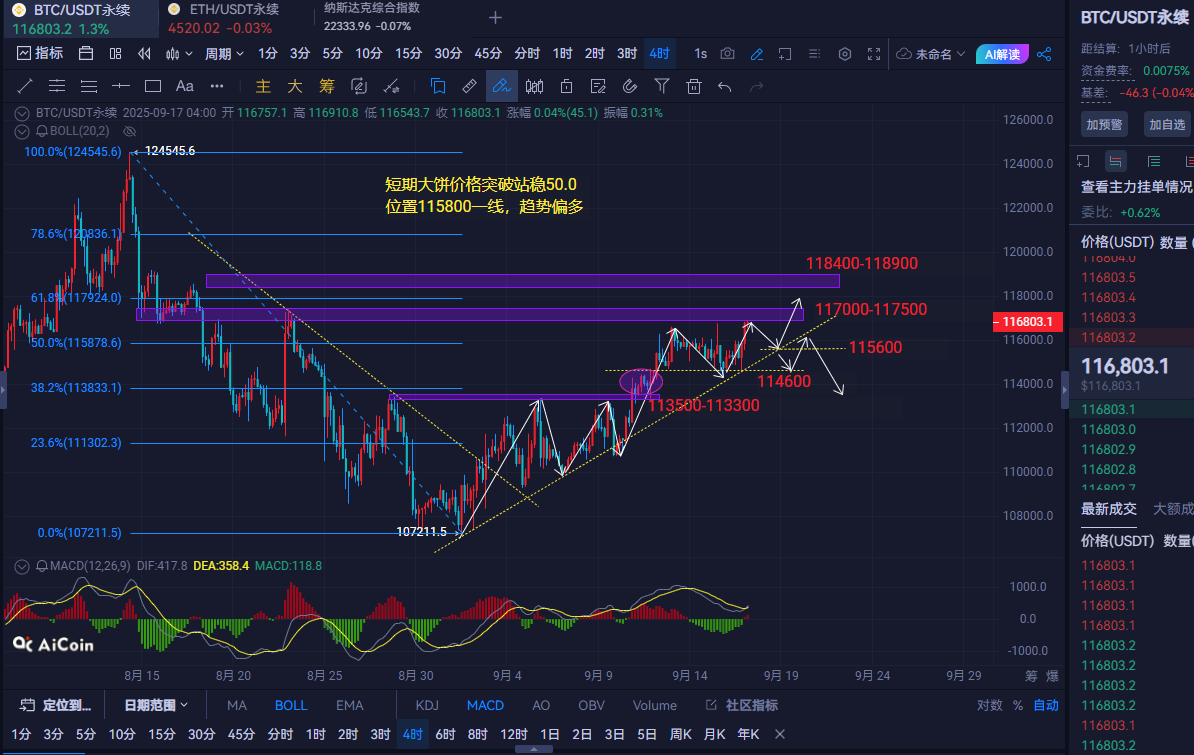
Morning Analysis: From the 4-hour chart, the Bitcoin price has rebounded above the 50.0 position at 115800 after a pullback from the highest point. The short-term trend is bullish, but attention should be paid to the important resistance area at 61.8, which is between 117500-117900. On the daily chart, a doji star has formed, closing above the upper shadow and slowly breaking through the previous high. The 1-hour chart shows a fluctuating pattern, with each rally accompanied by a certain pullback, and the highs are gradually rising. Overall, this indicates that the bullish momentum has not yet ended.
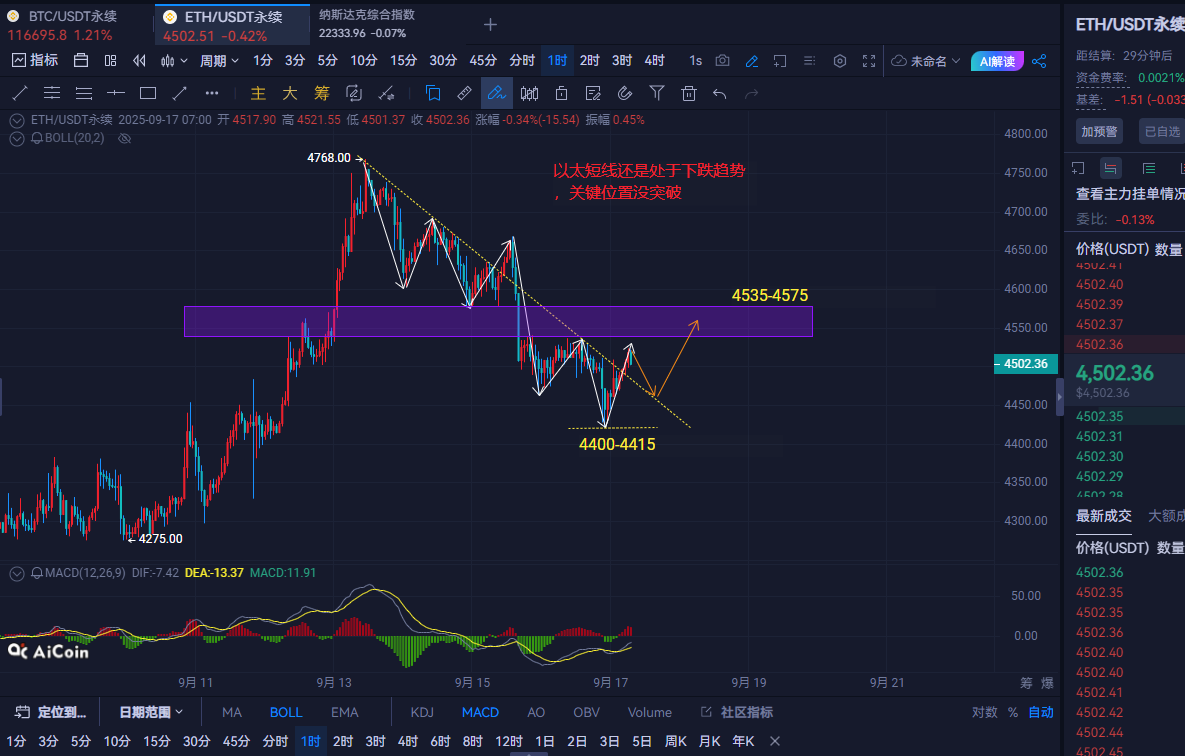
Ethereum's daily level shows that the price has been fluctuating around 4500 recently, with a longer lower shadow appearing in the past few days, indicating some buying support below. On the 1-hour chart, Ethereum's price is forming a pattern of gradually lower lows and lower highs, but overall it remains in a short-term weak fluctuating pattern. The technical indicator MACD on the hourly chart shows both DIF and DEA are negative, and the histogram has turned from green to red, indicating a weakening of bearish momentum; however, on the daily level, MACD is still in a death cross state, with a weak trend overall. In summary, the focus is on short positions.
Trading Suggestions: For Bitcoin, consider going long near 115500-115800, with a stop loss at 114800, targeting around 117000-117500. If broken, look for 117900-118300; if not broken, consider shorting.
For Ethereum, consider going long near 4460-4440, with a stop loss at 4410, targeting around 4535-4560. If broken, look for 4580-4600; if not broken, consider shorting.
These strategies are for reference only; please invest cautiously and secure profits. (Follow Dan on WeChat: Ethereum Kai)
免责声明:本文章仅代表作者个人观点,不代表本平台的立场和观点。本文章仅供信息分享,不构成对任何人的任何投资建议。用户与作者之间的任何争议,与本平台无关。如网页中刊载的文章或图片涉及侵权,请提供相关的权利证明和身份证明发送邮件到support@aicoin.com,本平台相关工作人员将会进行核查。


