In yesterday's market analysis of Bitcoin, we provided several support levels, and in the end, it held, indicating that the bulls are still working hard to maintain confidence in the market. Currently, both yesterday and today are two small doji candles, with fierce competition for direction, and no clear winner has emerged yet. However, based on our observations, a decision is about to be made.
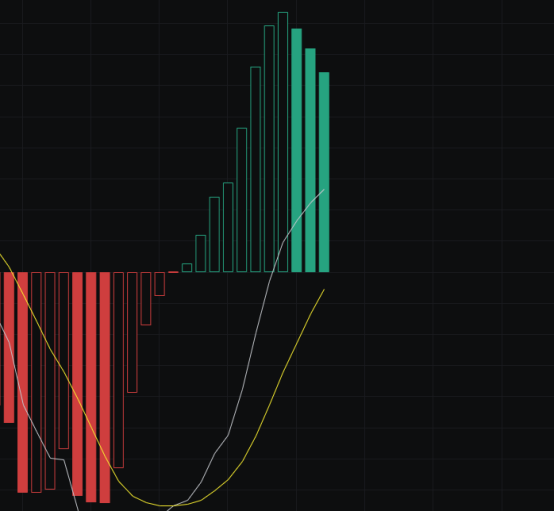
From the MACD perspective, the energy bars continue to decline, and the bullish volume is decreasing, which is not favorable for the bulls. However, it hasn't reached a point of certain decline, so we need to continue observing the market.
From the CCI perspective, since both days are doji candles, the CCI change is not significant, but it is just slightly above the zero line, so the bulls need to be cautious of risks at all times.
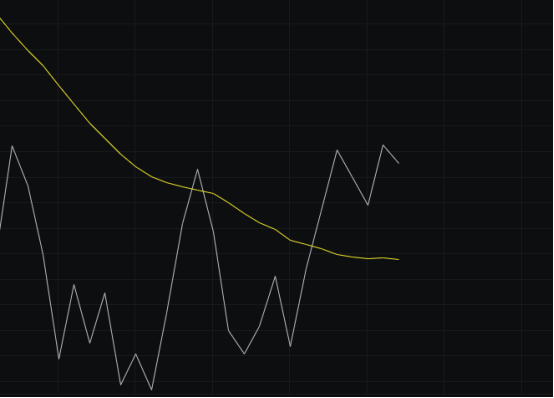
From the OBV perspective, the slow line is currently tending to flatten, but flattening is only a temporary goal for the bulls, as there is still a possibility of further decline. Therefore, the next step is to observe when the slow line starts to rise.
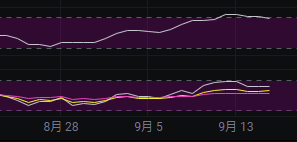
From the MFI and RSI perspective, the MFI has returned from the overbought area to the strong area, and the RSI has returned to the neutral range, overall leaning towards the bulls, so we will continue to observe the formation.
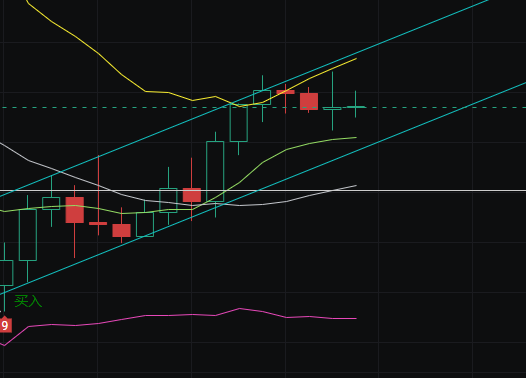
From the moving average perspective, the price has been hovering above the 60 line for five consecutive days, indicating that the 60 line is providing support for the market. Therefore, we will continue to observe whether the 60 line can maintain its support, as holding it would be a significant victory for the bulls. We will also watch to see if the 30 line can flatten.
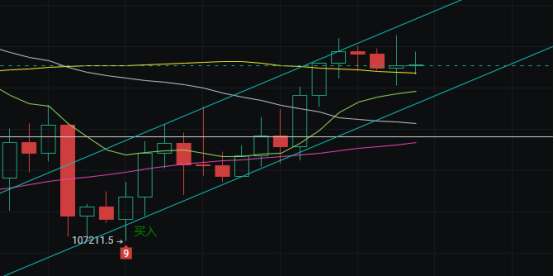
From the Bollinger Bands perspective, the upper and lower bands are still not synchronized, which means there is still a possibility of a false bullish signal, and this is the biggest risk point. To eliminate this risk, it would be best for the price to rise by about 0.5% first, and then see if the upper and lower bands can synchronize.
In summary: Overall, the market is at a critical juncture where it can go either up or down, so we believe the market is about to change direction again. From a technical indicator perspective, it leans more towards continuing to rise. If it does rise, we need to pay attention to whether the moving averages and Bollinger Bands perform well. The support levels below are 115000-114200-112600, and the resistance levels above are 116000-117000. In the future, we will judge the strength of bulls and bears based on the price levels reached.
免责声明:本文章仅代表作者个人观点,不代表本平台的立场和观点。本文章仅供信息分享,不构成对任何人的任何投资建议。用户与作者之间的任何争议,与本平台无关。如网页中刊载的文章或图片涉及侵权,请提供相关的权利证明和身份证明发送邮件到support@aicoin.com,本平台相关工作人员将会进行核查。


