Last week we discussed several targets for the bulls, and the bulls achieved our highest target, which is a price around 115600. On Thursday, we also mentioned that the market would look for consolidation, and both Sundays closed with bearish candles, aligning with our expectation for consolidation. Overall, the market is still moving as we anticipated. So how will it move this week? Let's analyze it step by step.
Weekly Level
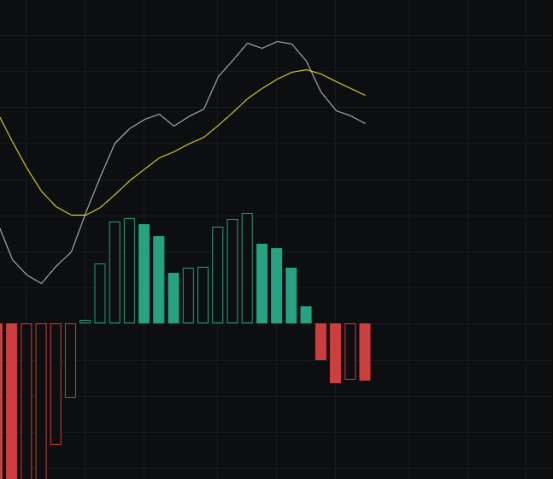
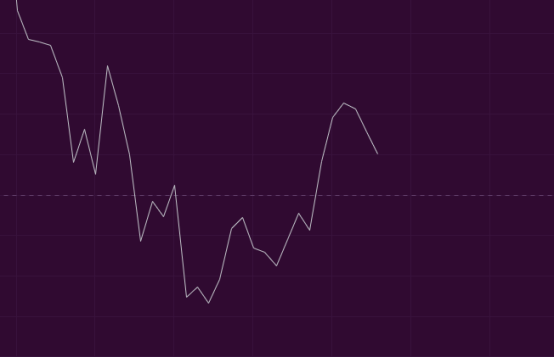
From the MACD perspective, a death cross occurred at the end of August, and everyone was bearish. However, we have consistently analyzed from the bulls' perspective, and the trades we provided were all long positions, with several of them being profitable. But from a pattern perspective, it is heading downwards, so the MACD pattern is not favorable for the bulls.
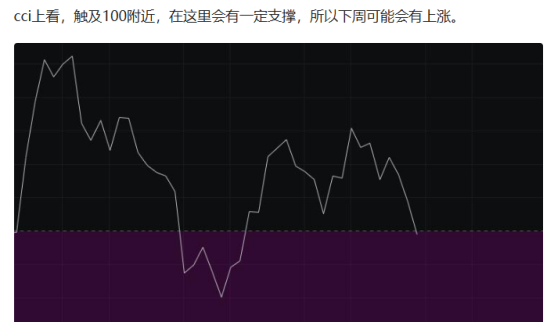
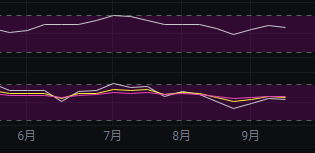
From the CCI perspective, when the CCI dropped to the 100 level, we boldly predicted that the market would rise, and the market has risen continuously for two weeks as we predicted. Currently, the CCI is still above 100, maintaining a bullish range, but it is close to 100, with the possibility of breaking below it at any time.
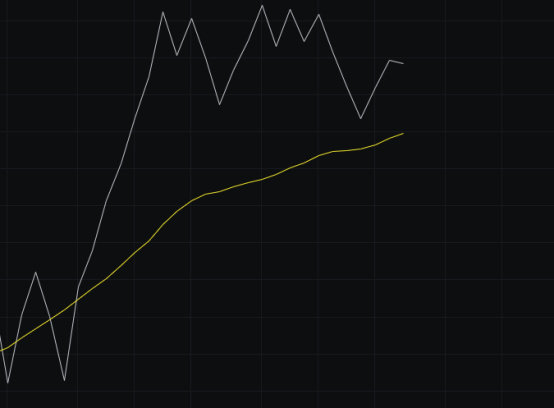
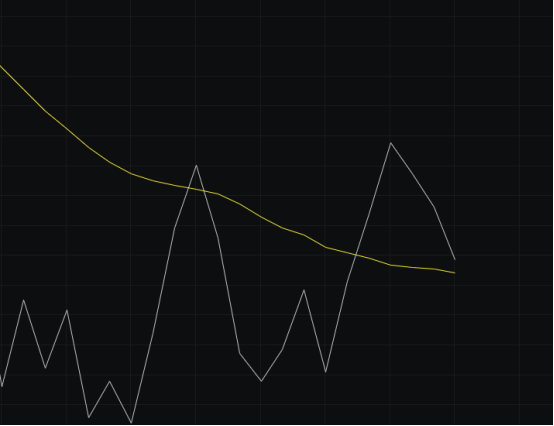
From the OBV perspective, with two weeks of bullish closes, the OBV has shown some recovery, and the slow line continues to move upwards. We need to keep observing the slow line; if it flattens, we should be cautious of risks.
From the MFI and RSI perspectives, both indicators have returned to a neutral range, where they can go either up or down, so we need to continue observing the subsequent trends.
From the moving averages perspective, with two weeks of bullish closes, the price has risen above the BBI, giving the bulls some breathing room. We will observe whether the BBI can continue to provide support.
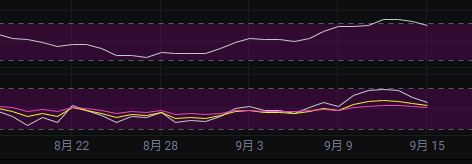
From the Bollinger Bands perspective, the upper and lower bands are narrowing. If this trend continues, the expectations for the market will decrease. If the price moves down, we will first look at whether the middle band can provide support; if not, we will look at the lower band. If the price moves up, we will look at the upper band, so we will monitor the changes in the Bollinger Bands.
Daily Level
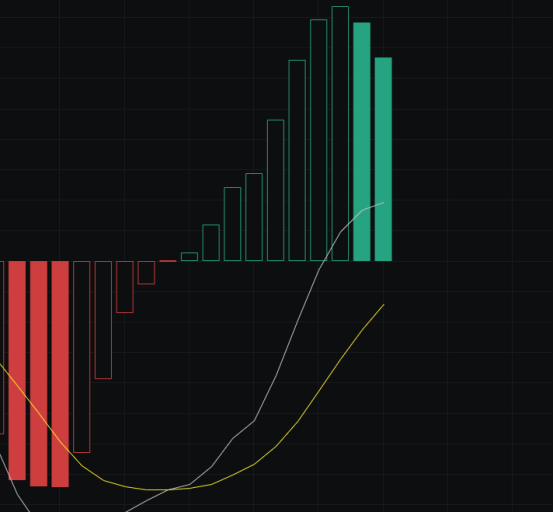
From the MACD perspective, with two days of bearish closes, the energy bars have started to retreat downwards, which is unfavorable for the bulls. We need to continue observing the trend of the energy bars.
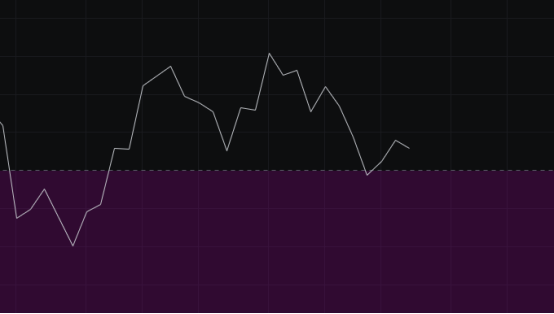
From the CCI perspective, two consecutive days of bearish closes have brought the CCI closer to the zero line, with the possibility of breaking below it at any time, so the bulls still face risks.
From the OBV perspective, although the fast line is above the slow line, with two days of bearish closes, the fast line is also moving downwards, and the slow line has not flattened. We need to observe whether the slow line can flatten.
From the MFI and RSI perspectives, the indicators have entered a pullback trend after hitting the overbought zone, but they are still in a strong range. We will observe whether the trend moves upwards or downwards.
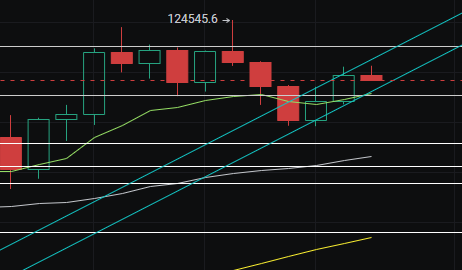
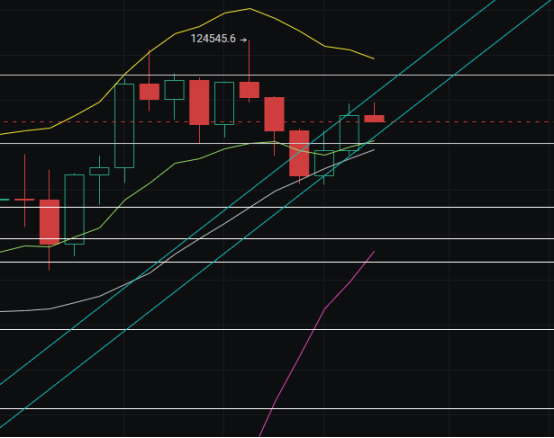
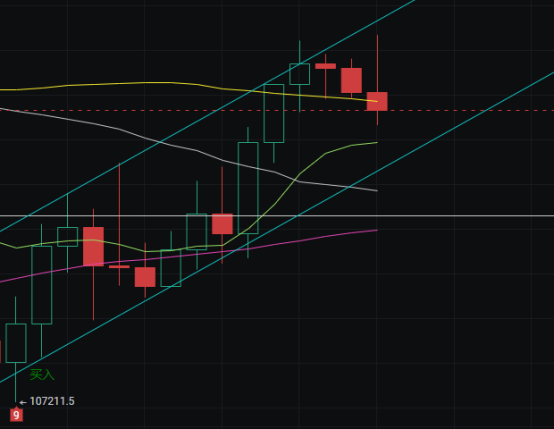
From the moving averages perspective, today the price surged and then rapidly declined, breaking the previous high. This raises suspicions of a short squeeze, so the price is likely to continue moving downwards. Today's support levels are first at 113900, then at 112800 and 112000.
From the Bollinger Bands perspective, the upper and lower bands have not synchronized, which raises suspicions of a false breakout. Considering the rapid drop after the price surge, there is still a possibility for the price to continue moving downwards, so bulls should manage their stop losses carefully.
In summary: From the daily pattern, we first see a surge followed by a drop, interpreted as a short squeeze, and we also see signals of a false breakout, so there is a possibility for the price to continue dropping. We have provided three support levels for the pullback: 113900, 112800, and 112000. We will assess the strength of the bulls based on how far the price drops. Additionally, there is an interest rate decision on the 18th of this week, which is also a significant news event to watch, as it may lead to considerable volatility.
免责声明:本文章仅代表作者个人观点,不代表本平台的立场和观点。本文章仅供信息分享,不构成对任何人的任何投资建议。用户与作者之间的任何争议,与本平台无关。如网页中刊载的文章或图片涉及侵权,请提供相关的权利证明和身份证明发送邮件到support@aicoin.com,本平台相关工作人员将会进行核查。


