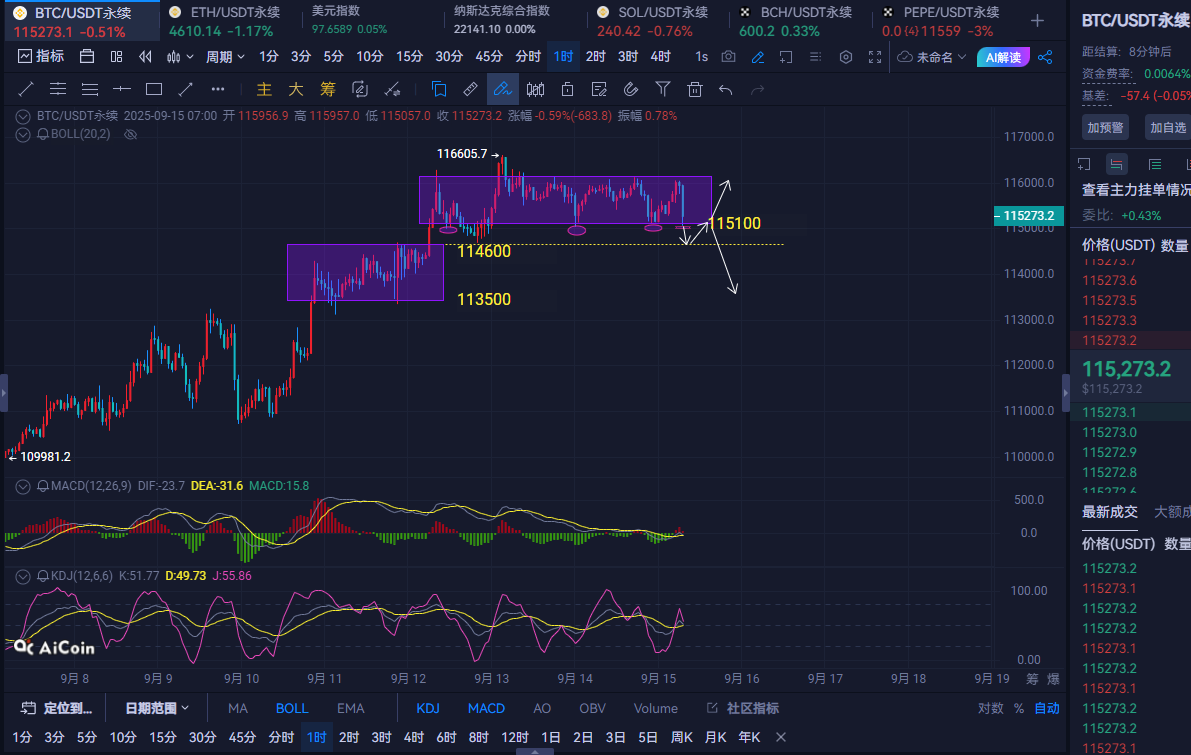
Morning Analysis: From the daily chart, Bitcoin has recorded three consecutive bearish candles, and it is clearly moving in a step-like manner, indicating strong resistance above. The current price is continuously oscillating at a high level. Although there has been some price rebound, the key resistance level has not been strongly broken. From the hourly chart, the recent price has repeatedly triggered pullbacks after testing the resistance in a range-bound pattern. The support has been tested multiple times and is becoming increasingly weak, so my outlook leans towards short positions.
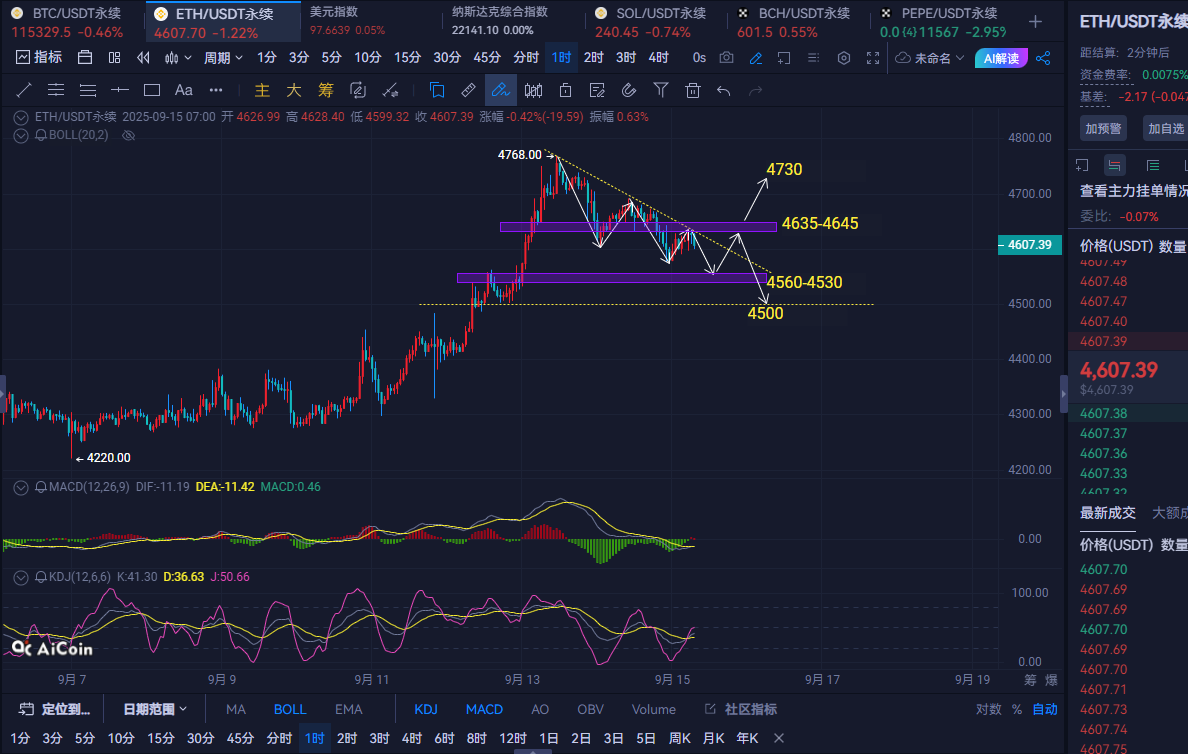
From the daily chart of Ethereum, the recent price has retreated from a high level, forming consecutive bearish candles, indicating a short-term adjustment trend. From the hourly chart, it is still in a downtrend but has not completely reversed. The main key support levels are 4560-4530-4500. Currently, the price is oscillating around the 4590-4635 range, testing the lower support multiple times without showing significant rebound signals. The MACD is below the zero line, with bearish momentum weakening but not yet turning bullish; the daily MACD has continued to diverge downwards after a death cross, indicating an overall weak trend.


Trading Suggestions: For Bitcoin, consider shorting near 115400-115700, with a stop loss at 116350 and a target around 114600-114200. If broken, look for 113500-113800; if not broken, consider going long.
For Ethereum, consider going long on a pullback near 4560-4530, with a stop loss at 4500 and a target around 4635-4645. If broken, look for 4685-4700; if not broken, consider going short.
This strategy is for reference only; please invest cautiously and secure profits. (Follow Dan on WeChat: Ethereum Kai)
免责声明:本文章仅代表作者个人观点,不代表本平台的立场和观点。本文章仅供信息分享,不构成对任何人的任何投资建议。用户与作者之间的任何争议,与本平台无关。如网页中刊载的文章或图片涉及侵权,请提供相关的权利证明和身份证明发送邮件到support@aicoin.com,本平台相关工作人员将会进行核查。


