On the evening of September 11, Beijing time, the U.S. released the August CPI data, showing a slight rebound in inflation. The August CPI rose by 0.4% month-on-month, slightly higher than the expected 0.3%; the annualized CPI was 2.9%, in line with expectations, reaching a seven-month high. The core CPI showed a slight increase compared to the previous period. At the same time, the initial jobless claims in the week ending September 6 recorded 263,000, higher than the market expectation of 235,000, marking the highest level since October 23, 2021.
With the release of the August CPI data, the market's focus on the Federal Reserve's meeting next week has shifted to the extent of interest rate cuts. Currently, the market expects the Federal Reserve to announce a 25 basis point rate cut at next week's meeting, whereas the previous expectation for a rate cut was only 14%.
The rising expectations for rate cuts not only reflect the market's concerns about economic slowdown but also provide strong support for the prices of risk assets. This could further push up the prices of risk assets, including gold and cryptocurrencies.
In particular, the cryptocurrency market reacted strongly to the CPI data report, with Bitcoin quickly dropping below $114,000 after the report was released, hitting a low of $113,452. However, following the strengthened expectations for rate cuts, Bitcoin's price surged. This morning, the highest quote was $116,331, which was also the target price for long positions mentioned by the author in the article on September 10. As of the time of writing, it has retreated slightly, with a quote of $114,971, having given back more than half of the gains from earlier, approximately 0.42% in the last 24 hours.
Bitcoin Four-Hour Chart
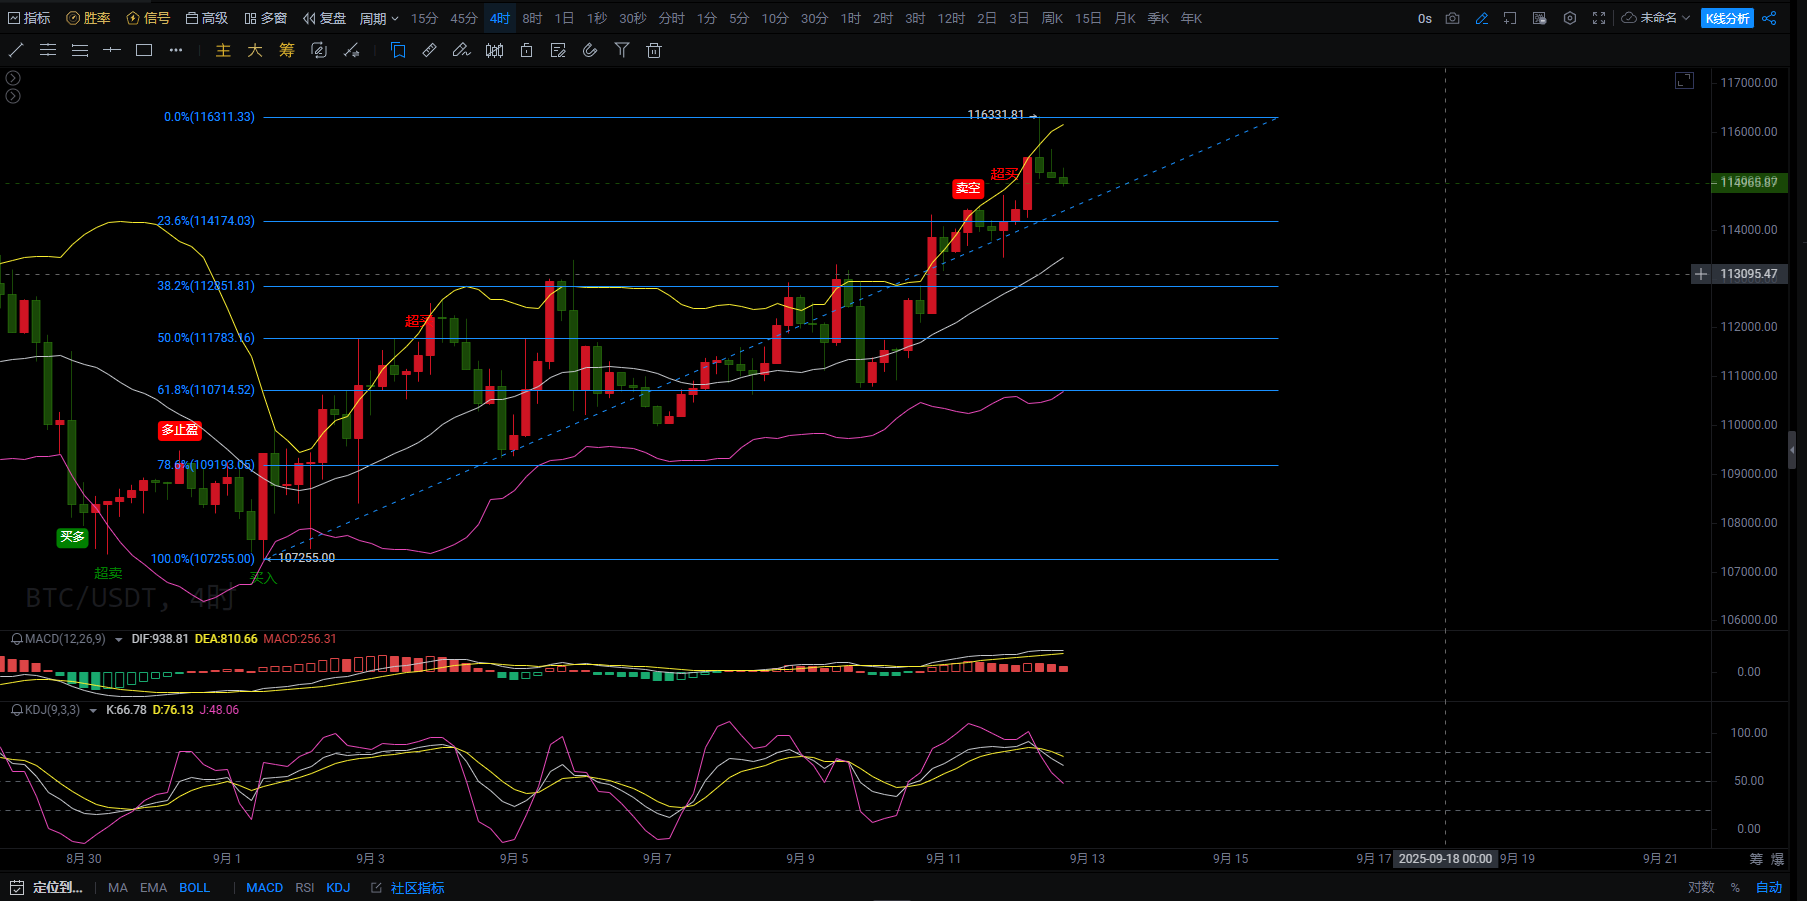
Bitcoin's current price is oscillating in the range of $114,900-$115,000, approaching the 23.6% Fibonacci retracement level of $114,174 and the resistance zone formed by the previous high of $116,331. The key resistance above is in the range of $116,300-$116,500. If it can effectively break through and stabilize in this area, it will open up a new round of upward space. The important support below is at $113,100 (38.2% retracement level). If it fails to hold this level, it may further test $111,700 (50% retracement level).
From a technical indicator perspective, Bitcoin's price is operating near the upper Bollinger Band, indicating short-term strength, but continuous operation at the upper band may trigger a pullback pressure. The widening of the Bollinger Band indicates increased market volatility, suggesting that a significant directional choice may occur in the future. If it cannot stabilize in the $116,000-$116,500 range, the price may pull back to the middle band around $113,500-$114,000.
The MACD indicator shows that the DIF line is still above the DEA line, but the two lines are converging. The shortening of the MACD red histogram suggests a weakening of bullish momentum. If the DIF line crosses below the DEA line to form a death cross, the price may retest the Fibonacci 38.2% or 50% support levels. If the MACD maintains a golden cross state and continues to widen, it indicates that the market is still in a strong upward trend.
In the KDJ indicator, the K and D values are close to the 80 overbought area, and the J line has started to turn down, indicating short-term overbought signs. If the K and D lines confirm a high-level death cross, it may trigger a technical pullback. However, as long as the pullback does not fall below the $113,000-$111,700 range, it can still be considered a healthy bullish adjustment.
In summary, breaking through and stabilizing in the $116,300-$116,500 range may push the price to challenge $118,000-$120,000. If it encounters resistance at $116,000, it may pull back to $113,000-$114,000 to seek support before rising again. Currently, Bitcoin is at the high end of the rising channel, slightly overbought in the short term, with a possibility of a pullback. The key focus is on the breakthrough of the $116,300 resistance level; if successful, the upward trend will continue, while failure may lead to a pullback to the $113,000-$111,700 support zone. The overall trend still leans towards bullish, but short-term adjustment risks should be noted.
Based on the above, the author provides the following suggestions for reference:
Long Bitcoin near $113,300-$113,600, targeting $114,800-$115,500. If it stabilizes effectively, look for $116,000-$116,500, with a stop loss at $112,830.
Giving you a 100% accurate suggestion is not as good as providing you with the right mindset and trend. After all, teaching someone to fish is better than giving them fish; suggestions may earn you a moment, but learning the mindset will earn you a lifetime! The focus is on the mindset, grasping the trend, and planning positions. What I can do is use my practical experience to help you, guiding your investment decisions and management in the right direction.

Writing time: (2025-09-12, 18:00)
(Written by - Author of "Talking About Coins") Disclaimer: Online publication has delays; the above suggestions are for reference only. The author is dedicated to research and analysis in the investment fields of Bitcoin, Ethereum, altcoins, forex, stocks, etc., having been involved in the financial market for many years and possessing rich practical experience. Investment carries risks; please proceed with caution.
免责声明:本文章仅代表作者个人观点,不代表本平台的立场和观点。本文章仅供信息分享,不构成对任何人的任何投资建议。用户与作者之间的任何争议,与本平台无关。如网页中刊载的文章或图片涉及侵权,请提供相关的权利证明和身份证明发送邮件到support@aicoin.com,本平台相关工作人员将会进行核查。


