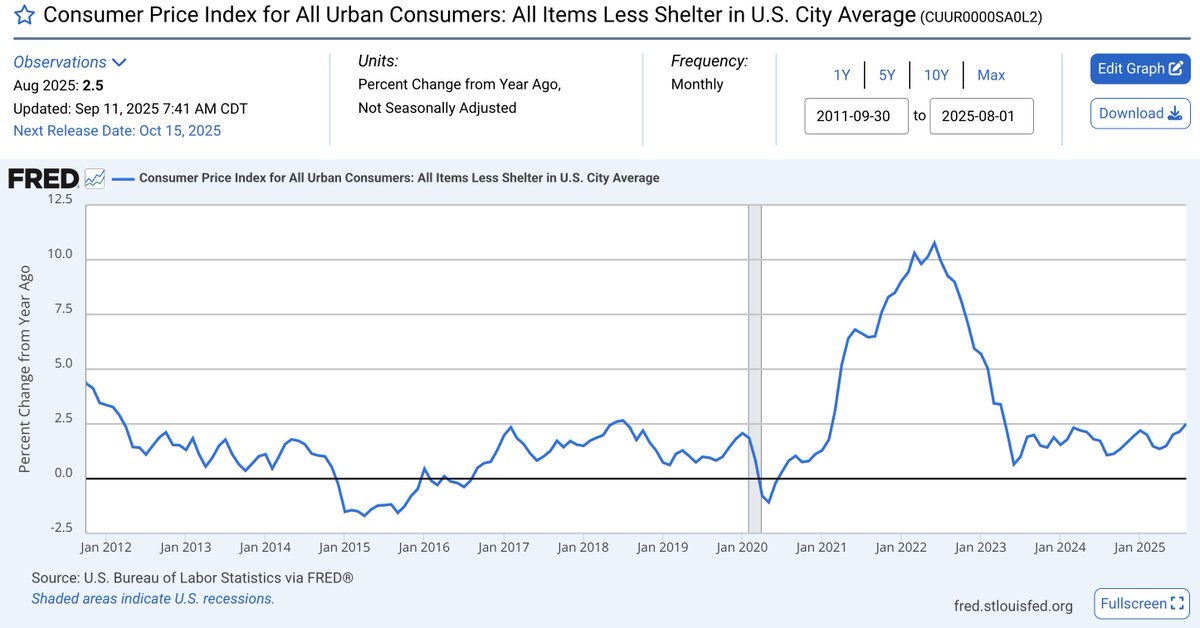
This is the key chart from the CPI data.
It's the all items ex-Shelter inflation rate on a YoY basis.
I extract Shelter because it's the largest component (33% of CPI) and the laggiest (8-12 months behind real-time housing data).
It continues to accelerate, reaching +2.5% YoY.
In April 2025, this inflation rate was only +1.35% YoY.
It's nearly doubled in 4 months.
This means that ALL OTHER COMPONENTS WITHIN CPI are showing an aggregate inflation rate well-above the Federal Reserve's +2% YoY target, while reaccelerating.
In fact, this is the highest pace of inflation for this datapoint since April 2023... which was 28 months ago!
However, in April 2023, this datapoint was showing disinflation.
This is a major concern.
免责声明:本文章仅代表作者个人观点,不代表本平台的立场和观点。本文章仅供信息分享,不构成对任何人的任何投资建议。用户与作者之间的任何争议,与本平台无关。如网页中刊载的文章或图片涉及侵权,请提供相关的权利证明和身份证明发送邮件到support@aicoin.com,本平台相关工作人员将会进行核查。


