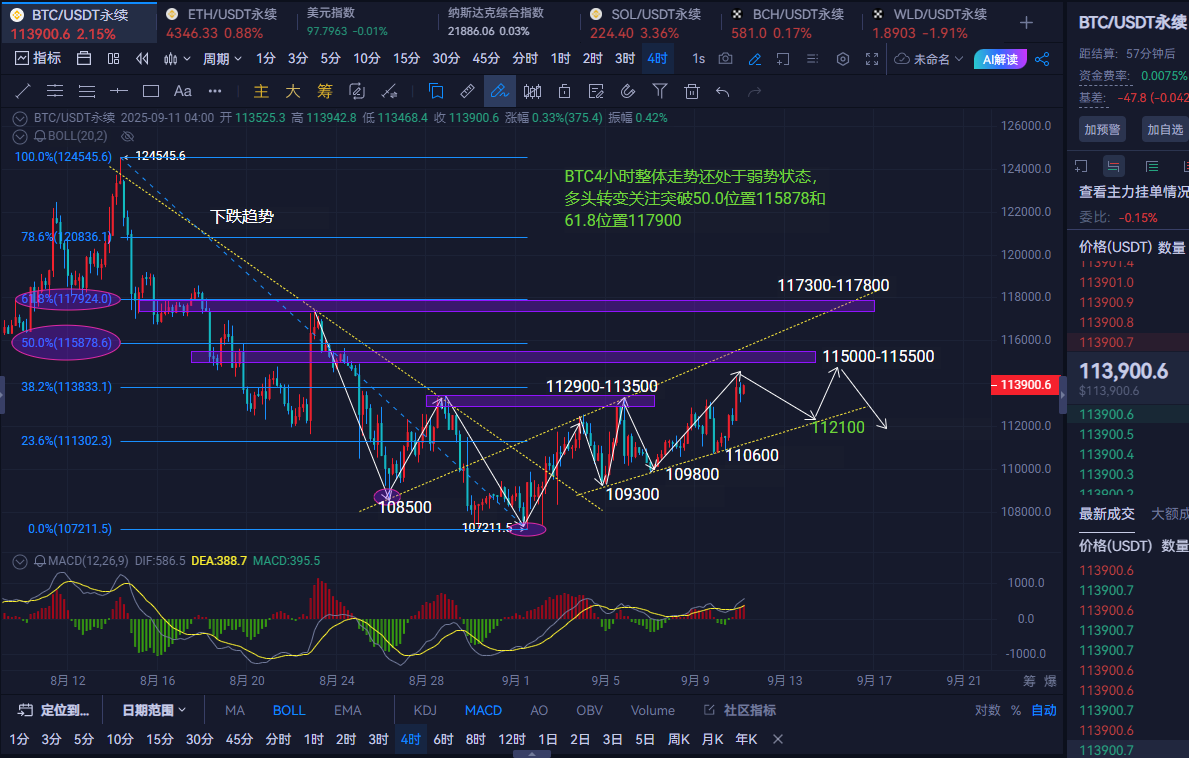
Morning Analysis: From the 4-hour chart, the current price of Bitcoin has not yet solidified its bullish trend foundation, and the overall weak state has not changed. However, from the chart structure, after sufficient energy accumulation during the previous adjustment, Bitcoin's price has once again entered a strong consecutive upward mode. The short-term bullish trend is clear, and the current high-level consolidation is not a signal of trend reversal; it may just be a phenomenon of inducing longs before a rate cut.
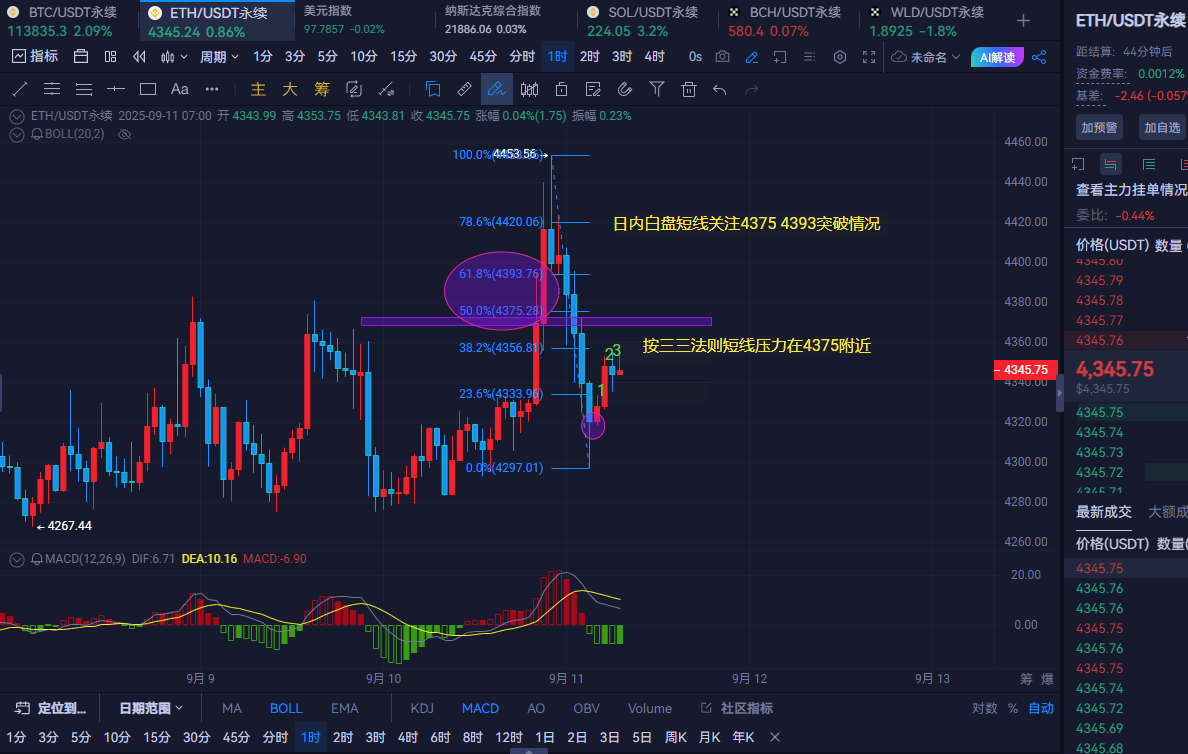
The daily chart of Ethereum shows that the recent price has been fluctuating within the range of 4300-4450. On September 10, a long upper shadow was formed, indicating heavy selling pressure above. The 1-hour chart shows that Ethereum's price has experienced multiple spikes followed by pullbacks, indicating some short-term rebound momentum, but the overall trend remains weak. The MACD is gradually converging, and the histogram has shrunk from green to red, indicating that the bearish strength is weakening but has not completely dissipated; the daily level is still below the zero axis, so attention should be paid to whether there will be further volume increase. During the day, short-term resistance is focused around 4375 and 4393.
Trading Suggestions: Buy on dips around 112100-112600, with a stop loss at 111600, targeting around 113500-114000. If broken, look for 114600-115000; if not broken, consider shorting.
Ethereum Trading Suggestions: Short around 4375-4395, with a stop loss at 4420, targeting around 4335-4305. If broken, look for 4270-4250; if not broken, consider going long.
This strategy is for reference only; please invest cautiously and secure profits. (Follow Dan on WeChat: Ethereum Kai)
免责声明:本文章仅代表作者个人观点,不代表本平台的立场和观点。本文章仅供信息分享,不构成对任何人的任何投资建议。用户与作者之间的任何争议,与本平台无关。如网页中刊载的文章或图片涉及侵权,请提供相关的权利证明和身份证明发送邮件到support@aicoin.com,本平台相关工作人员将会进行核查。


