Master Discusses Hot Topics:
Oh, speaking of it, Chuanzi and the Federal Reserve are still at odds, with Chuanzi insisting on a quick interest rate cut. He just wants to give the market a thrill, but the Fed is still being dovish. They keep talking about stable inflation and economic resilience, a bunch of nonsense.
JPMorgan has pointed out directly that even if there is a rate cut in September, it might just be a case of good news already priced in. The key is to keep an eye on the dot plot, as that is the real roadmap for the future.
If they can really cut by 75 basis points this year and then another 200 basis points in 2026, the market will definitely be overjoyed. But if they only make a symbolic cut of a few basis points, the market will turn on a dime, and pessimism will be rampant.
To put it simply, the current focus is not on the labor market; that suspense is long gone. As I analyzed yesterday, the real big news is this week's PPI and CPI data. Even if inflation rises in the short term, the market believes the economy can't hold on much longer, and the Fed must cut rates.
But what if they really come out in September and don’t cut rates? Wow, that scene would be absolutely spectacular. Just imagine Chuanzi's face getting all twisted in anger; he might just flip the table. Thinking about this makes me laugh; if they stubbornly refuse to cut, can you imagine what that would look like?
Back to the market, these past two weeks have indeed been incredibly boring. The market is lifeless, and I can't even find an opportunity to write something. But today I still have to mention that Bitcoin has already tried to break into the supply zone from 112.6K to 113.4K for the third time on the 4-hour chart.
The first two attempts failed, but interestingly, the pullbacks have been soft, not breaking lower lows, which is actually a positive signal. Last night it tried again, but still got stuck.
The key is that this time it didn’t even make a new high on the smaller time frames, which puts tonight's focus on whether it can break through the 112.6K to 113.4K barrier.
If it can break through directly, it would mean a breakthrough on the smaller time frames, and it would firmly establish the midline of the channel. The next targets would be clear: first look at 114.7K, and then it could even reach the supply zone around 116.5K to 117.5K.
The optimistic part now is that Bitcoin is spending more and more time above the midline, indicating that the channel might slowly flatten out. A flattened channel could lead to a real rebound.
But the pessimistic part is that while the price isn’t dropping, it’s just barely holding on, not breaking through any significant supply zones. This indicates that bullish funds haven’t entered, and the bearish positions haven’t been fully consumed; the tug-of-war continues.
I believe that Bitcoin will likely show a weaker rebound in these two weeks, and after the rate cut happens, I will probably turn bearish. Unless the data and attitude are extremely favorable, otherwise, the market is going to collapse emotionally.
Looking at Ethereum, it’s still dragging around 4300, lingering in the 4250 to 4300 range for two and a half days, and last night it was kicked down after a spike. If it can hold 4250 this afternoon, it’s still leaning bullish in the short term.
After all, the range of fluctuations is getting smaller and smaller, and a change is imminent. The key levels are 4350 to 4380; as long as it can close above, it will immediately turn strong. Otherwise, it will have to pull back to 4250, and in an extreme case, it might even sweep below 4100.
Master Looks at Trends:
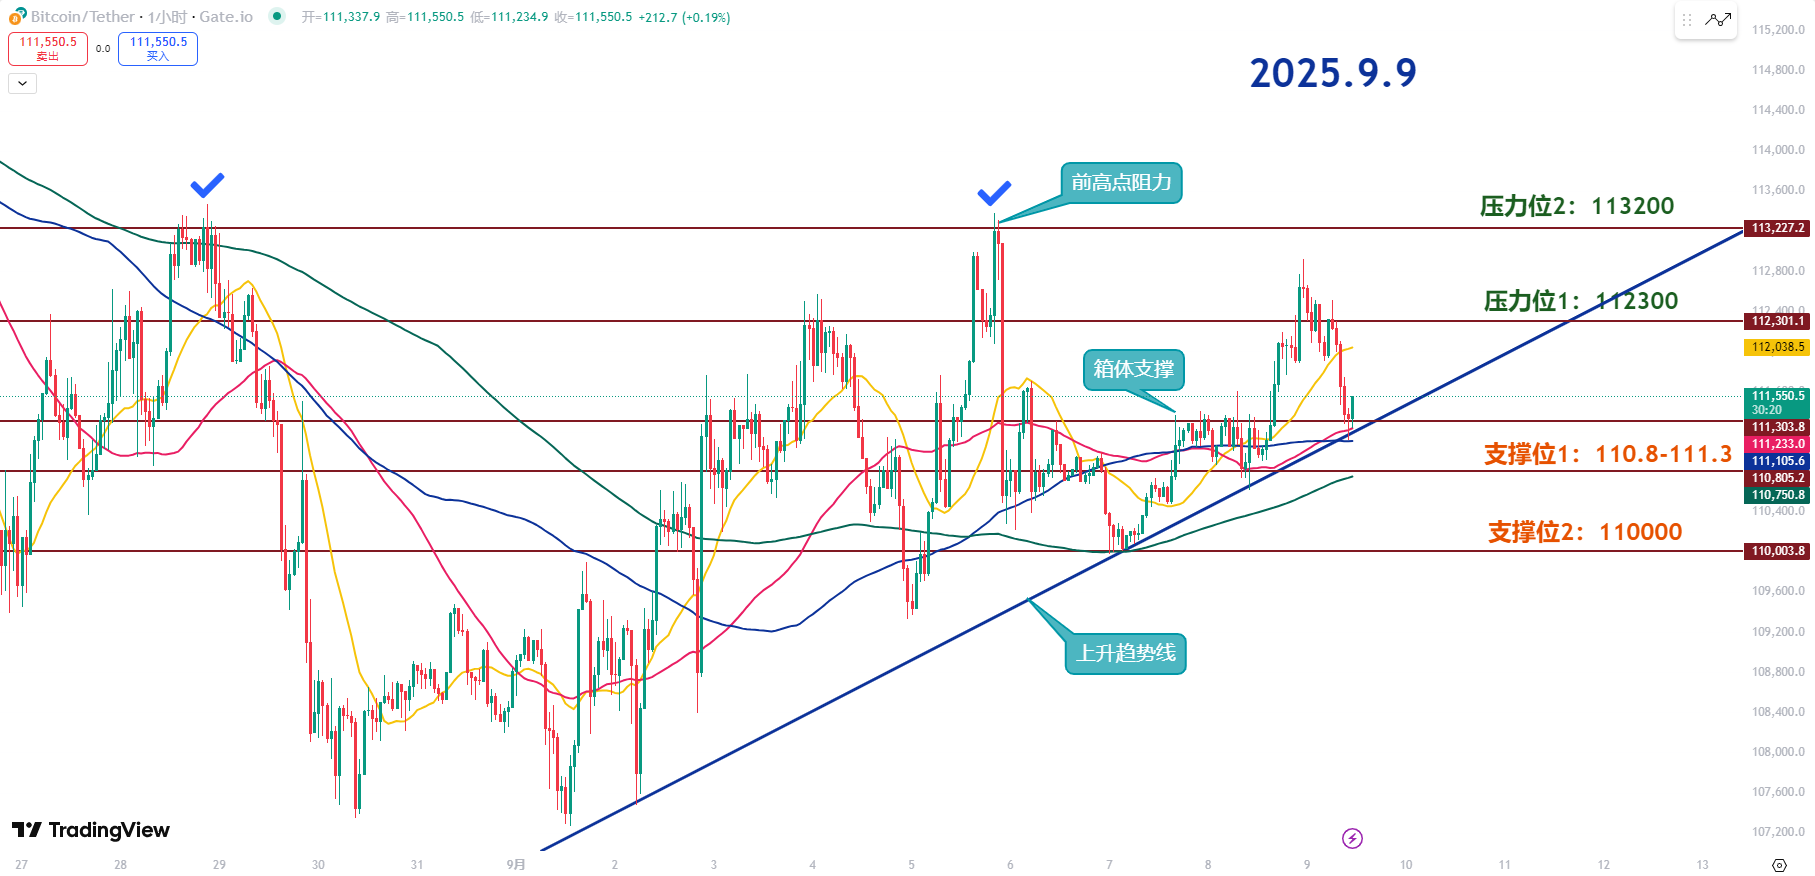
Resistance Levels Reference:
Second Resistance Level: 113200
First Resistance Level: 112300
Support Levels Reference:
First Support Level: 110.8-111.3
Second Support Level: 110000
The short-term support zone for Bitcoin is in the 110.8K to 111.3K range, which acts as a box support level. There’s also an upward trend line below, and pay attention to the 200-day moving average on the 1-hour chart, which is around 112K.
If it rebounds to around 112K, be careful as it might get pushed back down again. So we need to see if it can gradually raise the lows; otherwise, it’s still a pile of crap in the short term.
If it can’t hold the upward trend line and loses the 200-day moving average, then don’t hesitate to look down at 110K; the big pit below could open up at any moment. Before the CPI and PPI results come out, the market won’t establish a direction. It’s just a repeated tug-of-war and bouncing around; don’t get washed out.
The first resistance is at 112.3K, where it previously failed to rebound, and it was also the high point before September 4. So for now, don’t think about a V-shaped reversal; only if it can hold the trend line will there be a next step.
The second resistance is at 113.2; with the current weak momentum, whether it can raise the lows is key. Even if it reaches 113K, it will depend on tonight’s external news for support; otherwise, it’s unlikely in the short term.
The first support is at 110.8–111.3K, which is the short-term bottom formed after grinding over the weekend. If it breaks again, disappointment will flood in, and it could drop even harder; at that point, we can only see if the 200-day moving average can hold.
The second support is at 110K, which is purely a psychological level. It has held once before, but if it breaks again, it could lead to an accelerated drop. If both the upward trend line and the 200-day moving average break together, a sharp drop in the short term is inevitable.
Today’s market is about watching more and moving less; yesterday it looked like it was going to rise, but it still couldn’t hold and fell down. Now is the time to flexibly switch between long and short positions; don’t hold on stubbornly. The market isn’t giving opportunities for medium to long-term positions; holding on stubbornly is just asking for trouble.
9.9 Master’s Wave Strategy:
Long Entry Reference: Buy in batches in the 110800-111300 range, Target: 112300-113200
Short Entry Reference: Not applicable for now
If you truly want to learn something from a blogger, you need to keep following them, not just make hasty conclusions after a few market observations. This market is filled with performers; today they screenshot long positions, and tomorrow they summarize short positions, making it seem like they "catch the top and bottom every time," but in reality, it’s all hindsight. A truly worthy blogger will have a trading logic that is consistent, coherent, and withstands scrutiny, rather than jumping in only when the market moves. Don’t be blinded by flashy data and out-of-context screenshots; long-term observation and deep understanding are needed to discern who is a thinker and who is a dreamer!
This article is exclusively planned and published by Master Chen (WeChat public account: Coin God Master Chen). If you want to learn more about real-time investment strategies, solutions, spot trading, short, medium, and long-term contract trading techniques, operational skills, and knowledge about candlesticks, you can join Master Chen for learning and communication. A free experience group for fans has been opened, along with community live broadcasts and other quality experience projects!

Warm reminder: This article is only written by Master Chen on the official public account (as shown above), and any other advertisements at the end of the article or in the comments are unrelated to the author!! Please be cautious in distinguishing between true and false, thank you for reading.
免责声明:本文章仅代表作者个人观点,不代表本平台的立场和观点。本文章仅供信息分享,不构成对任何人的任何投资建议。用户与作者之间的任何争议,与本平台无关。如网页中刊载的文章或图片涉及侵权,请提供相关的权利证明和身份证明发送邮件到support@aicoin.com,本平台相关工作人员将会进行核查。


