Original Author: Luca
Original Compilation: Tim, PANews
Surge Peak → Decline → Roaring Twenties
Note: The Roaring Twenties refers to the social and cultural development phenomenon in Europe and America during the 1920s, especially in music and popular culture.
Market Outlook for the Coming Months
First, allow me to introduce my past.
August 5, 2024, September 2024, April 2025—these moments of sharp declines tested my faith, but I continue to accumulate chips in anticipation of higher prices.
Why? Because I know this bull market will ultimately end with a massive "blow-off top," a peak that will create FOMO among everyone before the actual peak arrives.
My entire analytical framework is built around emotional reversals, shifting rapidly from uncertainty and anxiety to extreme excitement.
Crypto market makers are well aware of how to exploit retail emotions.
The high volatility brought by rising prices, combined with a bullish narrative, will boost market confidence, expand risk appetite, and ultimately create frenzy.
I believe this is precisely how market makers will distribute chips in the bullish environment over the coming weeks and even months.
A clear example of market makers viewing retail investors as counterparties can be traced back to early 2025.
At that time, we tracked liquidity traps through on-chain data and price trends, with many signs indicating that market makers were preparing for a larger market movement.
While most people thought this wave of the market had ended, our analysis suggested it was merely the beginning.
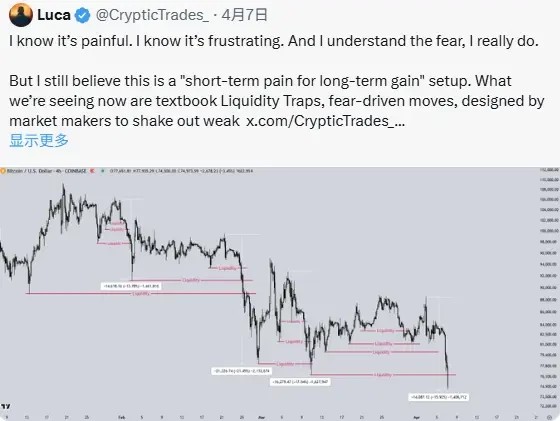
At that time, I publicly stated that my cash position was the lowest since the bear market low in 2022, as I believed it was an excellent buying opportunity, and the facts proved me right.
Then, BTC and the entire market bottomed out. You might think that liquidity traps and market manipulation should have disappeared, right?
But this time, BTC's reversal was quite unusual; the price did not show any substantial pullback but surged almost linearly from early April to the end of May, heading straight for historical highs.
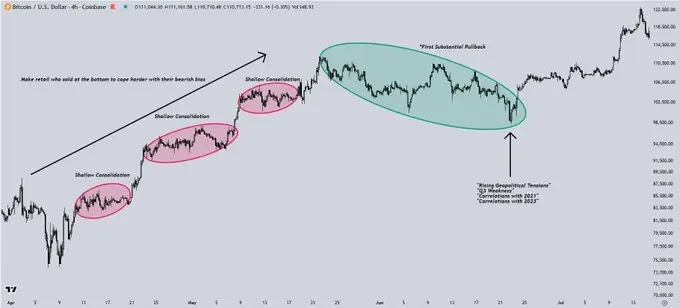
Along the way, we only saw simple signs of a shakeout. This market behavior had one purpose: to induce FOMO among those who sold at the bottom and to seek opportunities to re-enter the market.
Every brief pause on the K-line was seen as a "resistance test."
When the first comprehensive pullback finally arrived, most market participants had already settled into a bearish mindset, actively seeking confirmation.
Sure enough, "certainty" messages arrived:
- Escalating geopolitical tensions
- Weak patterns in the third quarter
- Similar trends to 2021
- Similar trends to 2023
This led many to believe that the market was about to enter a prolonged consolidation phase, prompting them to hedge before a new round of peaks and historical highs.
"Okay, Luca, but what does all this have to do with anything?" you might ask.
Well, I think we need to understand how we arrived at the current situation to grasp the upcoming trends. The market gradually reveals its patterns over a long period, and everything we have experienced to get to today is the main basis for predicting future directions.
I believe all these liquidity traps, consolidation phases, and bearish sentiments have played and will continue to play a crucial role, collectively contributing to and ultimately driving us into the emotional reversal at the cycle top.
To reiterate, if the emotional reversal is a rapid shift from uncertainty to full-blown frenzy, then market makers must first create the opposite conditions.
They need to lead most people into bearishness and panic in a low liquidity environment before pushing prices higher, which ultimately lays the groundwork for chip distribution.
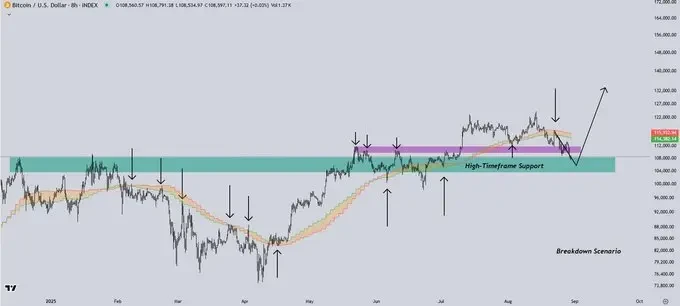
Now, what should we expect next?
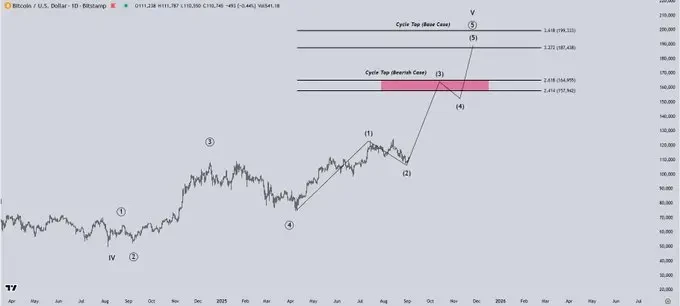
From a technical perspective, I believe the most likely scenario for BTC in the coming days is that the price will find a bottom between the highs of November and December 2024, a range that skews the risk-reward ratio in favor of buyers in the short to medium term.
According to my strategy, I have gradually reallocated funds from Bitcoin, along with funds from overvalued altcoins, back into altcoins.
From a narrative and emotional standpoint, these are always factors I like to consider, and this analysis is actually quite reasonable.
It convinces the market that a significant pullback is imminent, and the "weak September" pattern further reinforces this expectation; I anticipate this narrative will dominate market sentiment in the coming days.
This situation may prompt many traders to hedge or short before the next significant rebound, which is why the current market structure makes so much sense to me and why I remain optimistic in the medium term.
"Okay, Luca, I understand the concept of 'emotional reversal'; it essentially refers to price fluctuations triggering emotional polarization and triggering reversals, but how does this affect the distribution phase and cycle top?" you might wonder.
This is where the certainty bias comes into play. Investors naturally seek narratives that support their arguments while ignoring contradictory evidence, especially when the market experiences volatility.
This is precisely what we saw from the bears in late June this year, who firmly believed that we were entering a long-term consolidation phase while ignoring two key realities: we are in a post-halving year, and the overall bullish market structure remains intact.
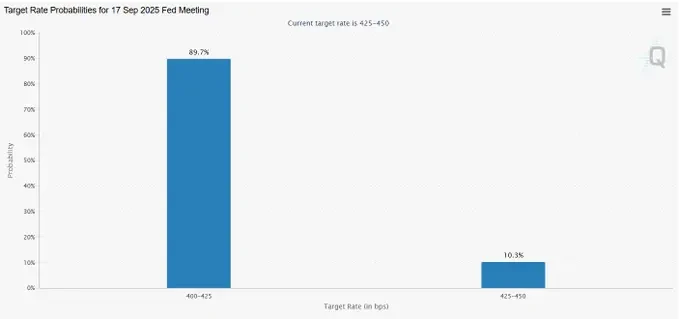
This is where macro policies come into play: the end of quantitative tightening, the shift towards interest rate cuts, and the possibility of a soft economic landing.
First, if we look at the FedWatch tool on CME, it currently shows a roughly 90% probability of a rate cut in September.
Looking back at the price trends of the S&P 500 index over the past 30 years, the pattern is clear: after the last three times the Federal Reserve stopped quantitative tightening and began cutting rates, economic recessions and massive market crashes followed.
This pattern has occurred 100% of the time in the past 30 years.
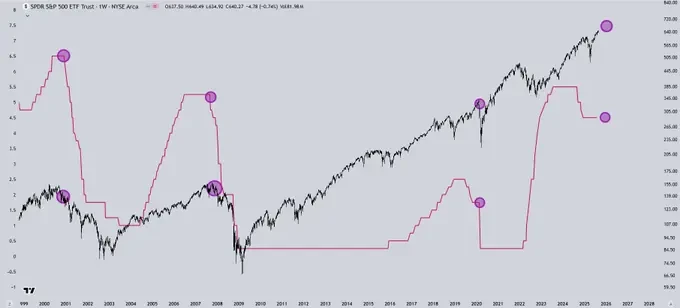
This is because the Federal Reserve never intervenes without reason; whether through rate hikes to curb runaway inflation or rate cuts to stimulate a weak economy, the Fed's intervention signifies one thing: the current economic trajectory is unsustainable and must change.
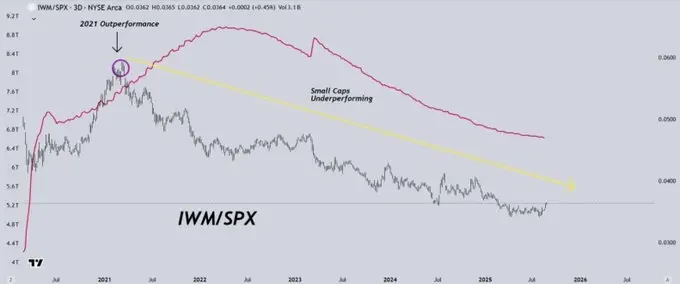
A very compelling chart is the IWM/SPX ratio.
This shows the performance of small-cap stocks relative to traditional S&P 500 stocks over the past few years, essentially reflecting the performance of risk assets compared to safer, more mature assets.
Since the Federal Reserve began tapering its quantitative easing policy in 2021, the IWM (Russell 2000 index) has consistently underperformed relative to the SPX (S&P 500 index). I believe there are reasonable reasons for this phenomenon, primarily influenced by two factors:
Small-cap stocks require low-cost capital:
- Their business models rely on aggressive expansion, which requires low-cost financing. Due to persistently high interest rates, the cost of capital remains expensive, forcing many companies to dilute equity to survive, and the price trends reflect this pressure.
Collapse of risk appetite:
- Most small-cap stocks are still in early stages or unable to sustain profitability. In a high-interest and uncertain environment, investors have been reluctant to take on this risk exposure. They prefer the relative safety offered by large-cap and mega-cap tech stocks.
- This is why small-cap stocks have underperformed the S&P 500 index over the past few years.
But interestingly, I believe we are approaching a turning point.
- The Federal Reserve is preparing to exit quantitative tightening measures and gradually shift back to stimulating the economy.
- If this shift becomes a reality, it could serve as a macro catalyst to reverse the downtrend of small-cap stocks and truly drive funds back into risk assets.
The latest macroeconomic data also supports this environment, as well as the notion of a soft economic landing in the coming weeks and even months.
GDP grew by 3.3% year-on-year, while first-quarter data was revised down. Personal income increased by 0.4% month-on-month, and personal spending rose by 0.5%.
I believe these two numbers are key because they tell us how much "fuel" consumers have left.
Income growth indicates an increase in household income, while spending growth tells us how much money is actually flowing into the economy.
I believe the current economic balance looks healthy, with income growing and consumers still spending, supporting growth.
What does this mean for the traditional stock market and the S&P 500 index?
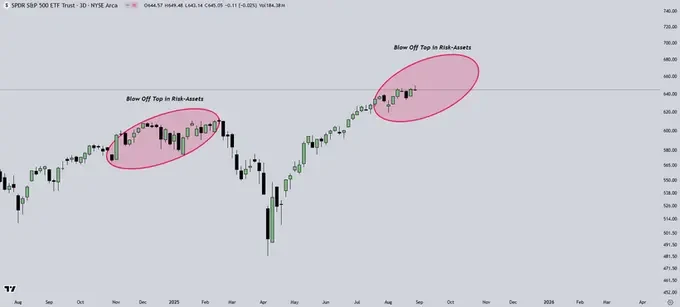
Looking back at October to December 2024, we witnessed a sell-off peak in risk assets, followed by distribution behavior that intensified the sell-off in early 2025.
I believe we are now preparing for a similar situation, only on a larger scale. The upcoming rate cuts, increasing risk appetite, and discussions about ending quantitative tightening and adding new liquidity are continuously driving buying.
In my view, this is not the beginning of a sustainable upward trend. Instead, it resembles another chip distribution phase, which I expect will ultimately give rise to a larger ultimate peak, after which the market will enter a bear market cycle.
That said, I still see upside potential in the medium term.
I believe that in the coming weeks, we will fully enter a risk-appetite-driven market environment. This is likely to push FOMO sentiment to its peak, creating the perfect opportunity for market makers to distribute chips.
It is worth noting that the chip distribution phase often occurs after a rise in risk appetite, which is typically driven by bullish sentiment. From a medium-term perspective, this dynamic will continue to support risk assets.
As I foresee market volatility and the recent influx of latecomers potentially being washed out, I have maintained a substantial cash position. Over the past few days, I have been gradually re-accumulating risk positions in preparation for the next round of upward movement.
For me, holding cash means having the decision-making power; when bearish resonance signals appear, I can reduce short-term downside risk through hedging; when favorable risk-reward allocation opportunities arise, I can adjust my portfolio in a timely manner.
At the same time, I am also preparing for another direction of the cycle. As we delve deeper into this phase, I plan to gradually shift from risk assets to more defensive sectors, such as consumer staples, healthcare, and government bonds. These sectors have underperformed as the market has been chasing growth and momentum.
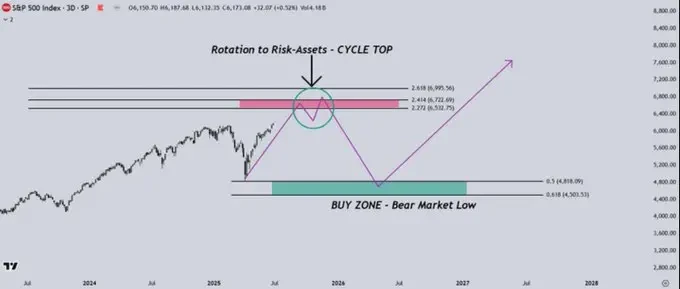
Looking ahead, I predict a target range for the S&P 500 index of about 6500 to 6700 points, after which the market will enter a prolonged distribution phase, and the economy will eventually slip into recession.
After that, I intend to diversify my portfolio until a significant market pullback occurs, allowing me to weather the bear market.
This will give me the opportunity to re-enter at lower levels and position for the next quantitative easing cycle, in which I believe stocks and high-risk assets will perform well again.
For BTC, my current base assumption is that the peak of this cycle will be around $190,000 before the bear market begins.
I also see another bearish scenario where Bitcoin peaks near $150,000.
There is also a bullish scenario, known as the "super cycle," but I am not considering that for now.
In my view, this narrative is more likely to emerge during the euphoric phase at the very top of the market rather than based on the current fundamental situation.
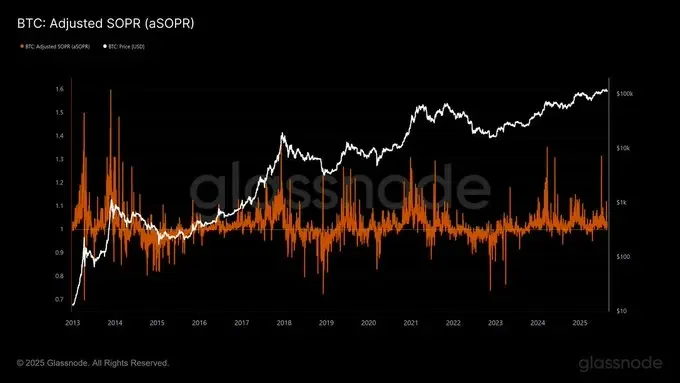
Observing a key GlassNode metric, the adjusted SOPR (aSOPR), which measures the amount of Bitcoin sold at a profit, I believe it can provide us with valuable insights into the phase of the cycle.
At previous cycle tops, we typically saw multiple spikes in this metric, which usually indicates significant distribution. So far, we have only seen one major spike.
One reason I believe altcoins will perform so well is that this situation typically occurs when Bitcoin is not in a full distribution phase.
The last time we saw aSOPR experience multiple sharp fluctuations was in March 2024, during the altcoin frenzy when many altcoins reached cycle highs.
I believe that once we see several such spikes again, the risk-reward structure will tilt more towards altcoins, signaling that Bitcoin and the entire crypto market are approaching the cycle top.
This will be a key indicator I will closely monitor.
So, where does the concept of the "Roaring Twenties" fit into all of this?
I believe the macroeconomic backdrop is crucial. We are heading towards a high-inflation environment, and the Federal Reserve is preparing to shift from quantitative tightening to quantitative easing.
This backdrop is strikingly similar to the 1920s, a decade characterized by runaway inflation and a surge in productivity driven by the industrial revolution.
Today, the driving force is the AI revolution.
As an entrepreneur, I can say: AI has indeed changed everything.
What once required teams of dozens can now be replaced by a small group of people who know how to maximize the use of AI.
From a historical perspective, leaps in productivity drive rapid economic growth. When combined with high inflation, cheap credit, and abundant liquidity, you can see the full picture.
The coming years will be astonishing for the stock market and other risk assets, but I also believe this will lead to the largest wealth disparity in history.
免责声明:本文章仅代表作者个人观点,不代表本平台的立场和观点。本文章仅供信息分享,不构成对任何人的任何投资建议。用户与作者之间的任何争议,与本平台无关。如网页中刊载的文章或图片涉及侵权,请提供相关的权利证明和身份证明发送邮件到support@aicoin.com,本平台相关工作人员将会进行核查。


