Let's first talk about what a grid is. Why is it also called a "magic tool that allows you to make money while lying down"?
In today's live stream recap, we will start from scratch to clarify the function and principles of grids.
Sharp-eyed friends may have noticed that today's title has a (Part 1) — the content is quite substantial, and we can't cover it all at once.
Moreover, this live stream will be discussed from the perspective of a beginner, so the explanations will be relatively simple and basic, and the content may not be that "exciting." If you are a seasoned veteran in the crypto space, you can choose to skim through this part. If I say something incorrect, I welcome guidance from the experts!
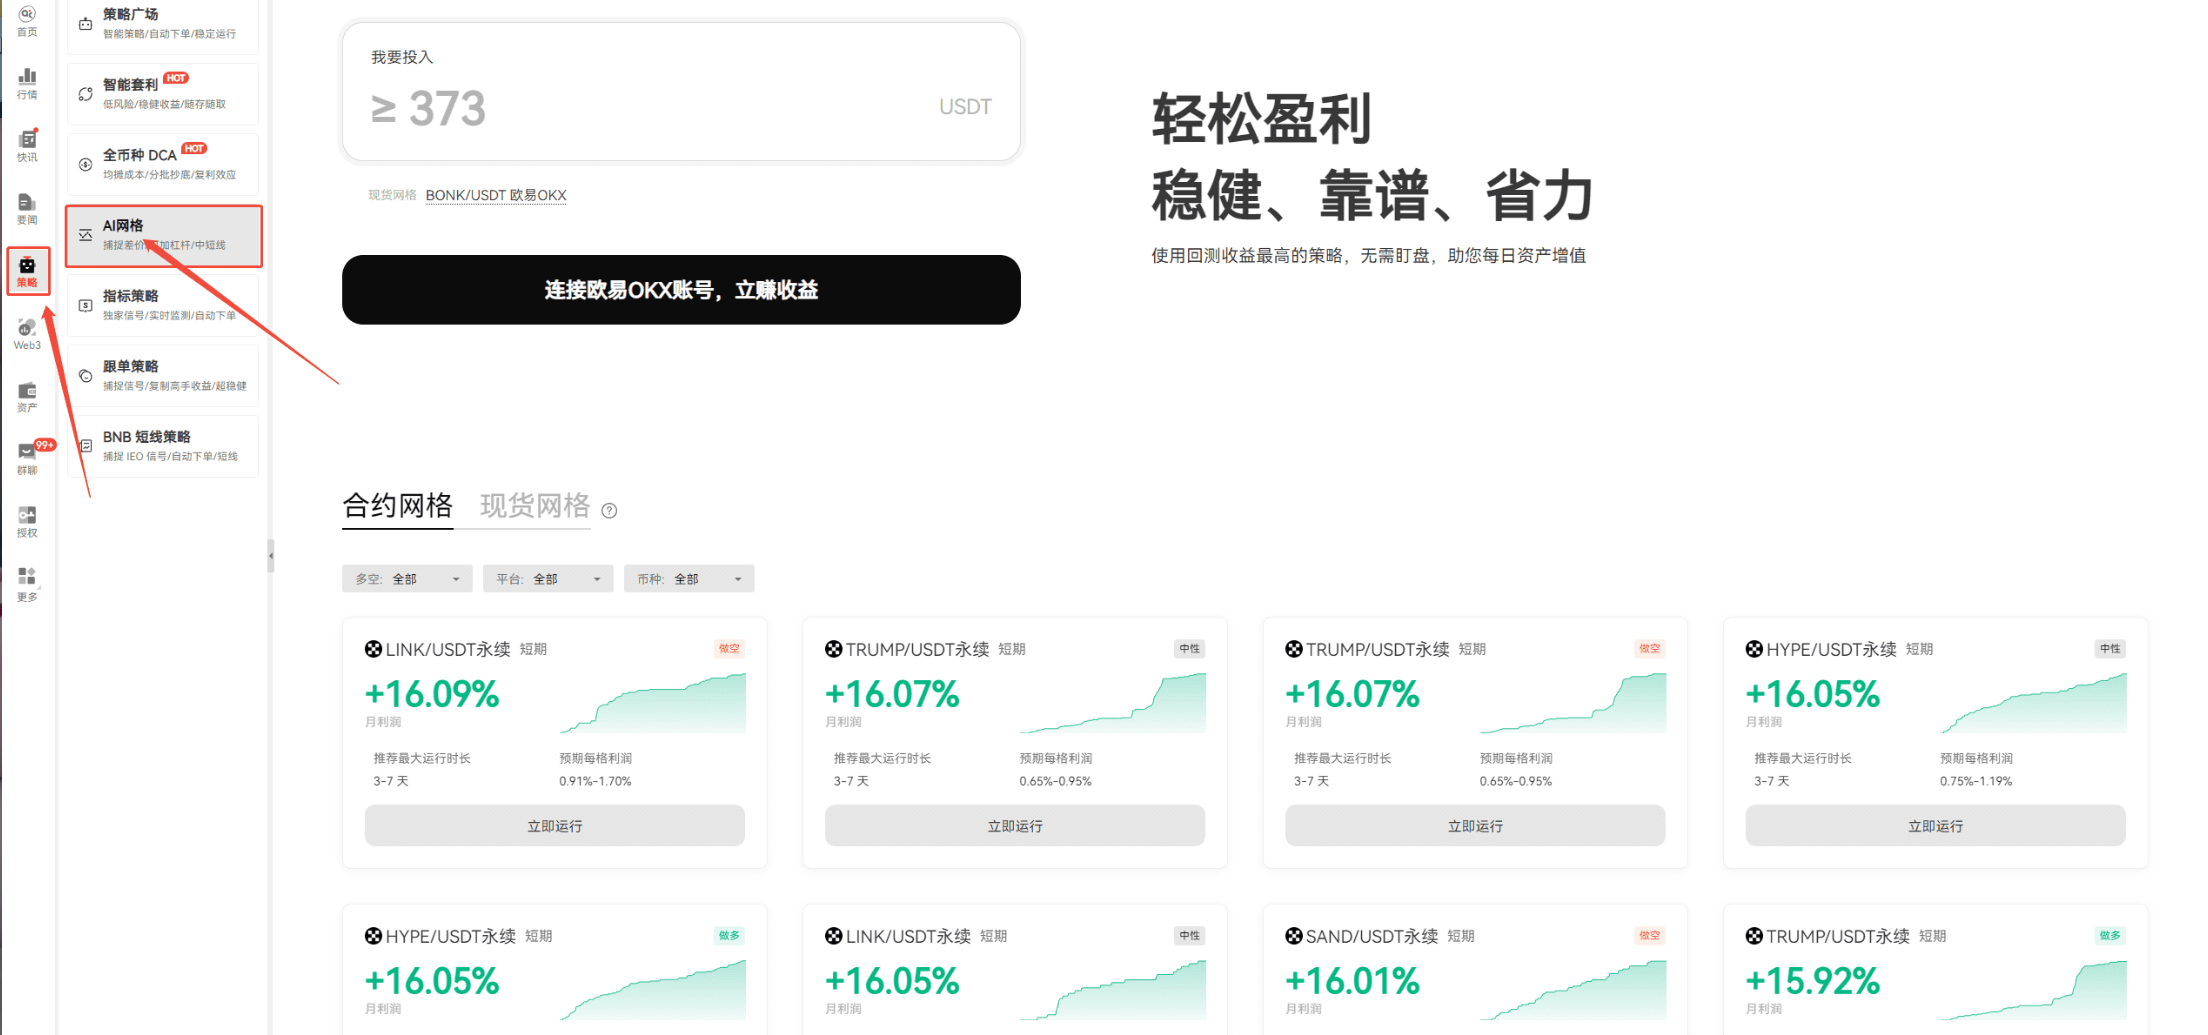
Let's first open AICoin and find "Strategy" in the left sidebar:
For example, let's say we have 10,000 USDT in capital, and the initial price is set at 30,000 USDT/BTC, which means we can hold approximately 0.3333 BTC.
Next, we set a 1% interval price, then determine our buy points (like 29,700, 29,970) and sell points (like 30,300, 31,000).
When the price drops to our set buy point, we automatically buy more assets; when it rises back to the sell point, we automatically sell a portion or all, and the profit is in hand.
With that explanation, do you understand? A grid is essentially a "trading robot" that helps us free our hands and capture every buying and selling opportunity without having to stare at the screen 24/7.
This is perfectly suited for the 24/7 fast-paced cryptocurrency world. This is the most basic grid trading method.
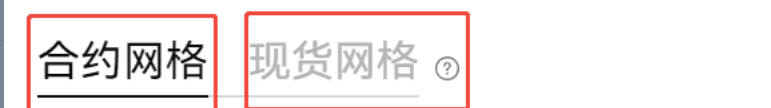
After discussing the principles, let's return to the product page, where we find options for "Contract Grid" and "Spot Grid." What do these two mean?
I have summarized a few points about their differences and how to choose, but this is not the focus of our live stream, so feel free to take a look when you have time:
The core differences between spot grids and contract grids mainly lie in the following aspects:
Different trading objects. Spot grids involve actual "physical trading"; if you buy 1 Bitcoin, you actually get 1 Bitcoin. Contract grids operate on a "long and short" model, somewhat like betting against the price of the coin using your chips (i.e., margin), predicting whether it will rise or fall (deciding to go long or short), and ultimately earning profits based on whether your prediction is correct.
Different capital efficiency. Spot grids require a significant amount of capital because each trade involves actually holding assets, which may not have high capital utilization; contract grids can leverage to amplify capital effects, allowing small amounts of money to control large contracts, but the risks also increase.
Different applicable markets. Spot grids are more suitable for high liquidity and relatively stable markets; contract grids are particularly suitable for 24-hour trading and leveraged derivative markets, such as perpetual contracts in cryptocurrency.
Different risk and return characteristics. Spot grids have relatively controllable risks and stable returns; contract grids may yield high returns, but high leverage can lead to greater volatility and increased risk.
Different levels of operational complexity. Spot grid strategies are simple and easy to grasp; contract grids involve a lot of financial tool knowledge, such as leverage and margin mechanisms, making them more complex to operate.
As for which strategy to choose, it also depends on our own investment style. If you are a conservative investor, spot grids are more suitable, with lower risk and no leverage threat; if you are more aggressive and want to pursue high returns, you can try contract grids, but be sure to be aware of the high risks involved.
The content is a bit long; if you feel you can't remember it all at once, feel free to pause and read slowly. Let's continue!
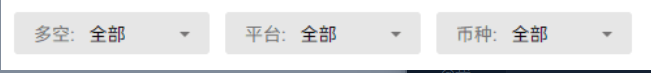
Here is a filter that allows you to select a suitable grid based on parameters like long and short strategies and coin types — in other words, choose a handy "trading robot":
Next, let's look at the differences between various grid strategies.
Let's take a random screenshot as an example:
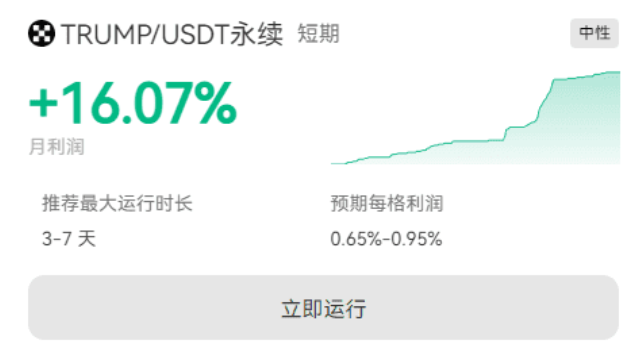
As usual, we will look from top to bottom, left to right:
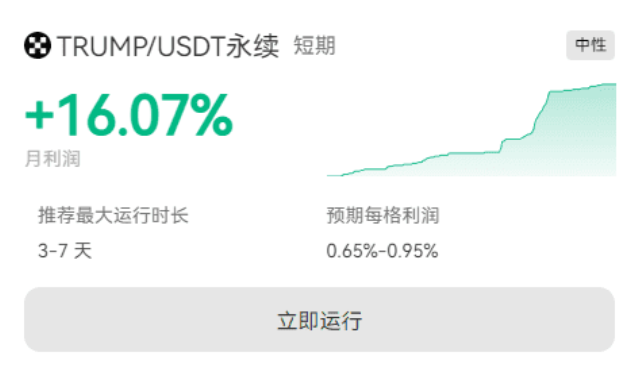
Here, "Neutral," "Long," and "Short" are three parallel options. Let's briefly discuss their differences:
First, "Long." This means we predict that the market price will rise, so we buy assets first and sell them when the price actually rises, earning the difference. This strategy is generally used when we are optimistic about the future potential of a certain asset, such as when we believe a project has good prospects or when the entire market is in a bull phase. However, it's important to mention the risk: if the price falls, we will incur losses, especially with leveraged trading, where losses can be magnified.
Next, let's talk about "Short." This is when we predict that the market price will fall, so we borrow assets to sell them, and when the price actually drops, we buy them back to return, earning profits this way. This strategy is usually employed when we are not optimistic about a certain asset's prospects, such as when a company's finances are in trouble or when the entire market is in a bear phase. However, this strategy carries significant risk; if the price rises, especially continuously, we could incur substantial losses; plus, shorting requires borrowing assets, which incurs additional costs.
Finally, "Neutral." This means neither leaning towards buying nor selling, typically using hedging strategies to balance market risks. It is generally used when the market trend is uncertain, helping to reduce risks from volatility, such as simultaneously buying and selling related assets or futures contracts. The advantage is that it can diversify risks, but it may also miss opportunities arising from rapid market changes. So here, "Neutral" essentially refers to a grid robot with a hedging strategy, or a strategy tool that can automatically hedge risks.
Next, we look at "Monthly Profit"
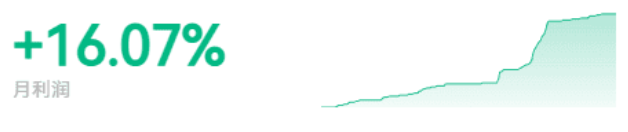
This indicates the potential earnings from this grid strategy. However, we must remember that investment always carries risks; the figures displayed on the page represent the past performance of this strategy, and it does not mean that we can achieve the same results just by using it. Ultimately, whether we can make money depends on factors like the chosen coin, entry timing, and set parameters.
Continuing down:
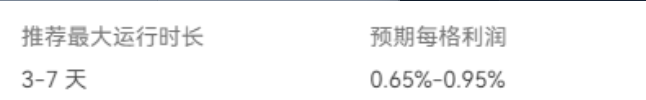
The "Recommended Maximum Running Time" here suggests how long we should let this robot "run" for us. Given the rapid changes in the crypto market, keeping it running for too long can lead to issues; most grids are designed for short-term fluctuations of a specific coin, and over time, the grid's operation may deviate, leading to less effective results.
Speaking of "Profit per Grid," this gives us a chance to explain why this automated robot is called a "grid."
The name "grid trading" actually comes from its graphical appearance. If we plot price and time axes on a coordinate system, the grid trading strategy will form a layout resembling a "grid" on the graph, and this strategy can be halted at any time.
Specifically, it involves setting multiple equidistant buy and sell points within a price range; these points resemble intersecting lines, coming together to form a "grid." It looks something like this:
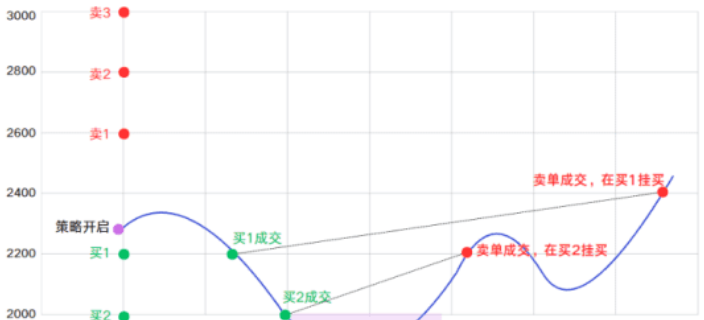
These intricate buy and sell points create individual "grid" intervals, which is where the name "grid" comes from.
Each interval can be viewed as a "grid"; for example, if you divide the price range into multiple intervals of 50 or 100 units, each interval is a "grid."
Thus, "Expected Profit per Grid" becomes easier to understand: after completing a buy and sell transaction within a "grid," the profit earned.
For instance, if you set the interval for each grid to be 50 units, when the price rises from 100 to 150 units, the profit for each transaction would be 50 units (not accounting for fees, etc.).
Did everyone understand that?
If you can grasp this point, you should have a clearer concept of "what exactly a grid is." We just discussed the "external" aspects of each grid strategy; now let's click on these grids and see how to choose a grid strategy that suits us.
Let's randomly click on a grid strategy:
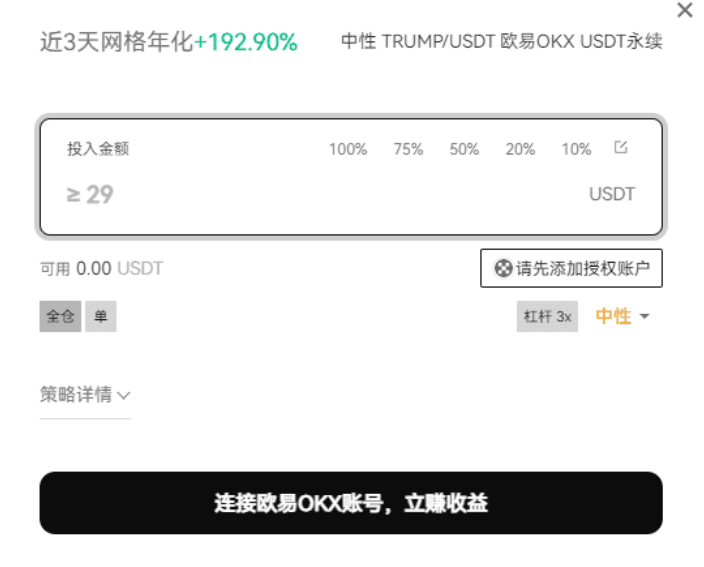
Again, we will look from top to bottom, left to right.
First is "Annualized Rate for the Last Three Days," which refers to the annualized rate. This term should be familiar to everyone, so let's briefly explain its meaning.
The annualized rate is a ratio that calculates interest rates, returns, etc., over a period of time, standardized to a year. It is mainly used to "normalize" data of different durations for easier comparison and analysis.
In simple terms, the annualized rate assumes that the returns or interest earned in the short term can continue for a whole year, and then it is converted into an annual percentage.
The calculation formula is: Annualized Rate = (Actual Return / Actual Time) × 365 days (or other benchmark periods).
This term is commonly seen in stocks, bonds, and funds; simply put, the higher the annualized rate, the more returns you can expect.
Next, looking at the "Investment Amount" section:
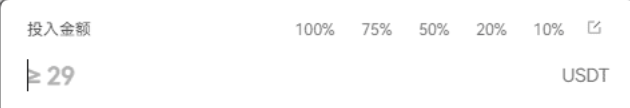
You will notice a prompt stating "Greater than or equal to 29."
This means that to activate this grid, you must invest at least 29 USDT. Why is there a minimum investment limit? Mainly because if each trade amount is too small, frequent buying and selling will accumulate increasing fees. Even if you earn a little money on each trade, high fees could lead to an overall loss.
Additionally, there may be "slippage risk," meaning that if the trading volume is too small, in certain market conditions, the actual execution price may differ significantly from the expected price, affecting returns and potentially "eating" into the profits.
Thus, the minimum investment of 29 USDT is set, but different grid strategies may have different minimum investment limits.
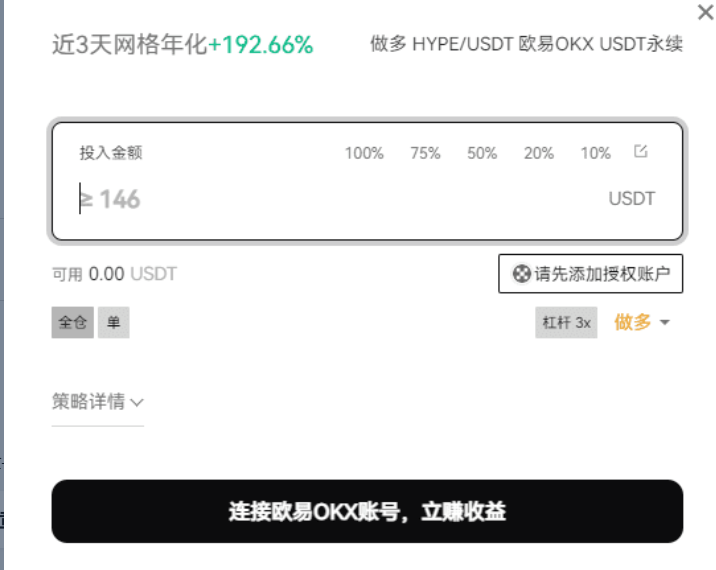
Now let's talk about "Leverage," which is a way to amplify investment amounts by borrowing funds. In simple terms, leverage allows traders to control larger positions (i.e., holdings) with a small amount of capital. Leverage is usually expressed as a multiple, such as 2x, 5x, or even more than 10x; you can even go for 50x if you want.
For example, if you have 1,000 dollars in capital and use 5x leverage, you can actually control a position of 5,000 dollars. Because leverage amplifies the scale of trading, the returns from market fluctuations will also be magnified; for instance, if the price of the underlying asset rises by 1%, your actual return could be 5% (due to the 5x leverage).
Conversely, losses will also be magnified. If the price drops by 1%, you could actually lose 5%. Therefore, as a beginner, it's best not to use too high leverage at the start.
Alright, finally, let's click on the "Strategy Details" below:
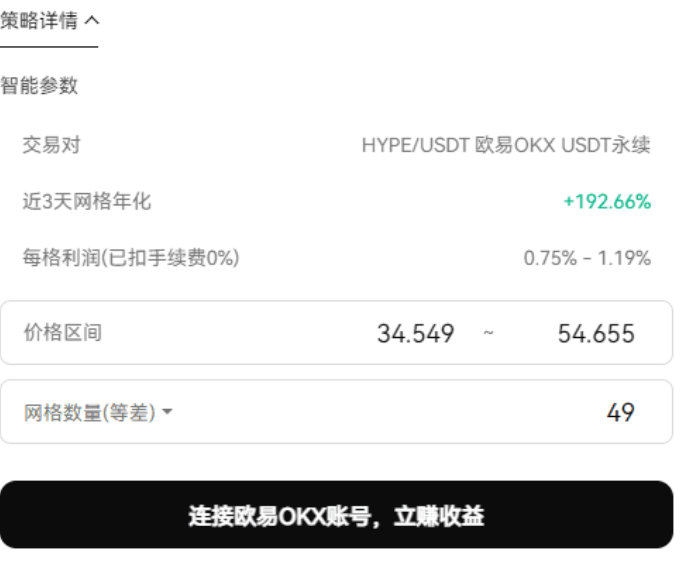
We will save the specifics on how to use grids, how to buy grids, and how to choose grids for our next live stream!
This article only represents the author's personal views and does not reflect the stance or views of this platform. This article is for informational sharing only and does not constitute any investment advice to anyone.
免责声明:本文章仅代表作者个人观点,不代表本平台的立场和观点。本文章仅供信息分享,不构成对任何人的任何投资建议。用户与作者之间的任何争议,与本平台无关。如网页中刊载的文章或图片涉及侵权,请提供相关的权利证明和身份证明发送邮件到support@aicoin.com,本平台相关工作人员将会进行核查。


