Original Authors: CryptoVizArt, UkuriaOC, Glassnode
Original Compilation: Chopper, Foresight News
Summary
- Bitcoin's current trading price is close to $112,000, consolidating within the range of $104,000 - $116,000. The Unspent Transaction Output Realized Price Distribution (URPD) indicates that investors have accumulated positions in the range of $108,000 - $116,000. This phenomenon reflects active buying on dips in the market, but does not rule out the possibility of further declines in the short to medium term.
- The price has fallen below the 0.95 percentile cost benchmark, marking the end of a 3.5-month frenzy phase and returning to the $104,000 - $114,000 range. Historically, this range often serves as a consolidation channel before the next clear trend forms.
- During the sell-off, the profit ratio of short-term holders (STH) plummeted from a high of over 90% to 42%, then rebounded to 60%. This rebound places the market in a neutral but fragile state. A confirmation of a renewed upward trend can only occur if the price recovers the $114,000 - $116,000 range.
- Off-chain sentiment is cooling: the futures funding rate remains neutral but is susceptible to shocks, and ETF inflows have significantly slowed. Bitcoin ETF inflows mainly reflect directional spot demand, while Ethereum ETF inflows are a mix of spot demand and "spot-futures arbitrage."
Consolidation Phase: Accumulation Behavior in the Blank Range
Since reaching an all-time high in mid-August, Bitcoin has entered a volatile downward trend, rebounding to around $112,000 after dropping to $108,000. As volatility increases, the core question arises: is this the beginning of a true bear market, or merely a short-term pullback? We will analyze this through both on-chain and off-chain indicators.
The Unspent Transaction Output Realized Price Distribution (URPD) serves as an important analytical starting point, showing the generation price of current Bitcoin unspent transaction outputs (UTXO), thus providing insight into investors' cost accumulation ranges.
Comparing the snapshot from August 13 to the current structure, it is evident that investors have taken advantage of the pullback to accumulate positions in the "blank range" of $108,000 - $116,000. This "buying on dips" behavior is positive for the long-term trend but does not eliminate the risk of further short to medium-term pullbacks.
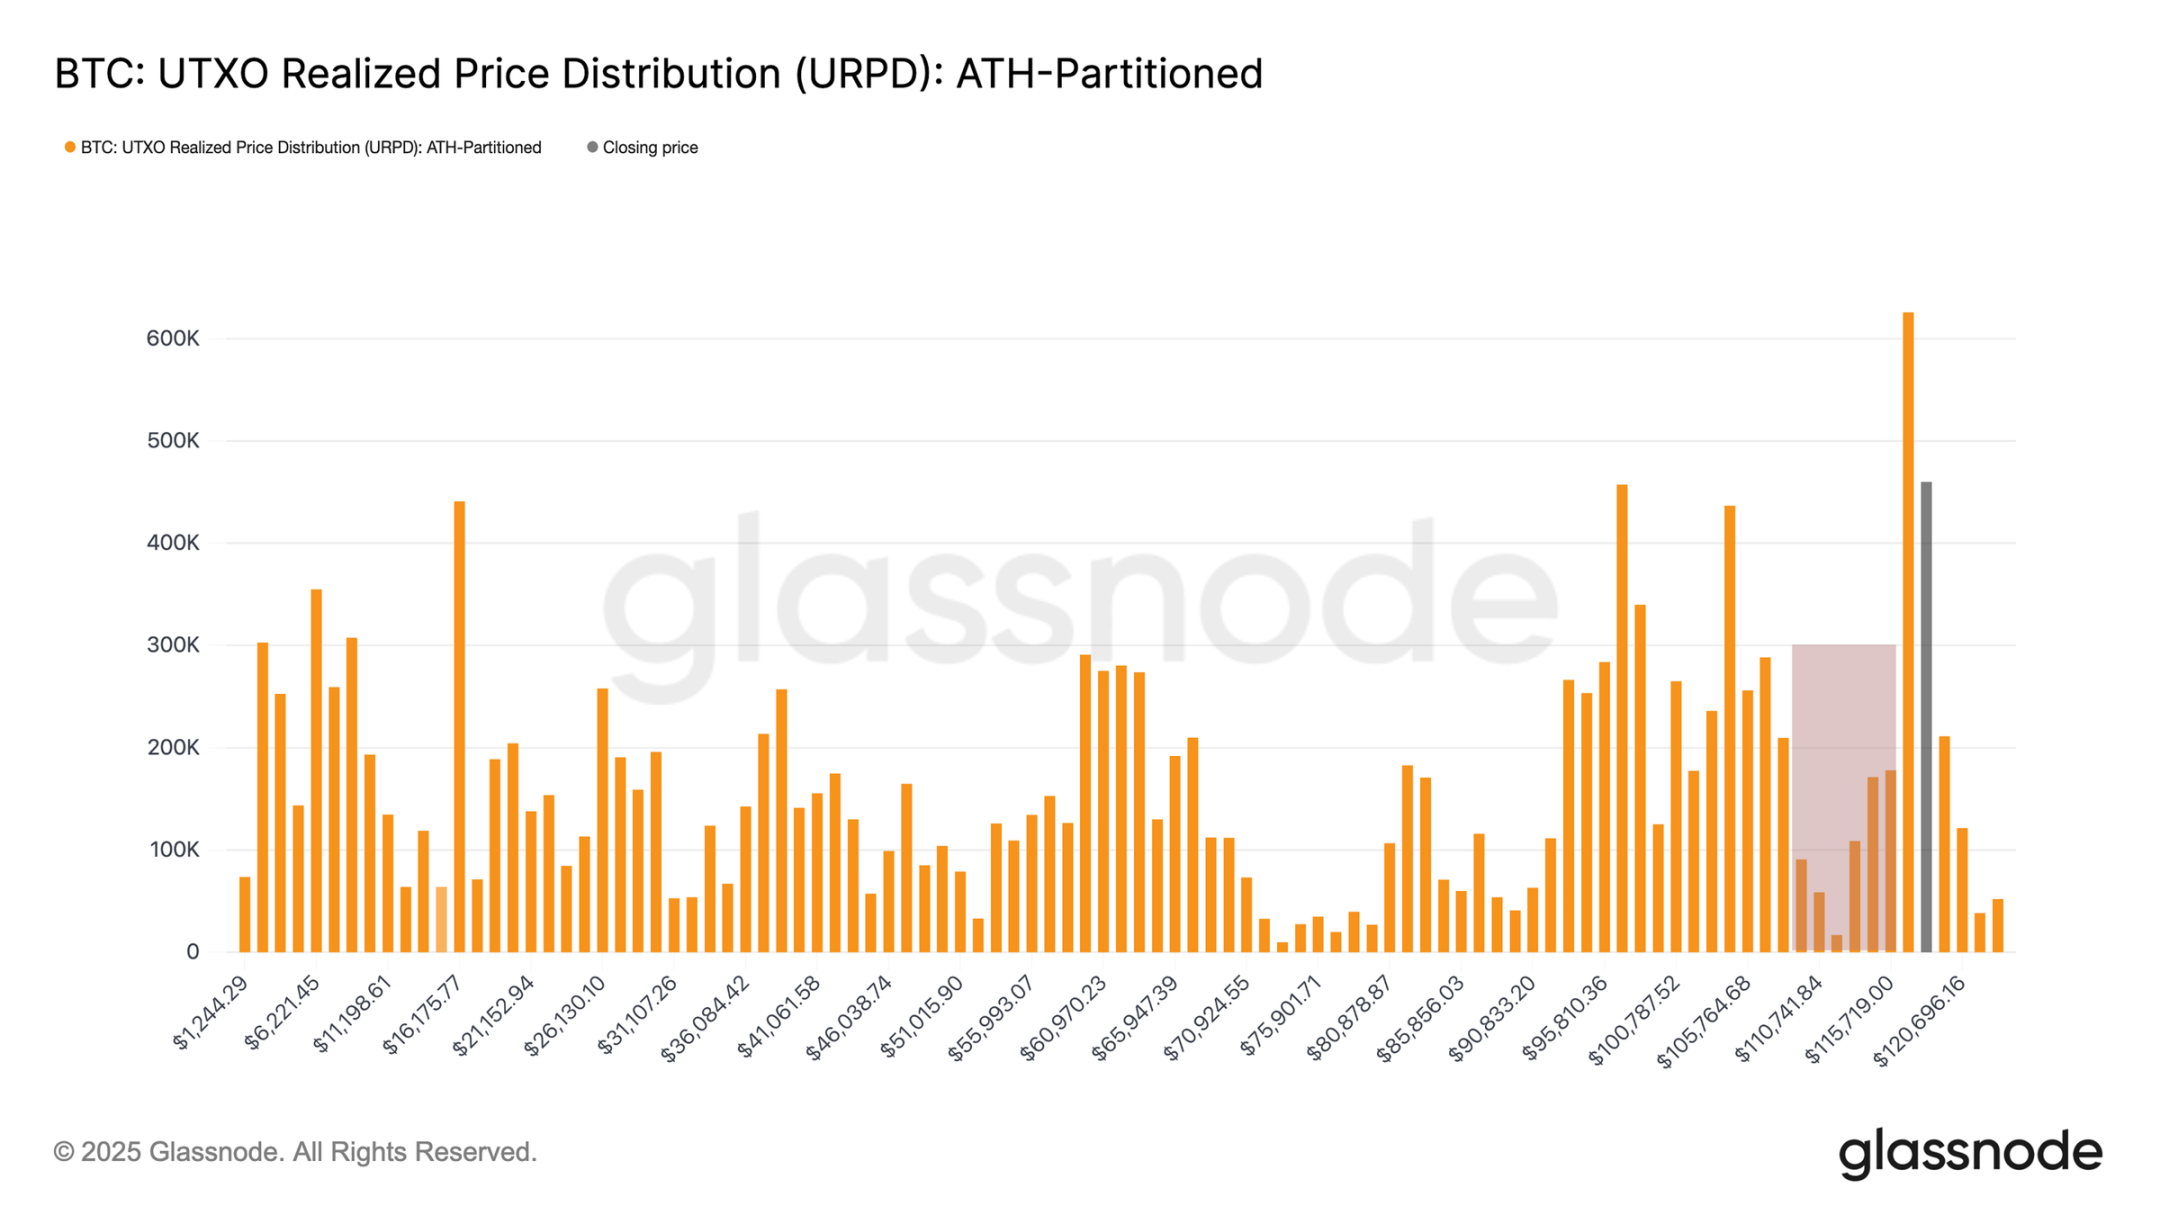

UTXO Realized Price Distribution Chart
From Frenzy to Exhaustion: Transitioning Between Cycle Phases
Although the URPD reflects positive buying on dips, the possibility of continued market weakness must be analyzed in the context of a broader cycle. The new high in mid-August marked the third prolonged frenzy phase of this cycle, characterized by strong price momentum pushing the majority of positions into profit. Maintaining such a phase requires a continuous influx of capital to offset ongoing profit-taking pressure, which is often difficult to sustain in the long term.
The 0.95 percentile cost benchmark (the price threshold at which 95% of positions are in profit) captures this trend. After approximately 3.5 months of the recent frenzy phase, demand has shown signs of exhaustion, with Bitcoin falling below this benchmark on August 19.
Currently, the price fluctuates between the 0.85-0.95 percentile cost benchmark, specifically in the $104,100 - $114,300 range. Historically, this range serves as a consolidation channel following the peak of a frenzy, typically forming a sideways trading pattern. Therefore:
- A drop below $104,100 may repeat the "exhaustion after a new all-time high" pattern seen in this cycle;
- A recovery above $114,300 would indicate stabilized demand, allowing the market to regain trend dominance.
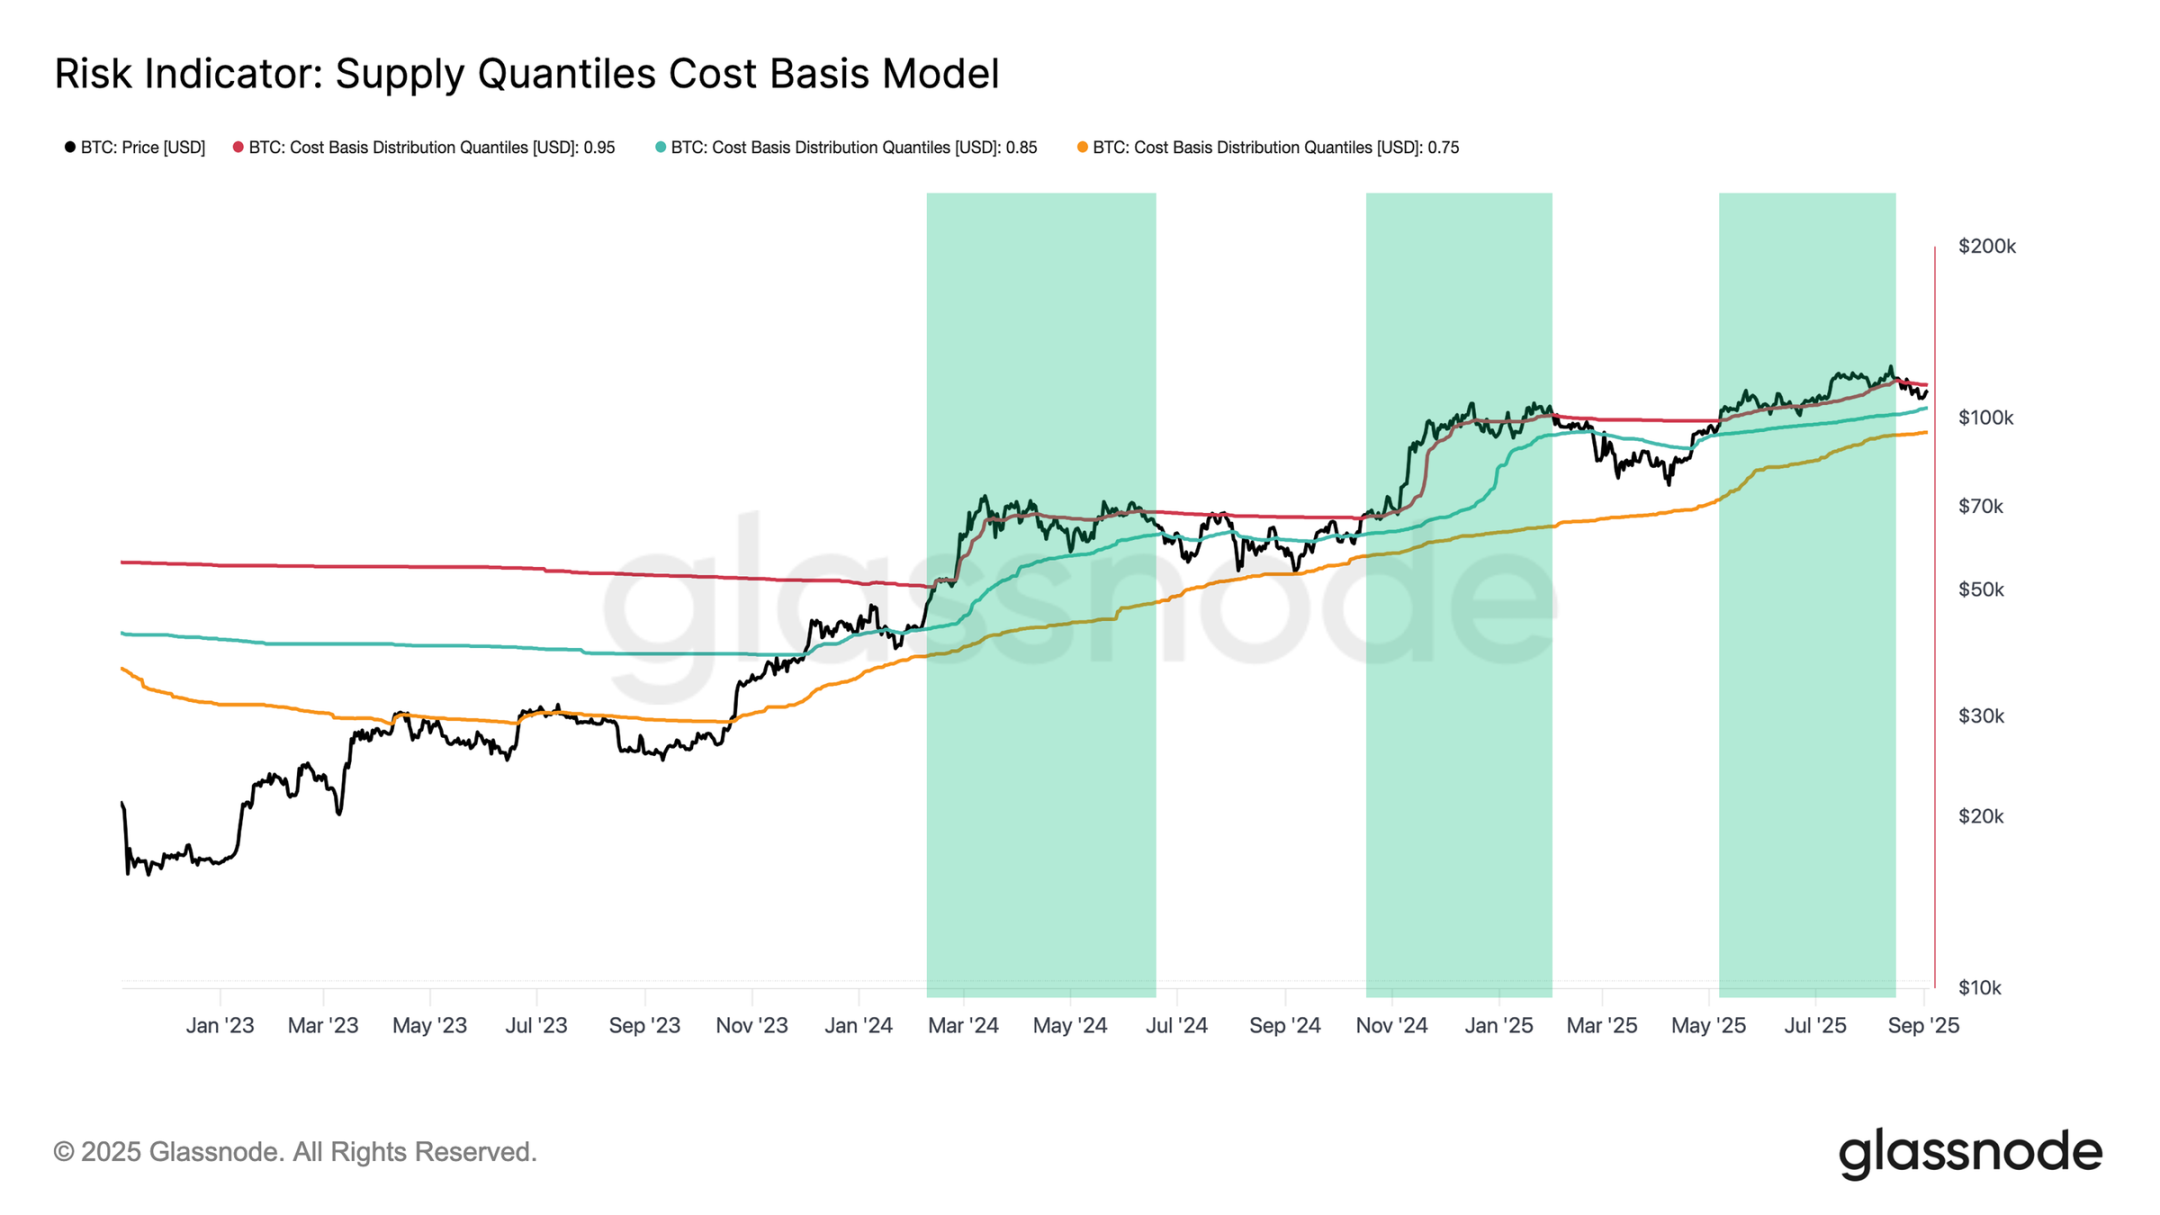
Chip Percentile Cost Benchmark Risk Indicator Chart
Short-Term Holders Under Pressure: A Barometer of Market Sentiment
Given that Bitcoin is currently in a critical range, the behavior of recent buyers is crucial. The unrealized profit and loss of short-term holders often serves as a core psychological factor influencing local tops and bottoms, with sudden shifts in profit and loss status directly affecting their trading decisions.
The profit ratio of short-term holders is a clear indicator to observe this dynamic. As the price dropped to $108,000, the profit ratio fell sharply from over 90% to 42%, marking a typical cooling process from "overheated" to "pressure." Such a sharp reversal often triggers panic selling among high-position buyers, and once the selling exhausts, it can drive a price rebound, which explains the recent rise from $108,000 to $112,000.
At the current price, the profit ratio of short-term holders has rebounded to over 60%, which is neutral compared to the extreme levels of recent weeks, but this rebound remains very fragile. Only when the price consistently recovers the $114,000 - $116,000 range (at which point over 75% of short-term holders' positions will return to profit) can sufficient confidence be established to attract new capital and drive the next upward movement.
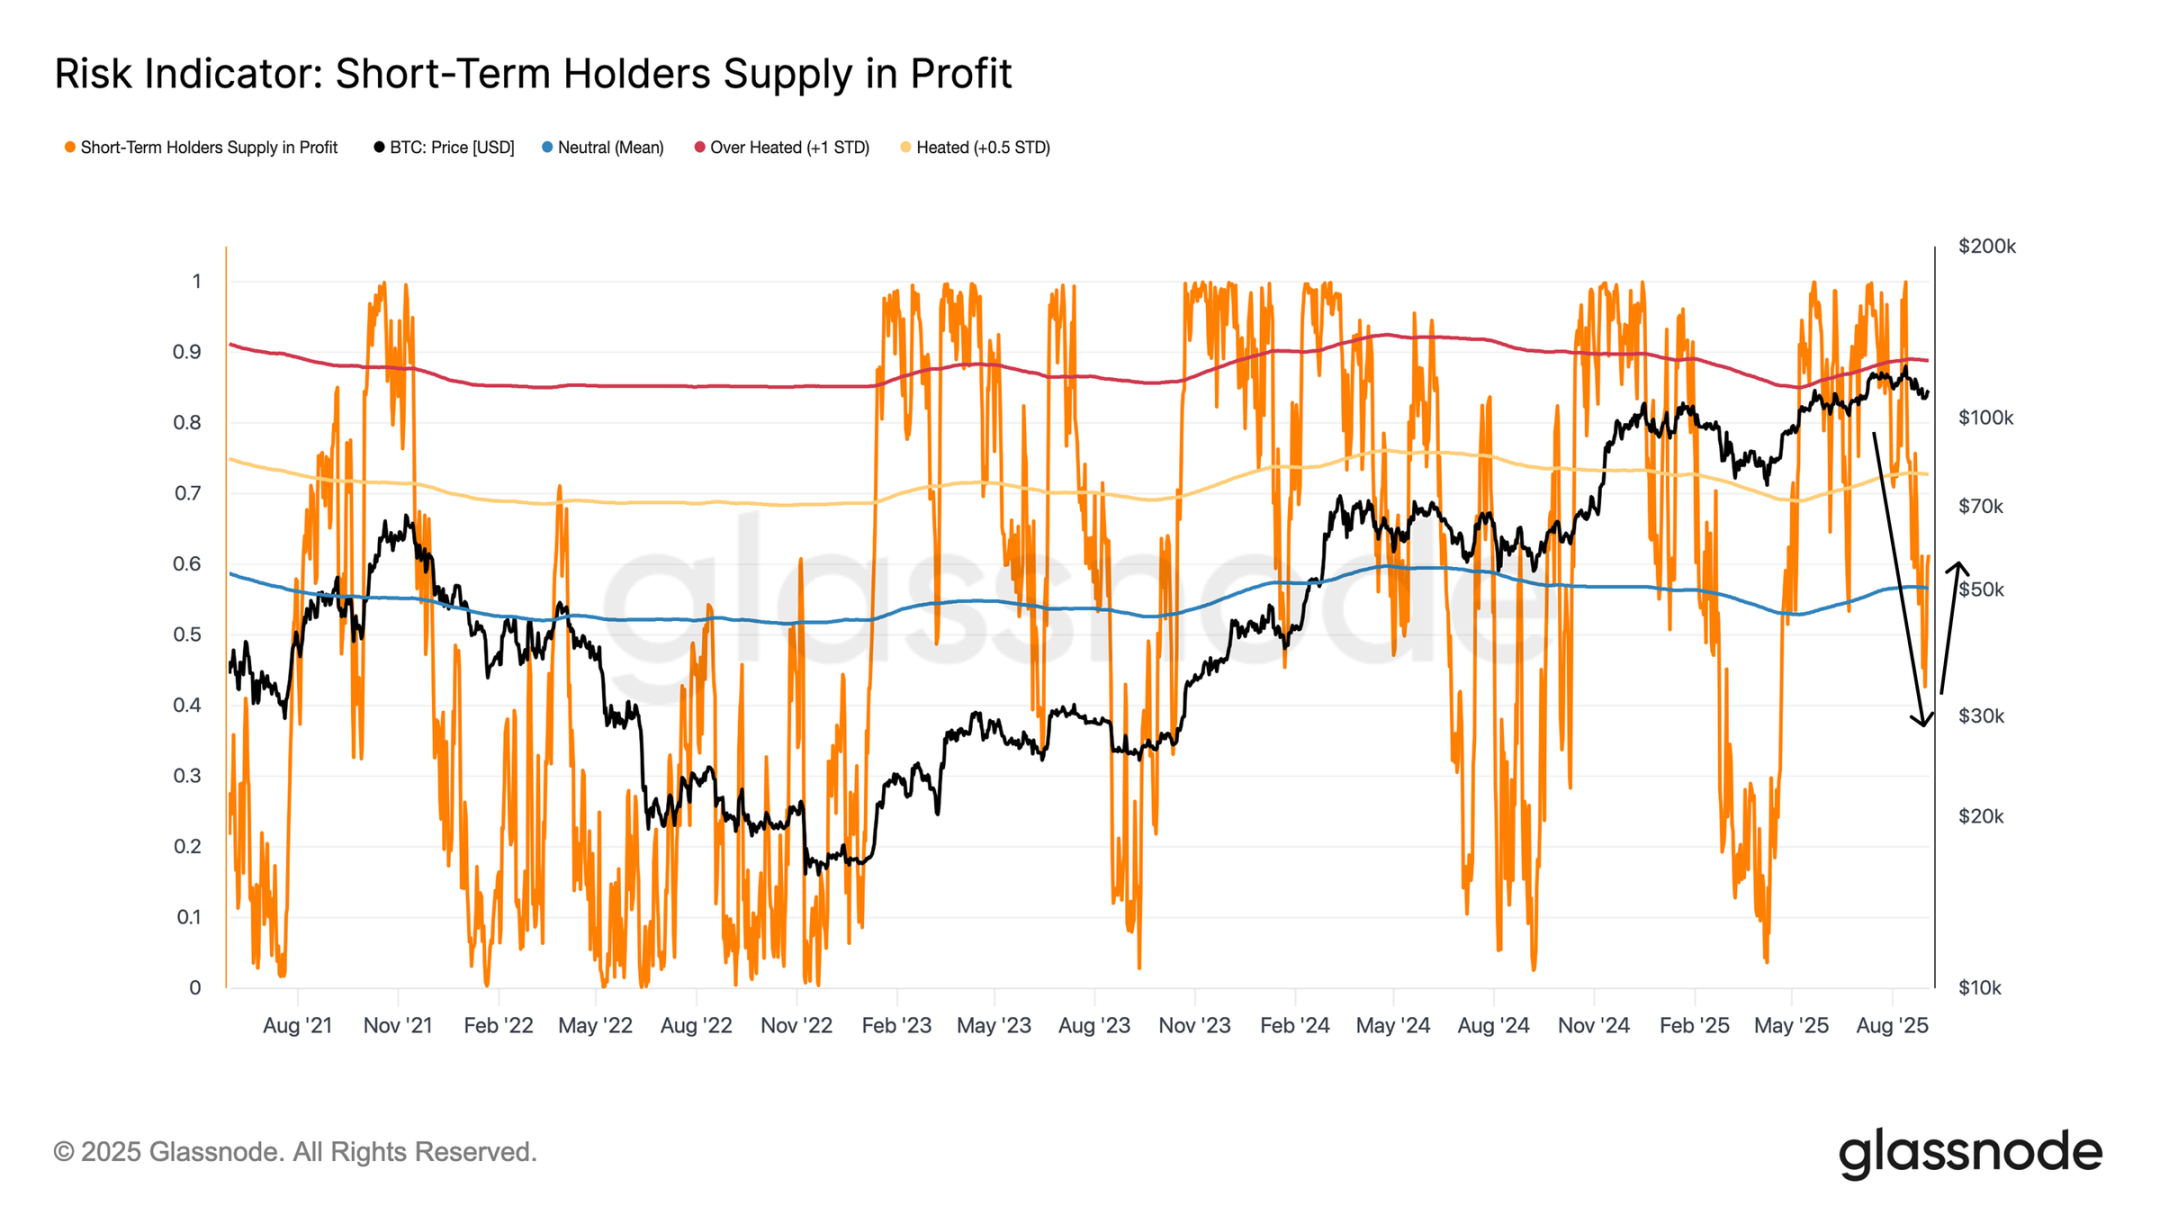
Short-Term Holder Profit Ratio Risk Indicator Chart
Sentiment Detection: Signals from the Futures and ETF Markets
After analyzing the on-chain price models and the profit status of short-term holders, the next step is to determine whether off-chain indicators align with these signals or show divergence.
Among off-chain indicators, the futures market (especially perpetual contracts) is most sensitive to overall sentiment changes. The funding rate (the hourly interest paid by longs to shorts for holding positions) is a direct measure of speculative demand: excessively high rates indicate an overheated market, while drifting towards zero or negative values suggests weakening momentum.
In this cycle, $300,000/hour serves as the dividing benchmark for bullish and bearish sentiment. The current funding rate is approximately $366,000/hour, placing the market in a neutral zone—neither reaching the overheated peak of over $1,000,000/hour in March and December 2024, nor dropping to the cooling state below $300,000/hour from Q1 to Q3 of 2025. If the rate further drops below the benchmark, it will confirm a comprehensive weakening of demand in the futures market.
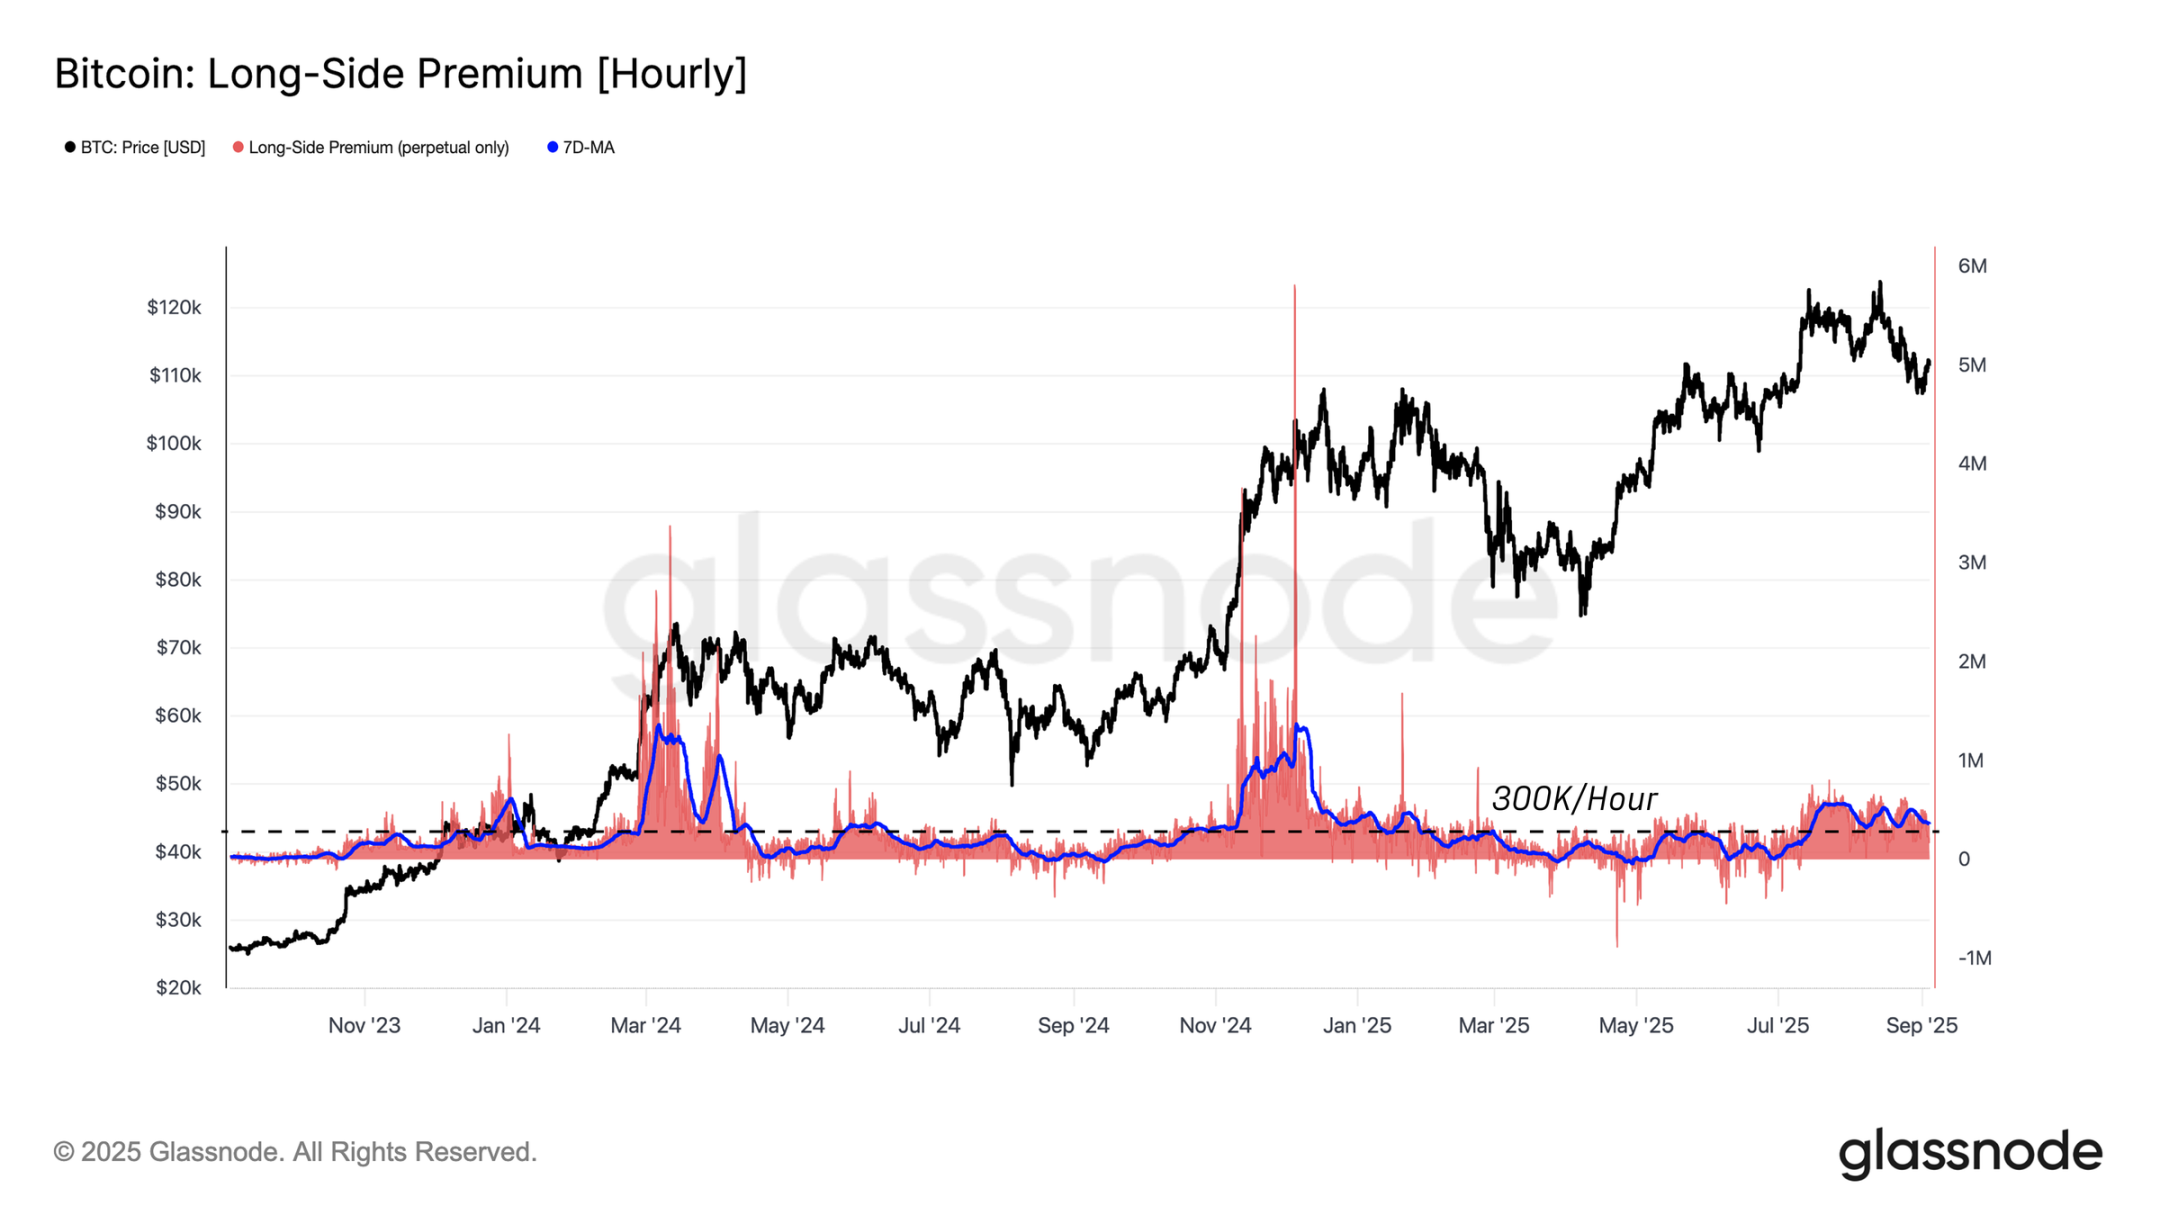
Bitcoin Long Premium Hourly Chart
Cooling Traditional Financial Demand: Contraction of ETF Inflows
In addition to the futures market, spot ETF inflows are an important indicator of the strength of demand from traditional financial institutions. The 14-day average net inflow data shows that from May to August 2025, Ethereum ETF had an average daily net inflow of 56,000 - 85,000 ETH, which was a key driver behind its all-time high; however, in the past week, this pace has sharply dropped to an average daily inflow of only 16,600 ETH, highlighting the weakening demand against the backdrop of price pullbacks.
Bitcoin has shown a similar trend: since April, it has maintained a net inflow of over 3,000 BTC/day, which began to cool in July, and the current 14-day average net inflow has dropped to only 540 BTC. Overall, the traditional financial purchasing power in both markets has clearly contracted, synchronizing with the overall price pullback in recent weeks.
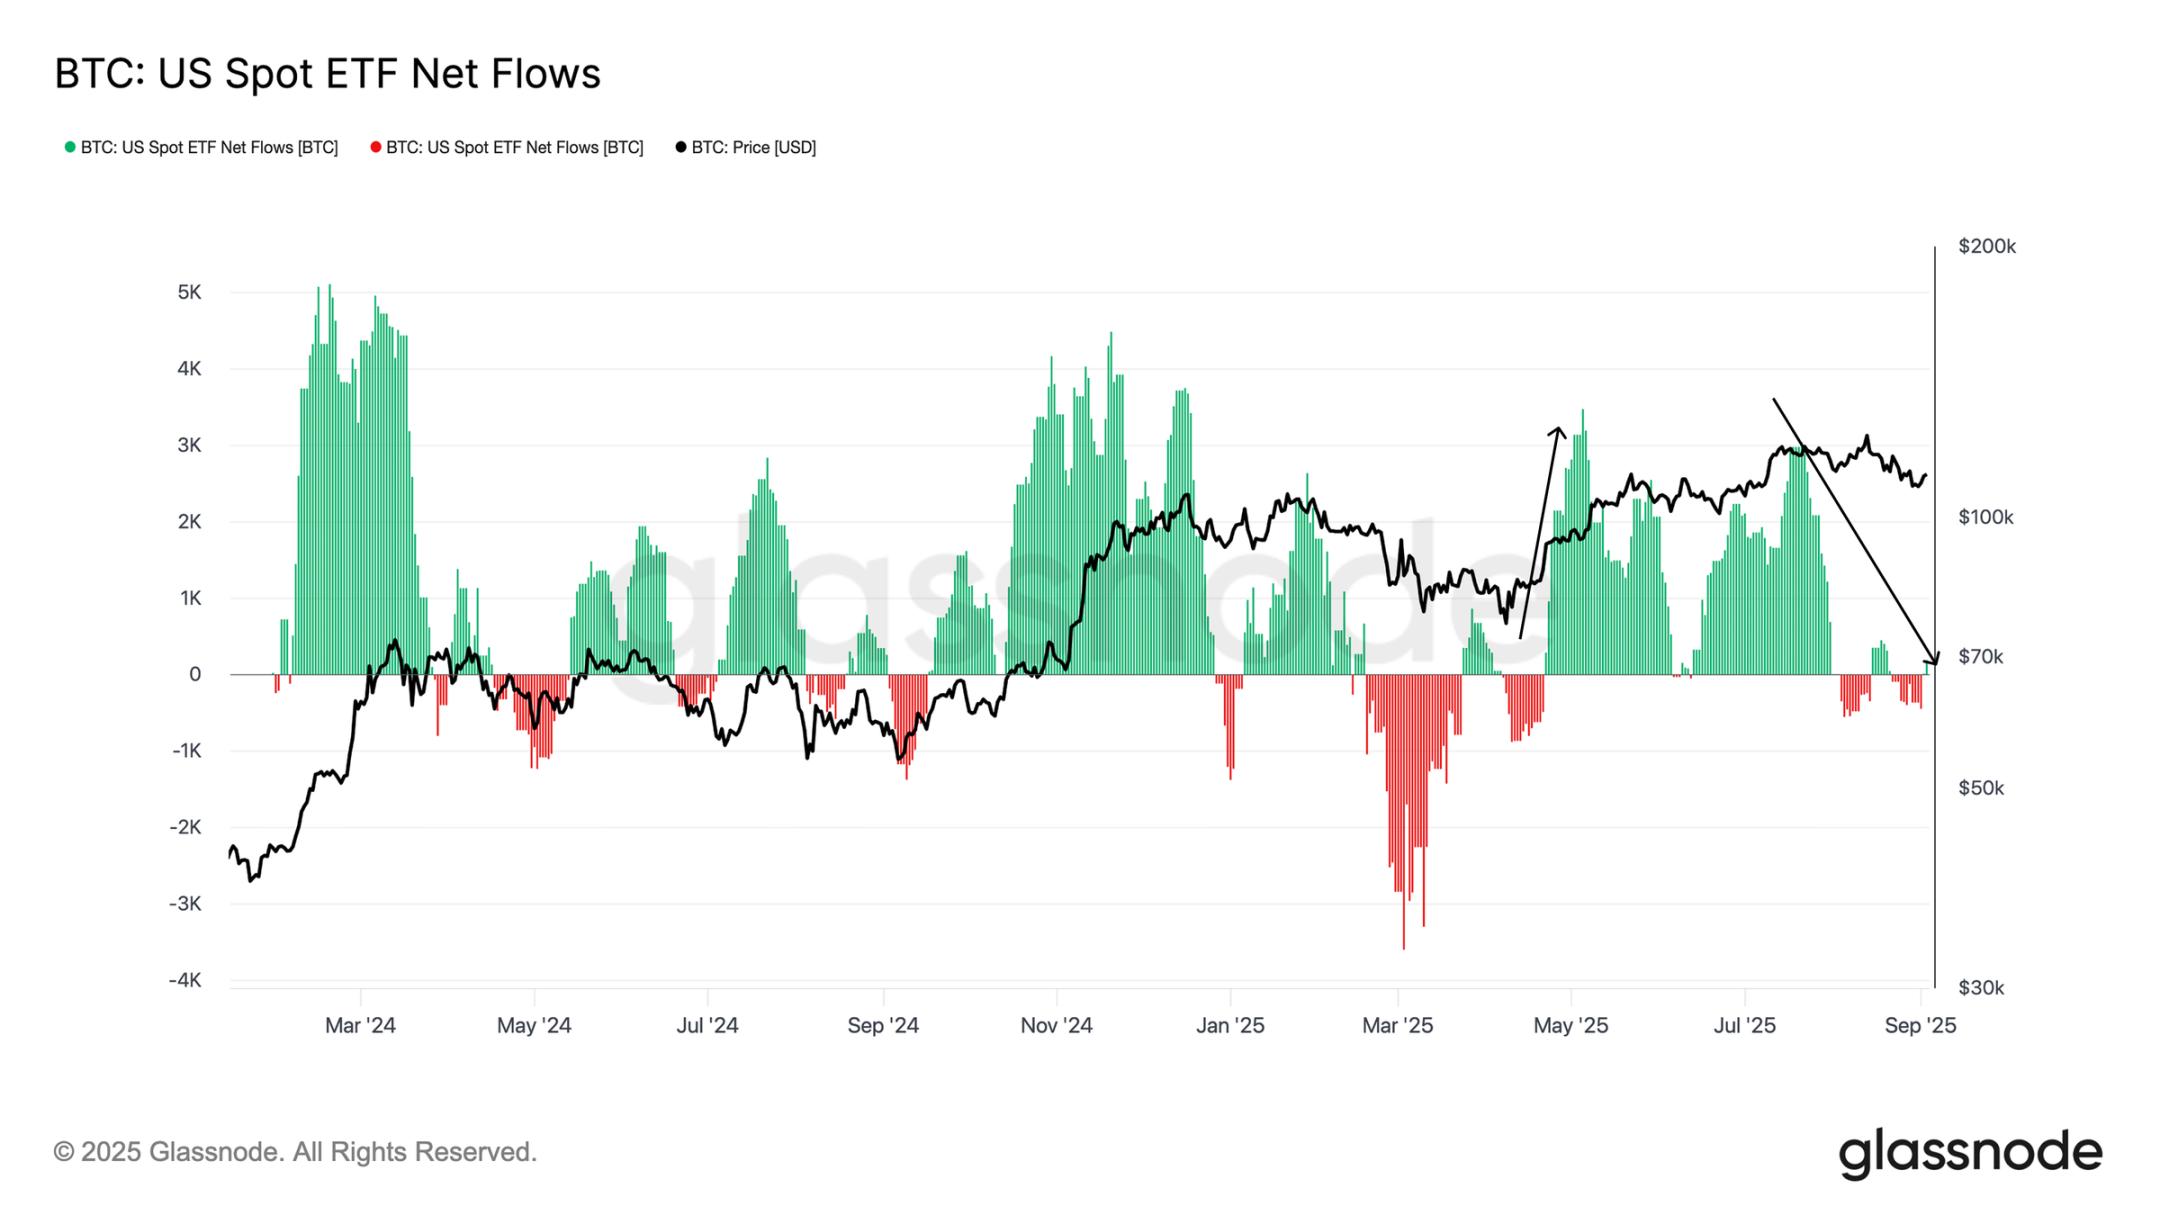
US Bitcoin Spot ETF Net Inflow Chart
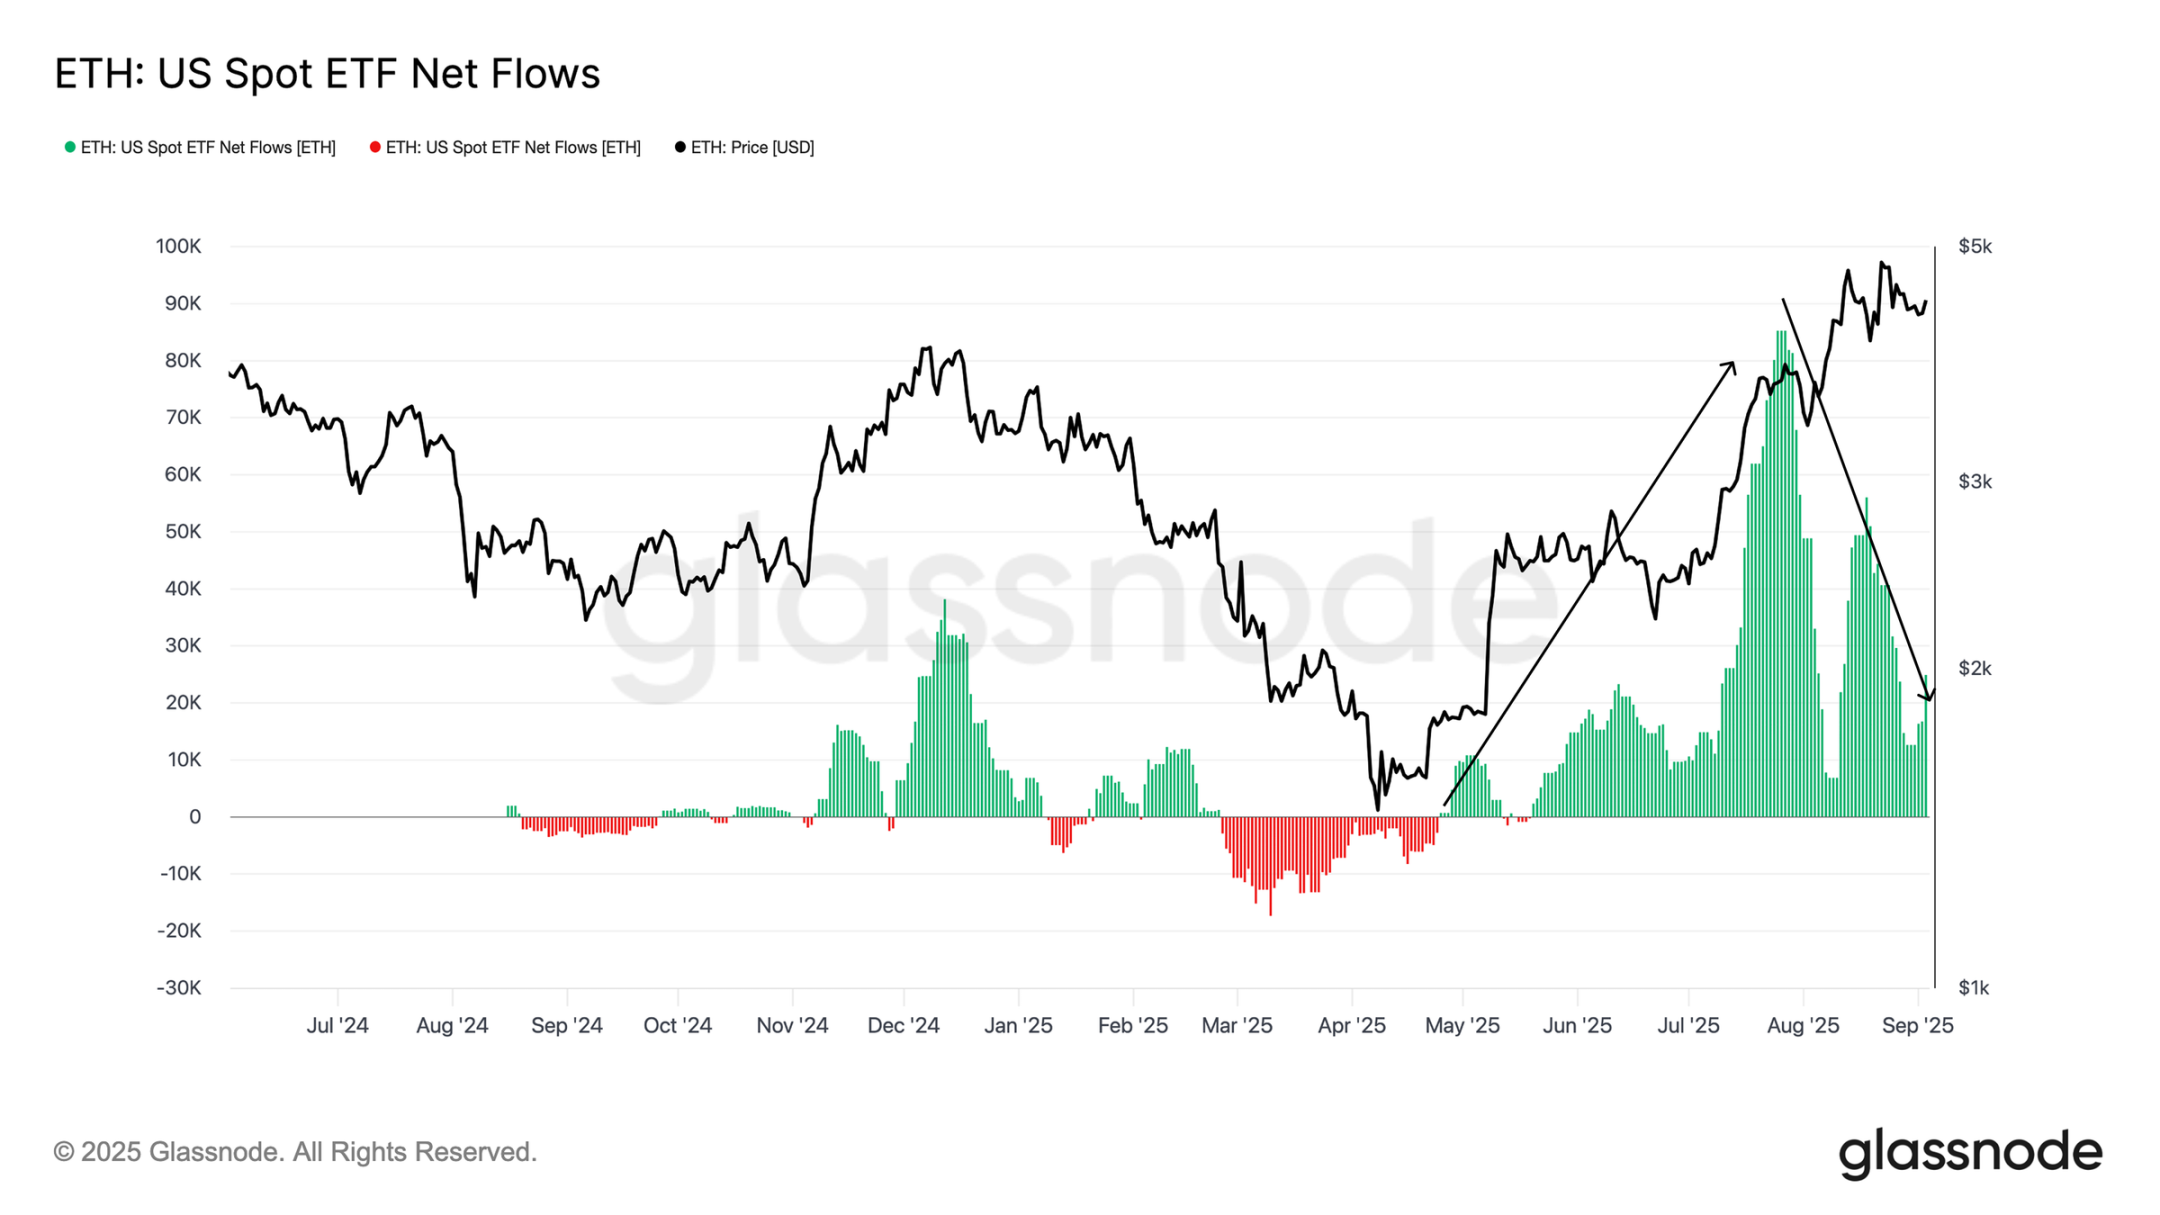
US Ethereum Spot ETF Net Inflow Chart
Structural Differences: Demand Divergence Between Bitcoin and Ethereum
Although both Bitcoin and Ethereum experienced price increases during the surge in ETF inflows, there are differences in the underlying structure of traditional financial demand. By comparing the bi-weekly changes in cumulative ETF inflows with the Chicago Mercantile Exchange (CME) open interest, this distinction becomes clear.
For Bitcoin, ETF inflows far exceed changes in futures positions, indicating that traditional financial investors primarily express directional demand through spot exposure; whereas Ethereum's situation is more complex: the bi-weekly changes in CME open interest account for over 50% of cumulative ETF inflows, meaning that a significant amount of traditional financial activity simultaneously includes both "spot exposure" and "spot-futures arbitrage" strategies, combining directional bets with neutral arbitrage.
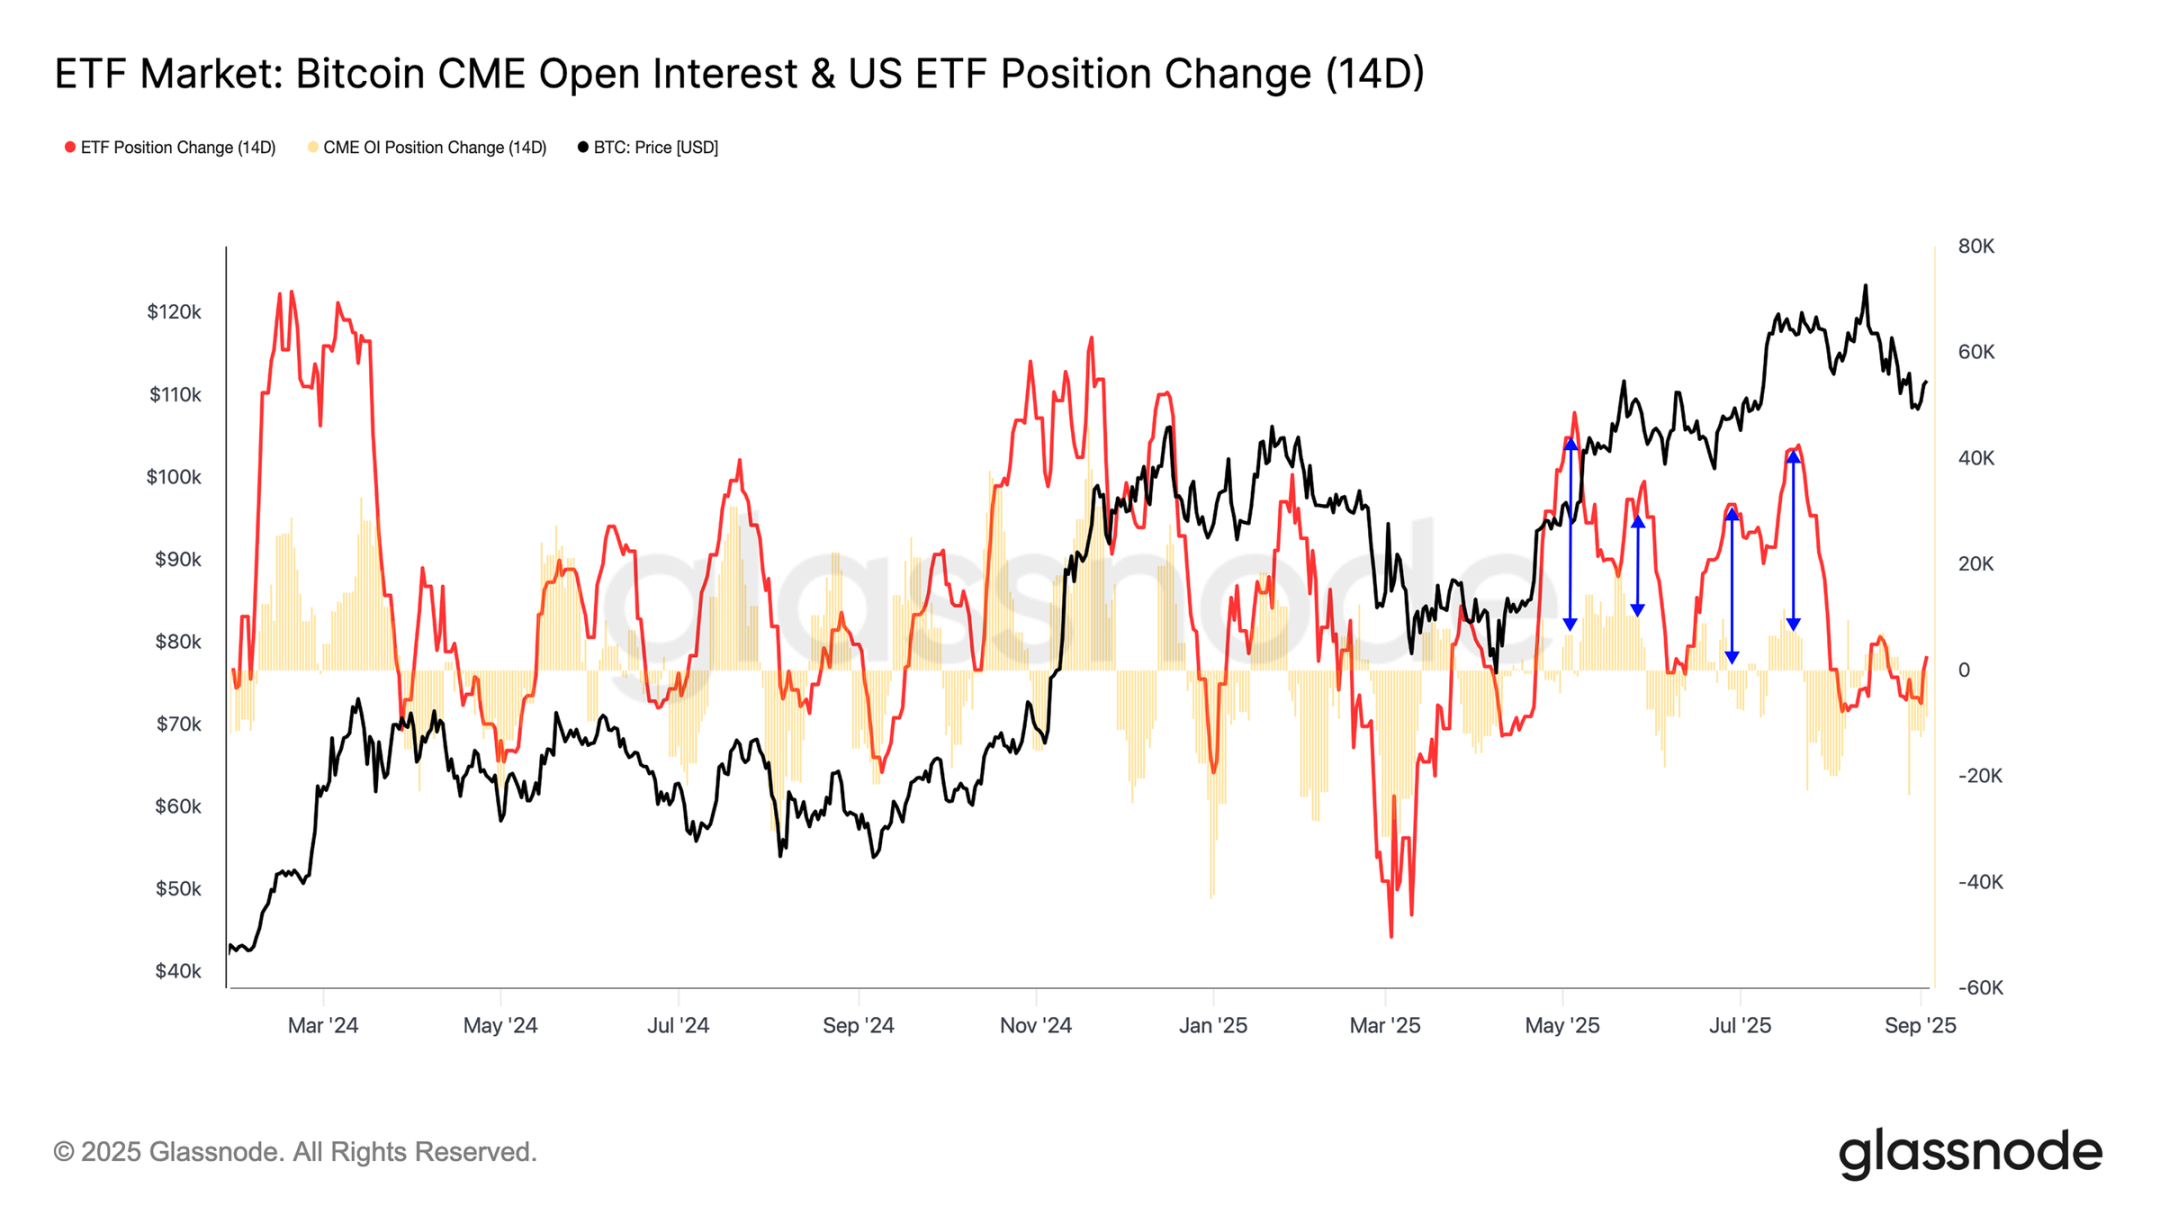
Bitcoin ETF Market and CME Open Interest Chart
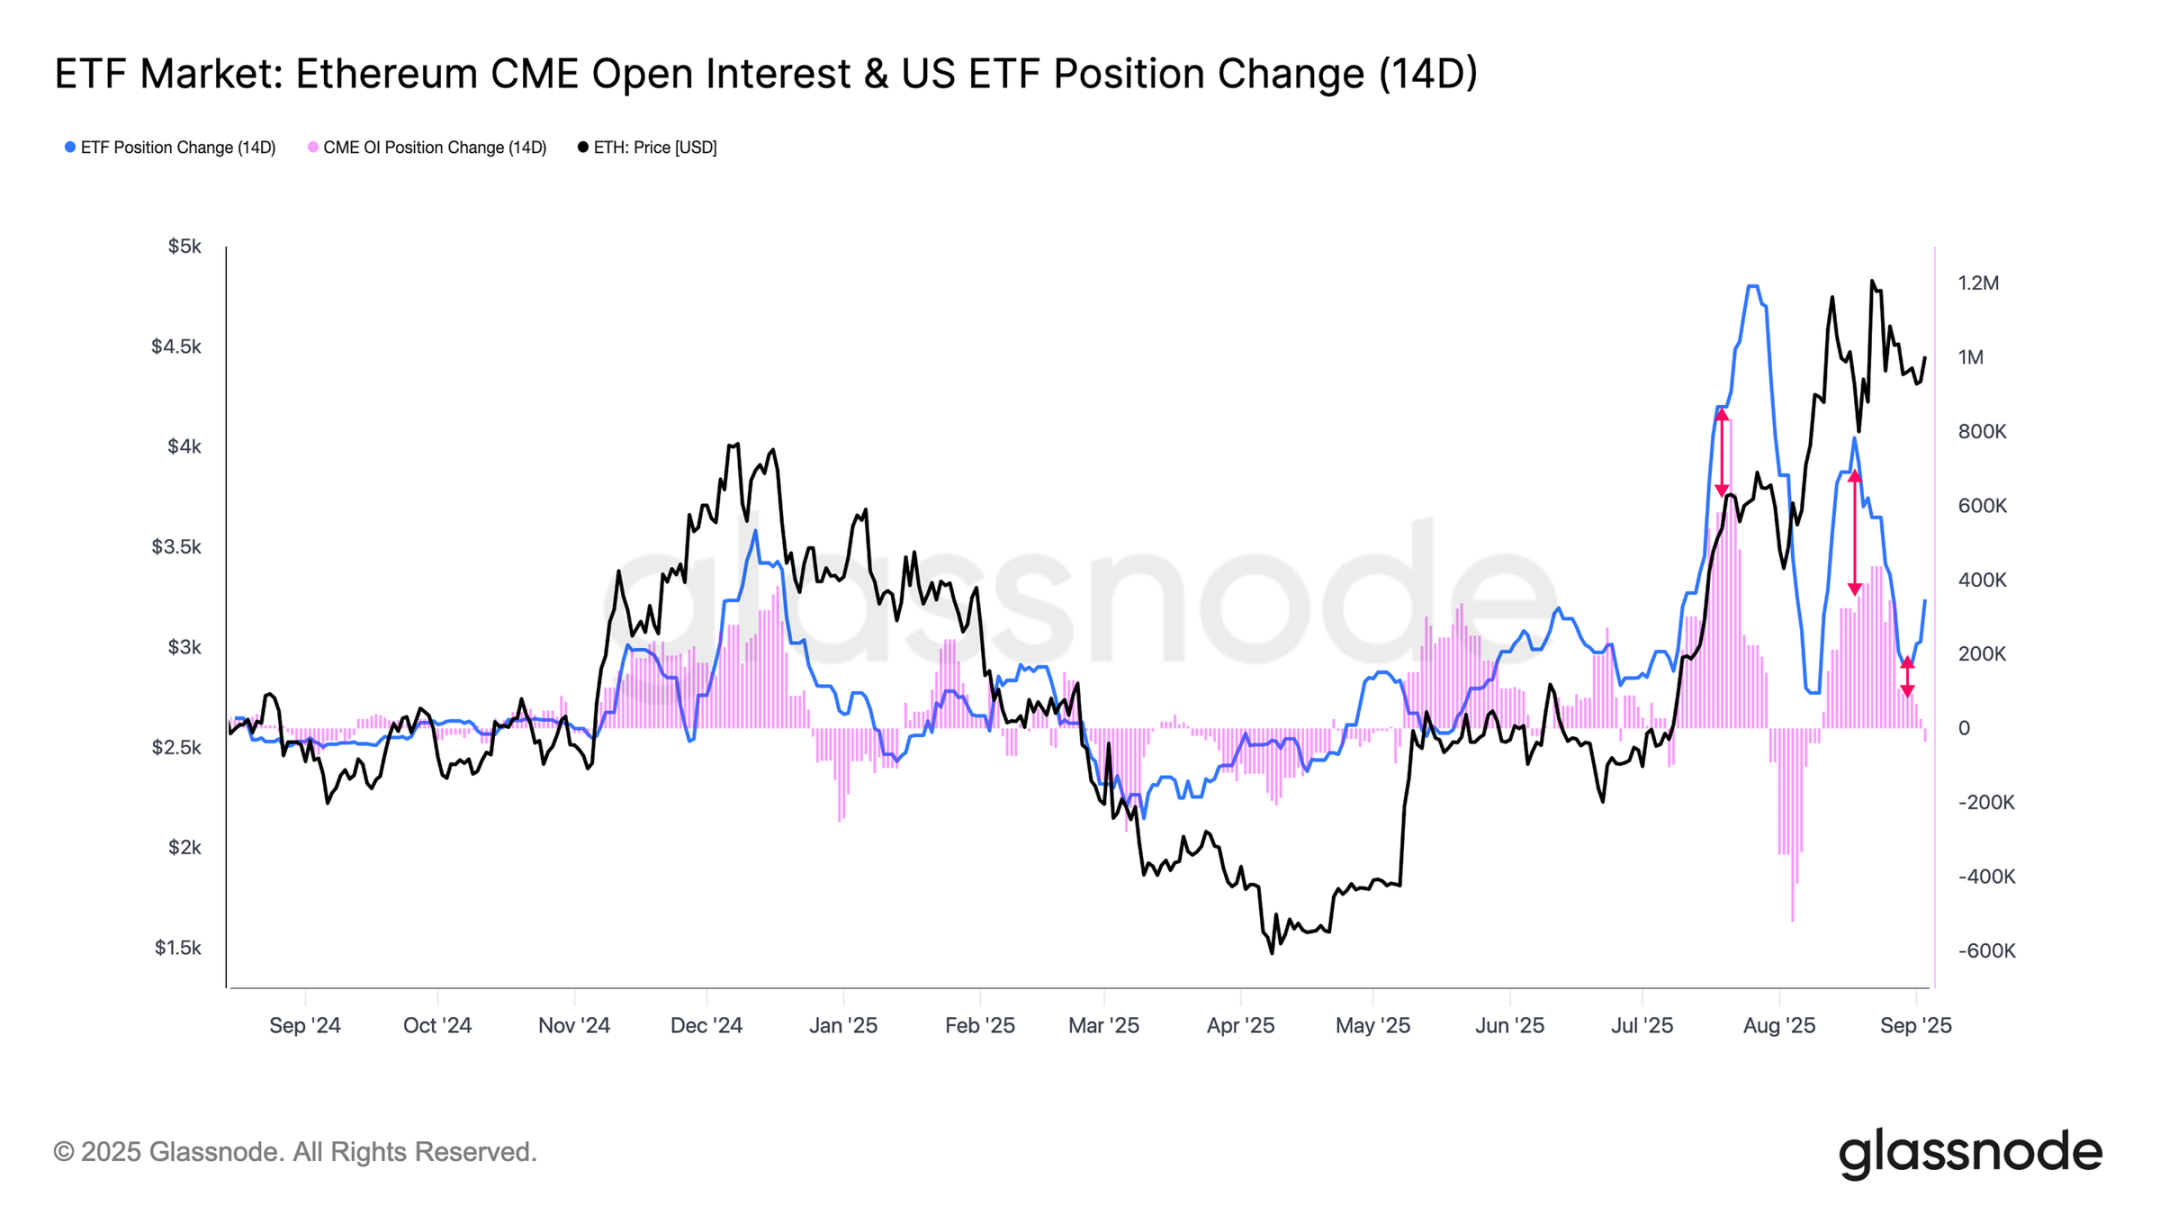
Ethereum ETF Market and CME Open Interest Chart
Conclusion
Bitcoin's current trading price is close to $112,000, consolidating within the range of $104,000 - $116,000. On-chain signals indicate that the status of short-term holders remains fragile: although the profit ratio has rebounded from recent lows, it is not strong enough to confirm a renewed upward trend. Recovering the $114,000 - $116,000 range would allow short-term holders to return to profit, reinforcing the bullish logic; conversely, falling below $104,000 could potentially repeat the previous "exhaustion after a new all-time high" pattern, probing down to $93,000 - $95,000.
Off-chain indicators also reflect uncertainty: the futures funding rate remains neutral, but if demand further declines, there is a risk of weakening; the ETF inflows that previously drove the rise have significantly slowed. Structurally, Bitcoin ETF inflows mainly reflect directional demand, while Ethereum's inflows are more of a mix of "spot-futures arbitrage" and spot demand.
免责声明:本文章仅代表作者个人观点,不代表本平台的立场和观点。本文章仅供信息分享,不构成对任何人的任何投资建议。用户与作者之间的任何争议,与本平台无关。如网页中刊载的文章或图片涉及侵权,请提供相关的权利证明和身份证明发送邮件到support@aicoin.com,本平台相关工作人员将会进行核查。