Master Discusses Hot Topics:
Last night, when the U.S. job vacancy data was released, it left people stunned, as it was the first time since the mask-wearing period that the number of vacancies was lower than the number of unemployed. The U.S. is now also facing a tough job market, which essentially indicates that the economy is about to face problems. Once the labor market goes awry, the economy is in jeopardy.
Normally, such data should be negative, but surprisingly, U.S. stocks and the crypto market saw a rise last night. Why? Because expectations for interest rate cuts are climbing rapidly, with the probability of a rate cut in September soaring to 95%, almost a done deal.
This market rally can be described as a funeral turned into a celebration. Although everyone seems cheerful now, they all understand that the rate cut is due to the economy struggling to hold on.
The Federal Reserve is now in a tough position, having to choose between fighting inflation or supporting the economy to prevent a downturn. In 2022 and 2023, when Silicon Valley Bank collapsed, the Fed gritted its teeth and prioritized inflation.
But the situation is different now, with Trump in the chair, and it’s hard to predict how policy direction will shift. For small and medium-sized enterprises, an early rate cut could provide some relief and possibly bring back some jobs. However, if they continue to hold on, many companies will face closure.
The key points for the market are in the next two days: tonight's ADP employment report and tomorrow's non-farm payrolls + unemployment rate. The ADP report is just a minor poke; the real market movement will depend on tomorrow's data. If the non-farm data is poor, it will directly contradict the rate cut expectations, dousing the market with cold water.
However, if the data is good but doesn’t support the rate cut logic, it will be awkward. The only perfect scenario would be if the non-farm data is bad enough not to cause a collapse, which would be the most suitable script for the market.
Returning to the market, many people have been scared into cutting positions and going short after seeing the weekly MACD for Bitcoin cross bearish. Then they immediately jumped back into long positions upon seeing the daily MACD cross bullish. This reflects a retail investor mentality, always running outside the rhythm.
Bitcoin rebounded from 107.2K, which seems somewhat decent, but the movement is not smooth at all. There’s resistance from the daily EMA21 around 112.4K, and the three-day EMA21 is also pressing down (112.9K).
If it can’t break through, this rebound will be a wasted effort, at most a minor recovery. From the peak, this adjustment has lasted half a month, with a decline of less than 14%, which is relatively gentle.
If it breaks down and makes a new low, while also increasing volume to create a MACD divergence on the daily, it could lead to a smoother rebound, likely in the range of 100K to 105K.
As for Ethereum, the data has been contrary to Bitcoin's in the past few days. Ethereum is seeing net outflows increase, while Bitcoin has returned to net inflows. Ethereum's trading volume is clearly showing signs of fatigue, with Grayscale and Fidelity seeing over five-digit outflows in the past 24 hours, and BlackRock has been even harsher, with no inflows for two consecutive days.
But don’t forget, Ethereum is highly correlated with U.S. stocks and Bitcoin. As long as U.S. stocks rise, Ethereum won’t be in trouble. Moreover, Ethereum has the advantages of ETF staking and strategic reserves, making its chances of strengthening much greater than Bitcoin's.
So, this Thursday and Friday are crucial points. If the news is good, Ethereum could surge to new highs, pulling Bitcoin along. If the news is bad, it could be a black swan event, maliciously crashing the market. Short-term traders should avoid blindly betting on one direction; it’s better to leave some defense at support levels.
Master Looks at Trends:
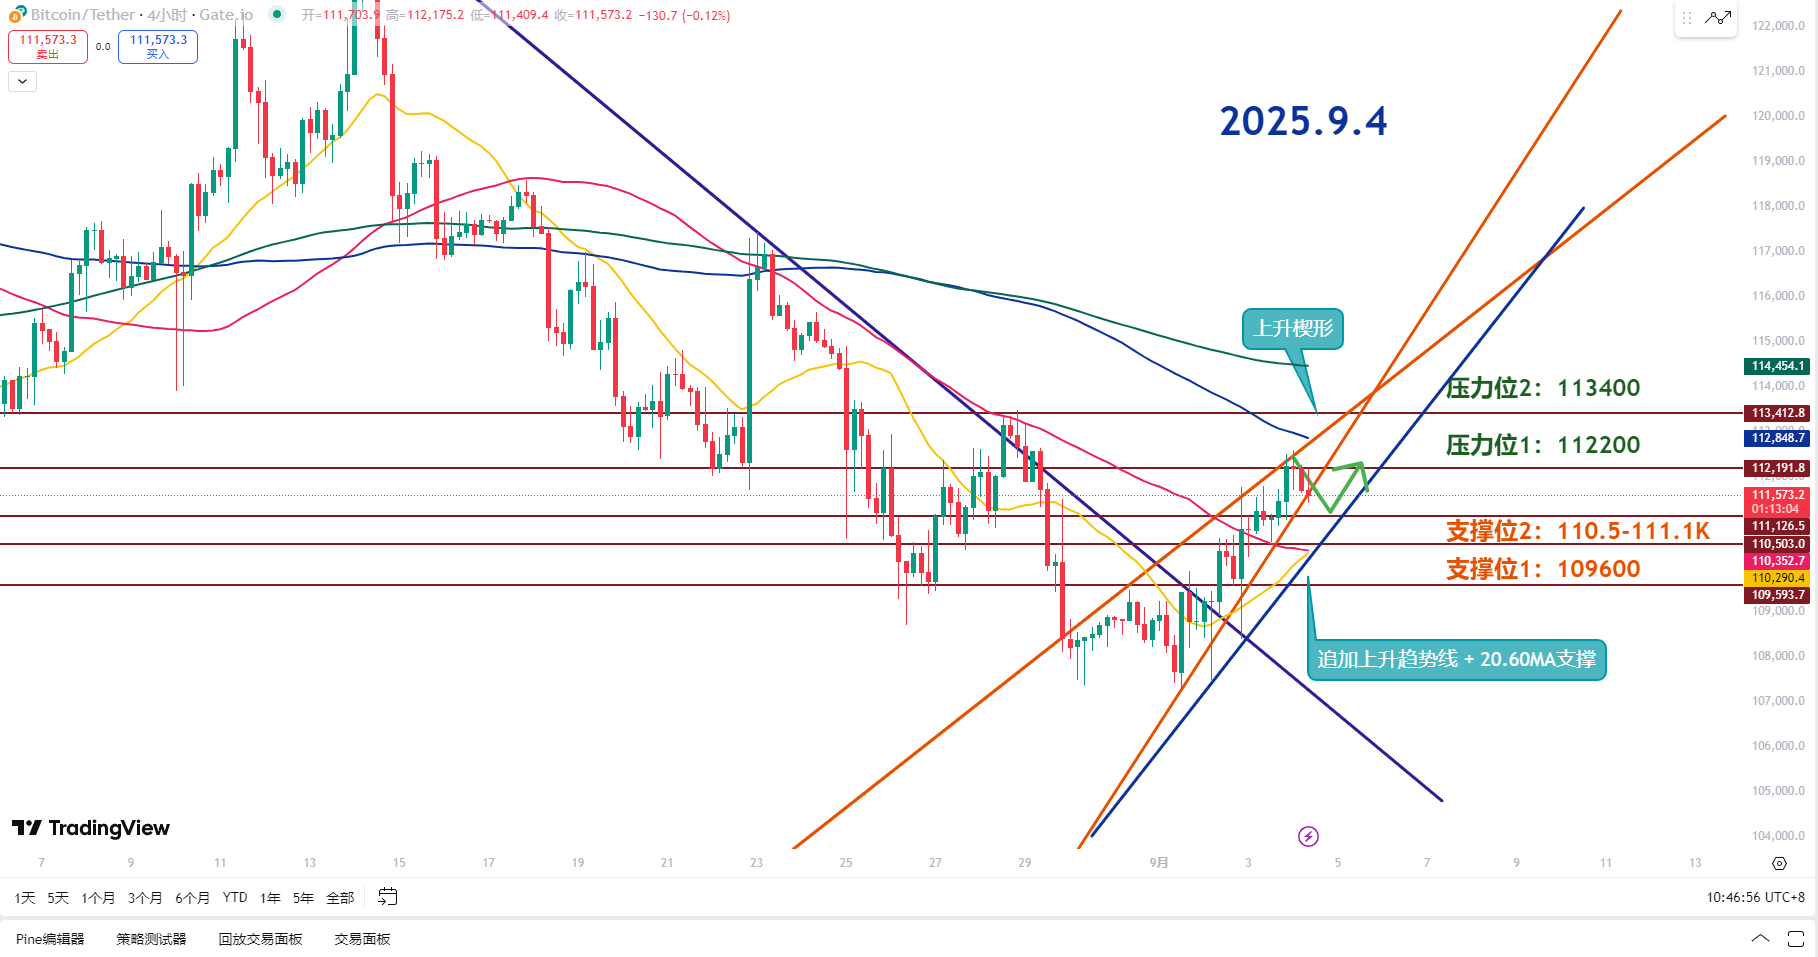
Resistance Levels Reference:
Second Resistance Level: 113400
First Resistance Level: 112200
Support Levels Reference:
First Support Level: 110.5-111.1K
Second Support Level: 109600
Bitcoin's recent rebound hit resistance at 112.5K, forming an ascending wedge on the 4-hour chart. It has now broken down below the wedge's lower edge. Next, pay attention to the position of the ascending trend line and the 20 and 60-day moving averages, as it may need to retest before proceeding.
A reasonable pullback range would be around 110.5K to 111.1K, with the RSI not fully entering the overbought zone, indicating a potential short-term pullback. Although the wedge has formed, the trend is not completely broken, so keep an eye on the 20 and 60 moving averages and the ascending trend line.
On the daily level, a hammer candlestick has appeared today, but note that it could turn into a support line. The opening price of the last bullish candle was at 111.2K.
The first resistance at 112.2K is a short-term high left from the early morning close. Once this adjustment ends, we’ll see if it can pull back from here. If this level cannot hold, forget about pushing the market up.
The second resistance at 113.4K is under pressure from the 120 and 200-day moving averages, making a hard push without good news unlikely. If it can break through with volume, then the market will have new momentum; otherwise, it will grind below 112K.
The first support at 110.5K-111.1K is the first line of defense, and considering building positions in batches here is advisable, with the psychological level of 111K being crucial to hold. If this level holds, there’s still hope for a rebound.
The second support at 109.6K is critical; if the first support cannot hold and breaks below 110.5K-110.6K, it will be dangerous. If panic selling occurs, we may need to look for even lower points. If the 20 and 60-day moving averages can form a golden cross, there’s still a chance to recover.
Today, the price has already broken below the wedge's lower edge, indicating a short-term pullback perspective. Don’t rush to go all in on one side; first, look for signs of a bottom on the smaller time frames before considering a short-term rebound.
9.4 Master’s Wave Strategy:
Long Entry Reference: Buy in batches in the range of 110500-111100, Target: 112200-113400
Short Entry Reference: Not applicable for now
If you genuinely want to learn from a blogger, you need to keep following them, rather than making hasty conclusions after just a few market observations. This market is filled with performers; today they screenshot long positions, and tomorrow they summarize short positions, appearing to "catch tops and bottoms every time," but in reality, it’s all hindsight. A truly worthy blogger will have a trading logic that is consistent, coherent, and withstands scrutiny, rather than jumping in only when the market moves. Don’t be blinded by flashy data and out-of-context screenshots; long-term observation and deep understanding are necessary to discern who is a thinker and who is a dreamer!
This content is exclusively planned and published by Master Chen (WeChat: Coin Master Chen). For more real-time investment strategies, solutions, spot trading, short, medium, and long-term contract trading techniques, and knowledge about candlesticks, you can join Master Chen for learning and communication. A free experience group for fans has been opened, along with community live broadcasts and other quality experience projects!

Warm reminder: This article is only written by Master Chen on the official account (as shown above), and any other advertisements at the end of the article or in the comments are unrelated to the author!! Please be cautious in discerning authenticity, and thank you for reading.
免责声明:本文章仅代表作者个人观点,不代表本平台的立场和观点。本文章仅供信息分享,不构成对任何人的任何投资建议。用户与作者之间的任何争议,与本平台无关。如网页中刊载的文章或图片涉及侵权,请提供相关的权利证明和身份证明发送邮件到support@aicoin.com,本平台相关工作人员将会进行核查。


