Cryptocurrency News
September 3 Hot Topics:
1. SEC and CFTC joint statement supporting registered platforms to conduct crypto spot trading
2. Ethereum Foundation sells 10,000 ETH in batches for funding and donations
3. Coinbase launches Mag7 + Crypto index futures, covering seven major tech stocks and crypto ETFs
4. Pumpfun updates Creator Fee mechanism, supporting community takeover and ecological growth
5. Nearly 600 economists sign an open letter supporting Cook, calling for the defense of the Federal Reserve's independence
Trading Insights
Analysis of the 8 Stages of Bottom Fishing in the Cryptocurrency Market: Which Step Are We Currently In?
- First Stage: Confidence Boom Period - The atmosphere in the group is enthusiastic, everyone is full of confidence, making promises, promoting, and actively pushing every day, all believing they are "doing great things."
- Second Stage: Confidence Weakening Period - Cryptocurrency prices enter a sideways trend, growth stagnates, confidence in the group declines, but some still persist in pushing, not completely giving up hope.
- Third Stage: Initial Bottom Fishing Period - Cryptocurrency prices begin to fall, most people see it as a "buying opportunity," and actively increase their positions.
- Fourth Stage: Weak Bottom Fishing Period - Prices continue to decline, initial bottom fishing funds are exhausted, people can no longer buy, discussions in the group decrease, and enthusiasm for pushing significantly cools.
- Fifth Stage: Negative Outburst Period - Negative emotions spread in the group, voices of blame and insults towards the project team emerge, and dissatisfaction is concentratedly released.
- Sixth Stage: No One Cares Period - Almost zero discussions in the group, insults disappear—most people have cut losses and left, completely uninterested in project dynamics.
- Seventh Stage: Belief Shattered Period - Prices continue to oscillate at low levels, eroding the last remaining belief of retail investors, with some being forced to cut losses.
- Eighth Stage: Recovery Takeoff Period - The market begins to recover, the market makers test the waters (pulling up sharply) to observe retail investor reactions; after repeated testing, retail investors dare not chase the rise, and market makers initiate a real upward trend.
Key Question: Which stage are we currently in?
This needs to be assessed based on the specific cryptocurrency's price trend (whether it is in a low-level sideways trend or continuously declining), community activity (discussion volume/emotions), and retail investor behavior (whether they are still bottom fishing or have exited).
Comprehensive Judgment:
- If there are still insults in the community and some people are observing, it is likely in the 5th-6th stage;
- If it is in a low-level sideways trend and the community is silent, it may be in the 7th stage;
- If there is a test pull-up and retail investors dare not chase, it may have entered the early 8th stage.
LIFE IS LIKE
A JOURNEY ▲
Below are the real trading signals from the Big White Community this week. Congratulations to those who followed along. If your operations are not going smoothly, you can come and test the waters.
Data is real, and each trade has a screenshot from the time it was sent.
**Search for the public account: *Big White Talks About Coins*
BTC
Analysis
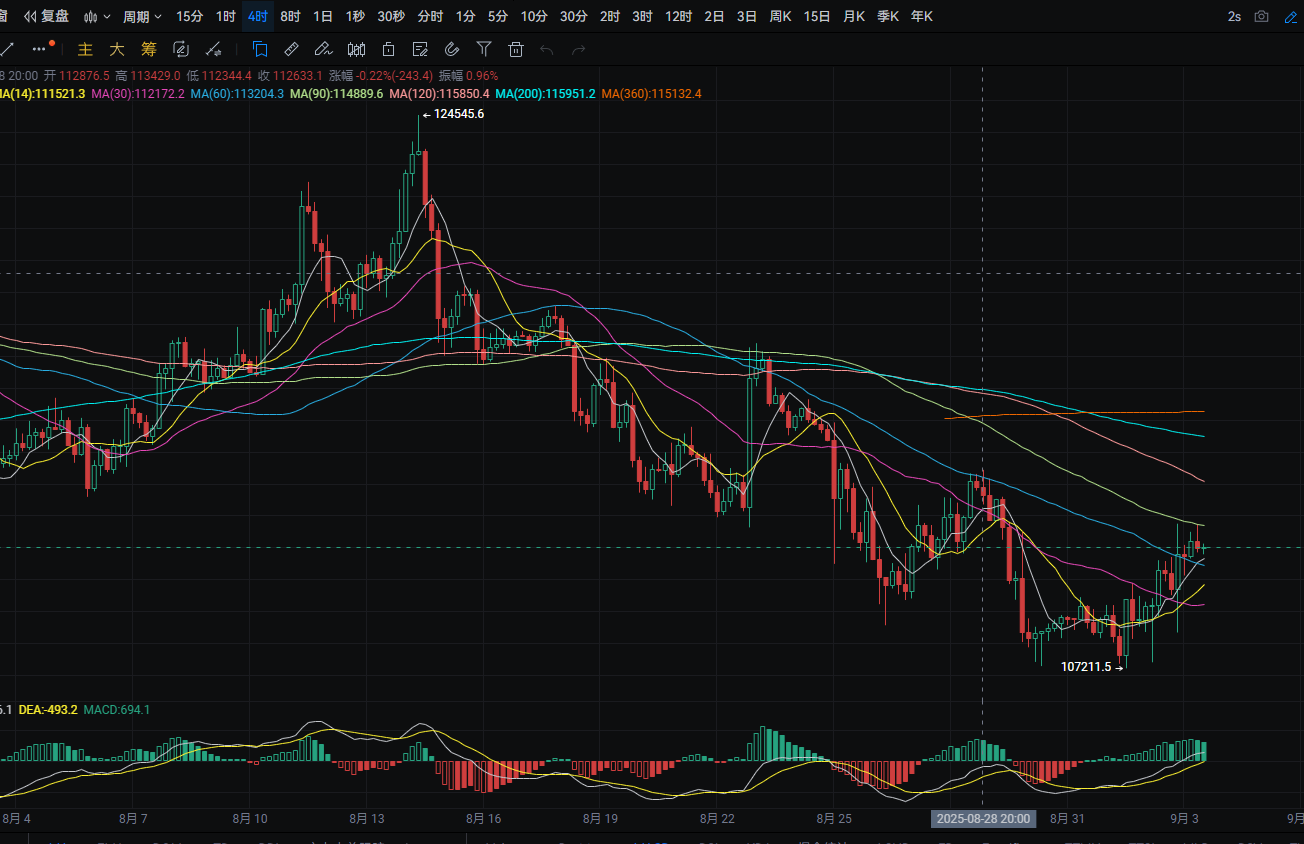
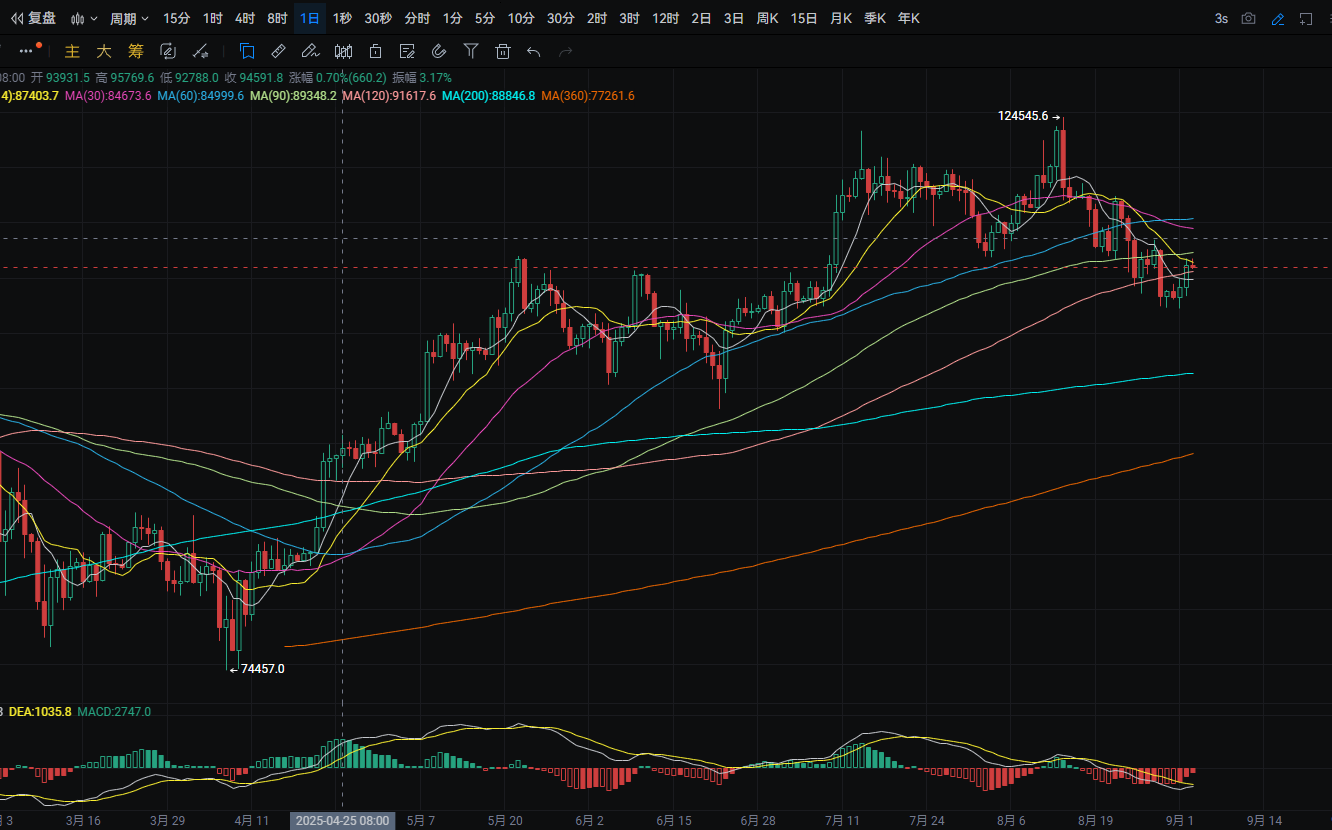
Bitcoin's daily line rose from a low of around 108,350 to a high of around 111,750 yesterday, closing around 111,200. The support level is around 108,150; if it breaks, it could drop to around 104,550. A pullback could be a buying opportunity nearby. The resistance level is around 113,300; if it breaks, it could reach around MA60. A rebound to this area could be a selling opportunity. MACD shows a decrease in bearish volume and signs of a golden cross forming. The four-hour support level is around MA14; if it breaks, it could drop to around 107,550. A pullback could be a buying opportunity nearby. The resistance level is around MA30; if it breaks, it could reach around MA120. A rebound to this area could be a selling opportunity. MACD shows a decrease in bullish volume.
ETH
Analysis
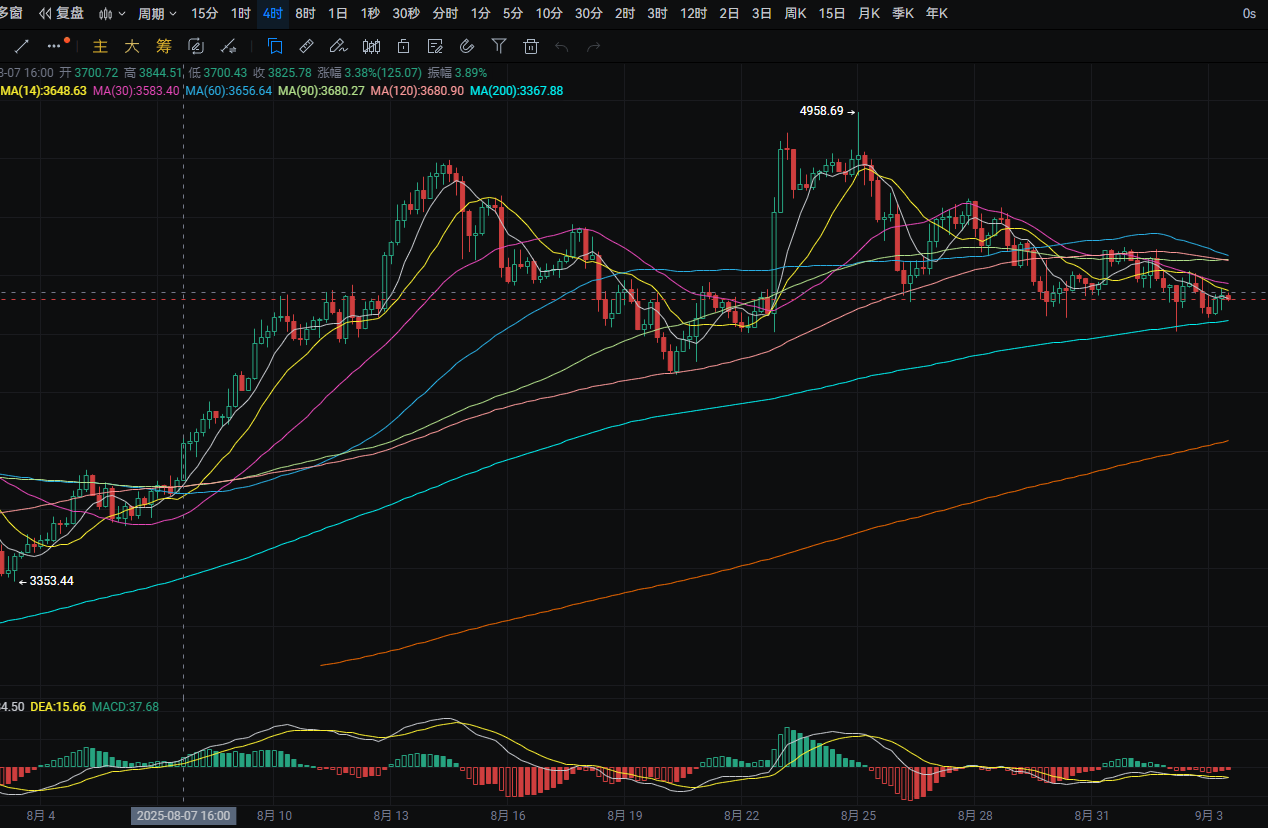
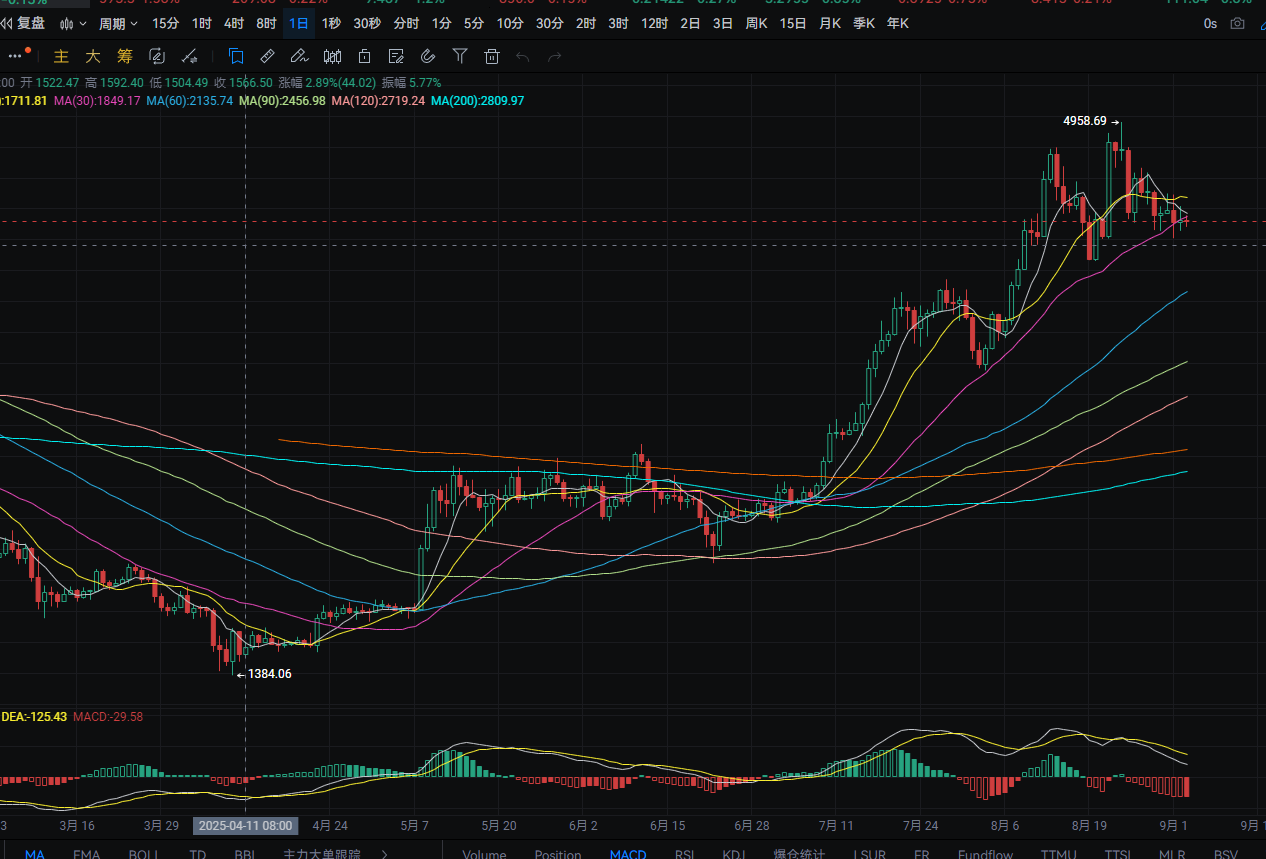
Ethereum's daily line rose from a low of around 4,255 to a high of around 4,415 yesterday, closing around 4,325. The support level is around 4,215; if it breaks, it could drop to around 4,075. A pullback could be a buying opportunity nearby. The resistance level is around MA14; if it breaks, it could reach around 4,720. A rebound to this area could be a selling opportunity. MACD shows an increase in bearish volume. The four-hour support level is around MA200; if it breaks, it could drop to around 4,135. A pullback could be a buying opportunity nearby. The resistance level is around 4,425; if it breaks, it could reach around 4,595. A rebound to this area could be a selling opportunity. MACD shows a flat oscillation with dual lines converging.
Disclaimer: The above content is personal opinion and for reference only! It does not constitute specific operational advice and does not bear legal responsibility. Market conditions change rapidly, and the article has a certain lag. If you have any questions, feel free to consult.
免责声明:本文章仅代表作者个人观点,不代表本平台的立场和观点。本文章仅供信息分享,不构成对任何人的任何投资建议。用户与作者之间的任何争议,与本平台无关。如网页中刊载的文章或图片涉及侵权,请提供相关的权利证明和身份证明发送邮件到support@aicoin.com,本平台相关工作人员将会进行核查。


