In fact, every journey we take is not about encountering an unknown self, but rather, the more we see and the farther we go, the more we realize that our troubles are unnecessary, and all our dissatisfaction stems from a lack of experience. However, each return brings with it a renewed spirit to live, just to be able to go a little further next time and to expand our hearts a little more.
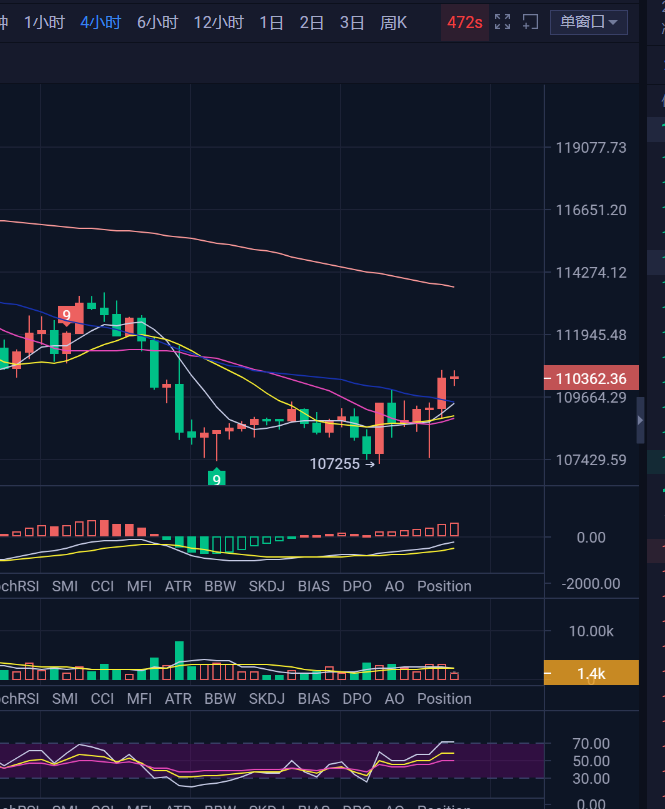
Yesterday's market experienced fluctuations, and ultimately, the short-term bulls completed a counterattack. After probing the low point around 107250, the market began to rally to around 109900, followed by a period of consolidation. Until early this morning, after another dip near 107500, a strong rebound occurred. As of now, the market has returned above 110000, with the bulls pushing up nearly 3000 points. In terms of operations, there isn't much to say; I opened a short position above 109000 yesterday, and after the drop below 108000, I set a breakeven stop loss, which was triggered by the market's subsequent rise. Such occurrences in a fast-moving market can be challenging without real-time monitoring, so it's better to operate cautiously.
Returning to today's market, we should first look at liquidity. From the current perspective, we initially expected the market to clear the short-term bearish liquidity around 109000, then move down again to complete the clearing of new short-term bullish high liquidity near 106000. However, the actual market movement has led to further clearing of the bears, reaching the short position clearing level above 110200 that we mentioned yesterday. With the liquidity being cleared, both short and long-term liquidity have significantly decreased, and there hasn't been a new accumulation of large liquidity clearing intensity in the short term. The area around 112000 has become a short-term bearish liquidity clearing zone, while the areas around 108000 and 106500 have become short-term bullish clearing zones. If the market starts to consolidate again, there may be a larger influx of new liquidity, providing reasons for the market to clear. The spot premium index remains unchanged and has not seen a significant increase due to the market's rise, similar to yesterday's decline, which also did not see a substantial drop. Accordingly, the market may need to maintain some consolidation in the short term while waiting for a reallocation of market funds.
On the technical side, the daily level showed a bullish candle at the bottom yesterday, and with today's rebound so far, it has reached the position of the large MA120 line, which was a previous support level. With the breach of this position, it has formed a support-resistance conversion, which is currently a short-term pressure point. The first touch here should lead to a pressured pullback, which aligns with expectations. In terms of technical indicators, due to the rebound, the current MACD in the bearish cycle is beginning to converge. Whether it will form a trend reversal into a bullish cycle still requires time. The expectation for this repair on the daily indicators exists, with RSI turning upward, and the daily chart needs to confirm the formation of a short-term bullish trend.
On the four-hour level, after probing the bottom yesterday, we believed the four-hour trend was relatively weak, and the MACD was running in a bullish cycle but indicated a low point on the four-hour cycle. This led us to judge that the short-term four-hour chart would dip again to reach a lower position. However, it was quite unexpected; first, a bullish candle at the bottom lifted the MACD, extending the life of this bullish cycle. After some consolidation, it again closed with a bullish candle, further extending the life of this bullish cycle. Currently, although the rebound has occurred, it has not broken the high of the previous rebound cycle, failing to form a higher high structure. This means the four-hour chart does not indicate a trend reversal. If the volume begins to shrink again in this bullish cycle, it may enter a bearish cycle once more. Until now, I personally still believe that a lower point will appear, which aligns with our thinking from yesterday—another low point will emerge, then align with the daily indicators for a rebound.
In terms of operations, I currently believe that a short position can be opened again near the current price of 110500, with an additional position at 112000, then looking for a pullback to 108000. If further bullish clearing occurs, we can look to position for a long below 106500.
【The above analysis and strategies are for reference only. Please bear the risks yourself. The article is subject to review and publication, and market conditions change in real-time, so the information may be outdated. Specific operations should follow real-time strategies. Feel free to contact and discuss the market.】

免责声明:本文章仅代表作者个人观点,不代表本平台的立场和观点。本文章仅供信息分享,不构成对任何人的任何投资建议。用户与作者之间的任何争议,与本平台无关。如网页中刊载的文章或图片涉及侵权,请提供相关的权利证明和身份证明发送邮件到support@aicoin.com,本平台相关工作人员将会进行核查。


