Dear friends, today we won't guess the rise and fall, nor gamble on the market. Let's directly dive into "the hard goods that see through the market" — by using these 3 core indices well, even friends who are new to the scene can grasp the overall BTC market clearly, and who knows, they might even become "professional players" in the eyes of insiders!
Let's start with the first one, which I highly recommend for long-term attention — ahr999 index, also known as the "HODL index." This index is a theoretical value calculation specifically created by Weibo user @ahr999 based on the Bitcoin supply halving pattern.
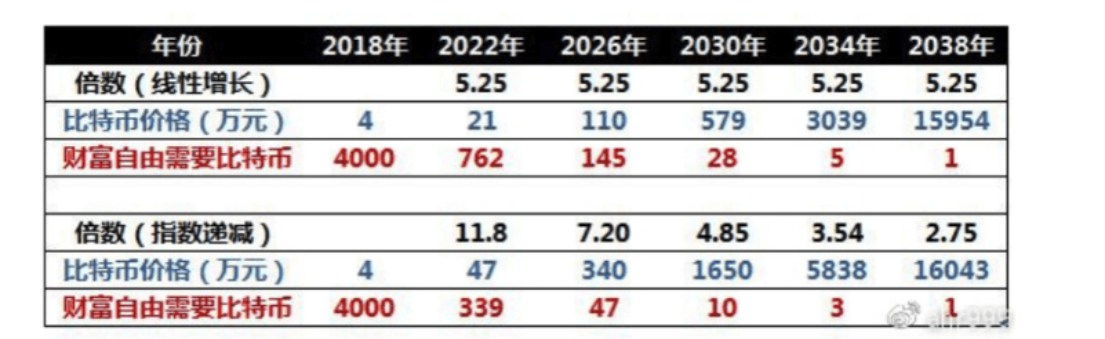
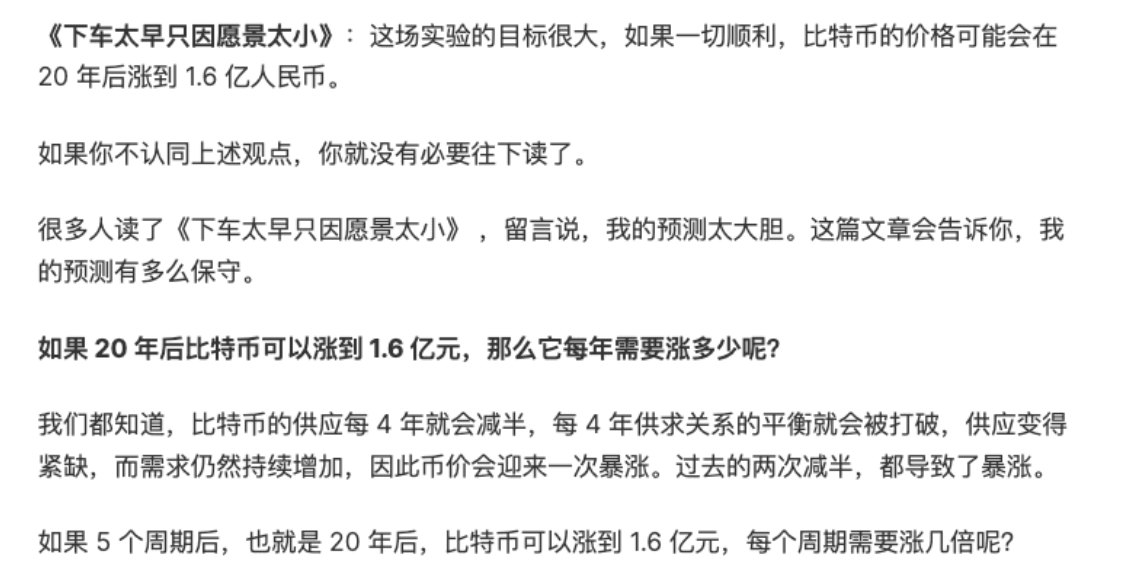
Just looking at his predictions is quite interesting: according to the current growth trend, BTC could reach 1.1 million RMB by 2026, which is about 150,000 USD! To be honest, this prediction is already quite close to reality — today is September 2025, and there’s only one year left until 2026. Let’s verify it together then!
The author's analytical logic is particularly clear, so let’s break it down in conjunction with the current market situation.
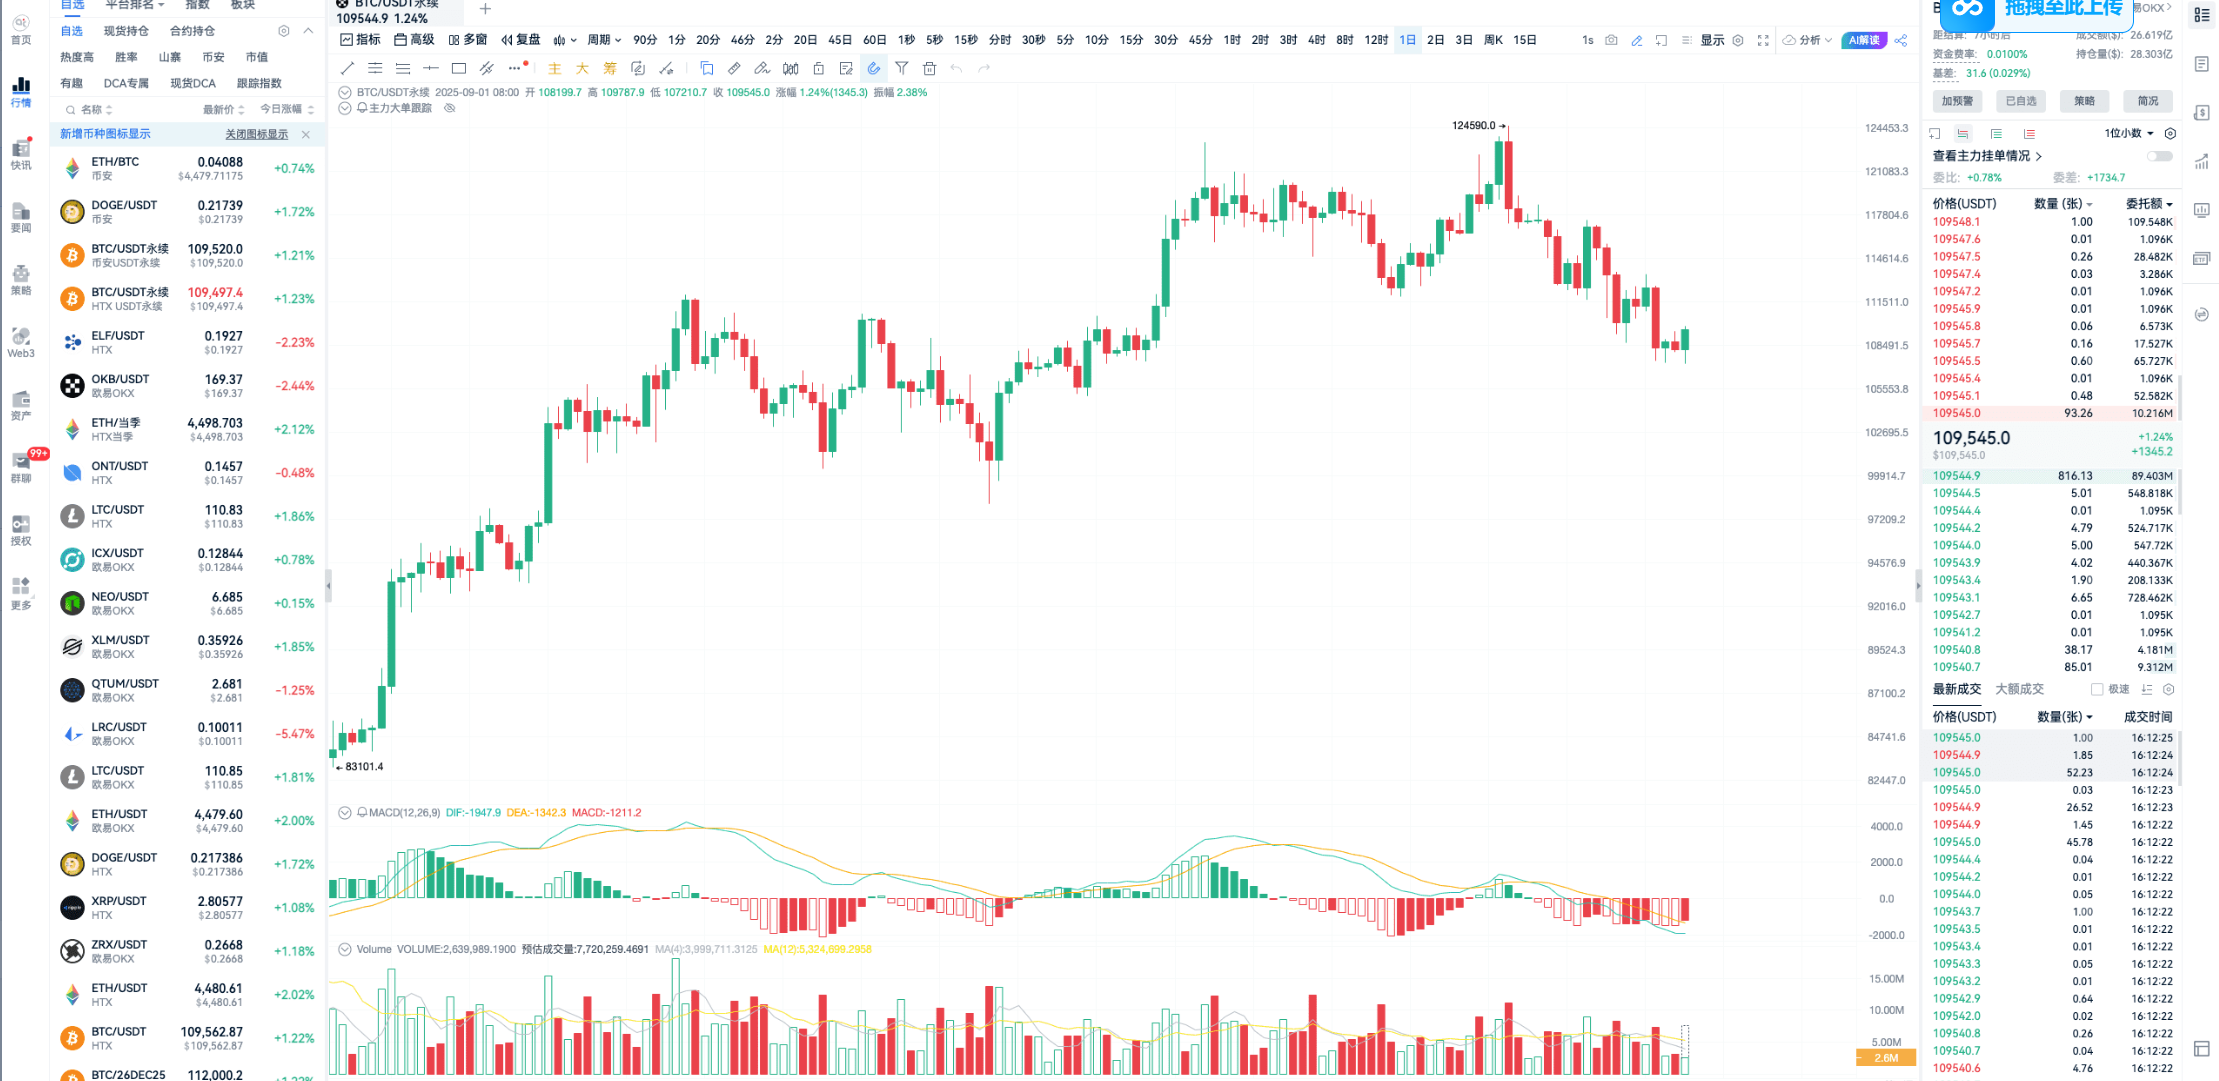
Currently, BTC is around 110,000 USD, for those who want to follow along.
First, open the K-line interface on AiCoin and search for "ahr999."
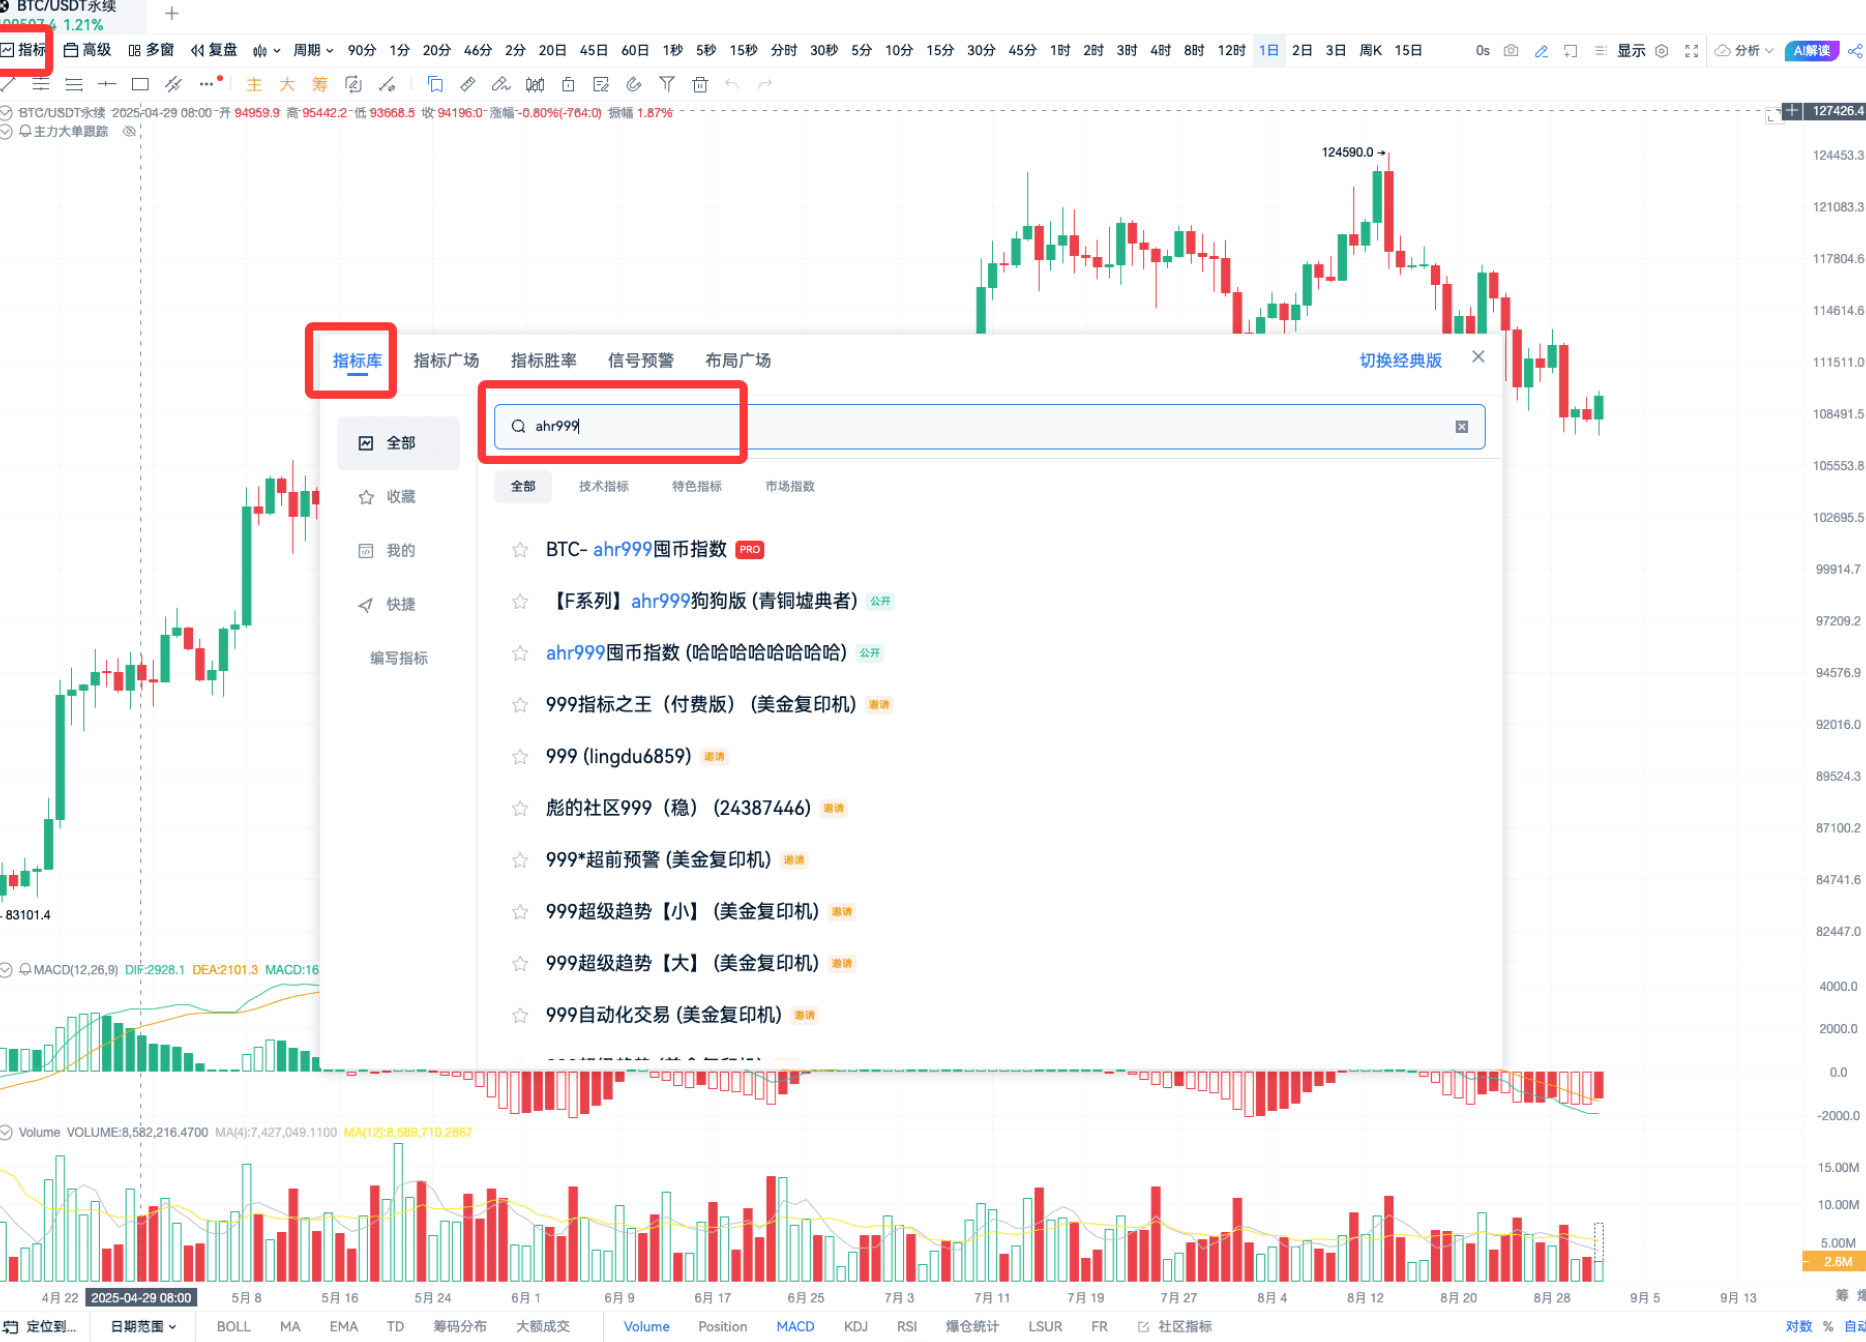
Even without a PRO membership, you can find it in the index section.
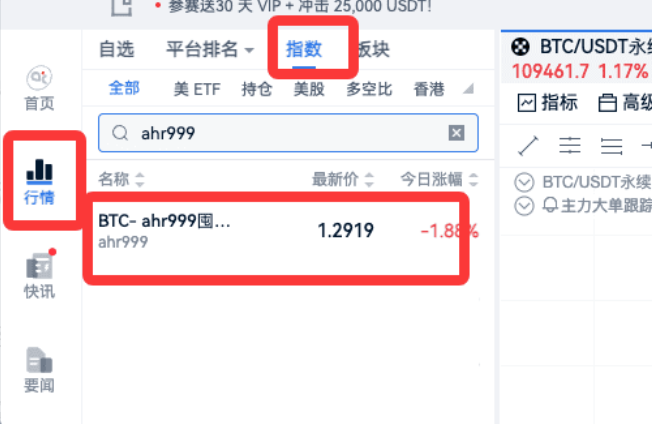
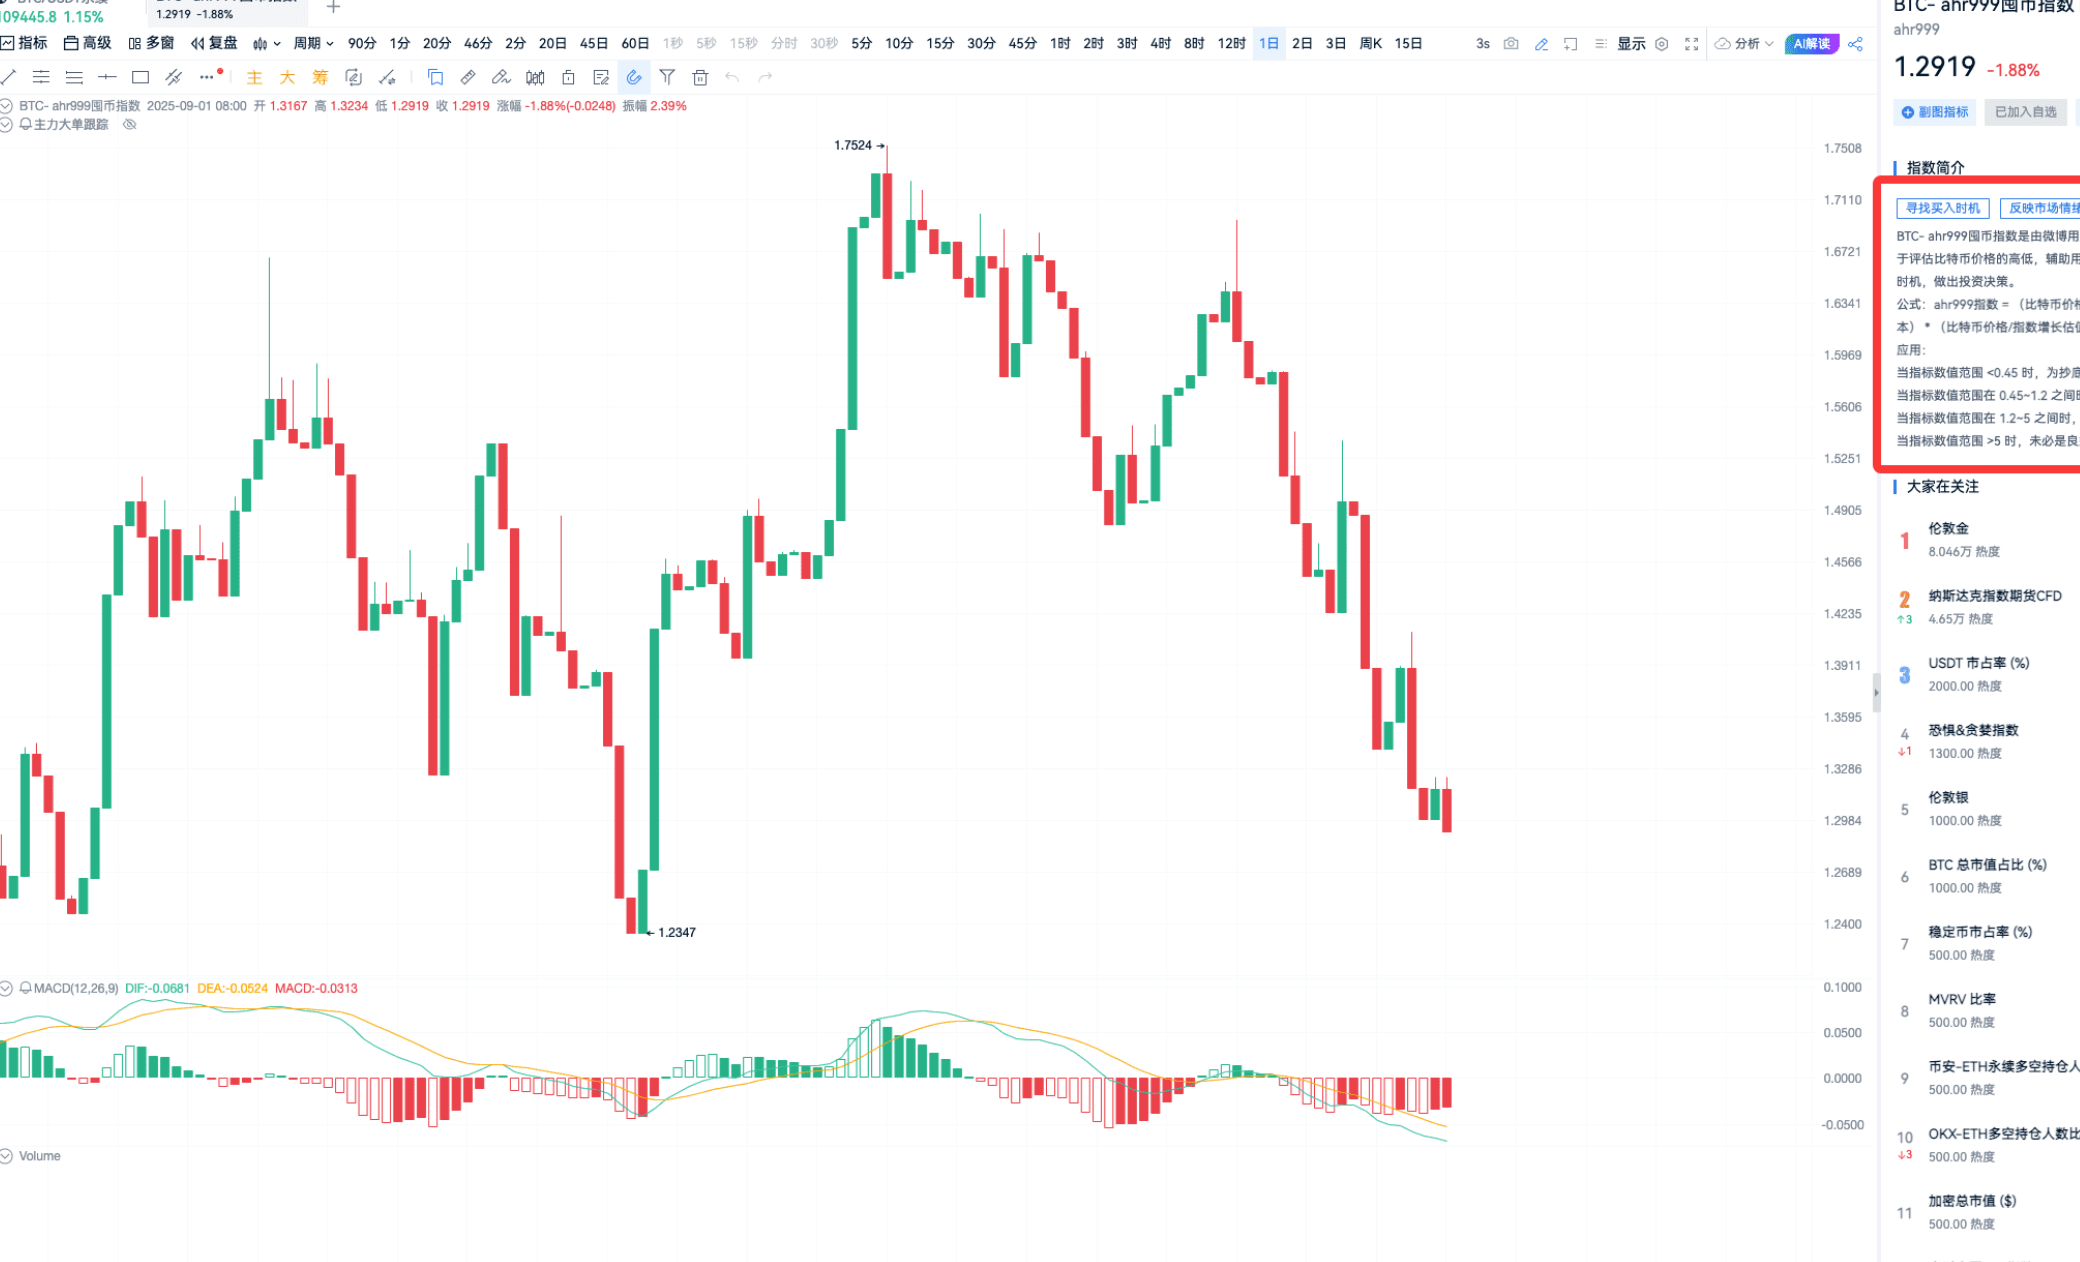
There are also detailed explanations of the indicators inside, so you can flip through if you don’t understand something.

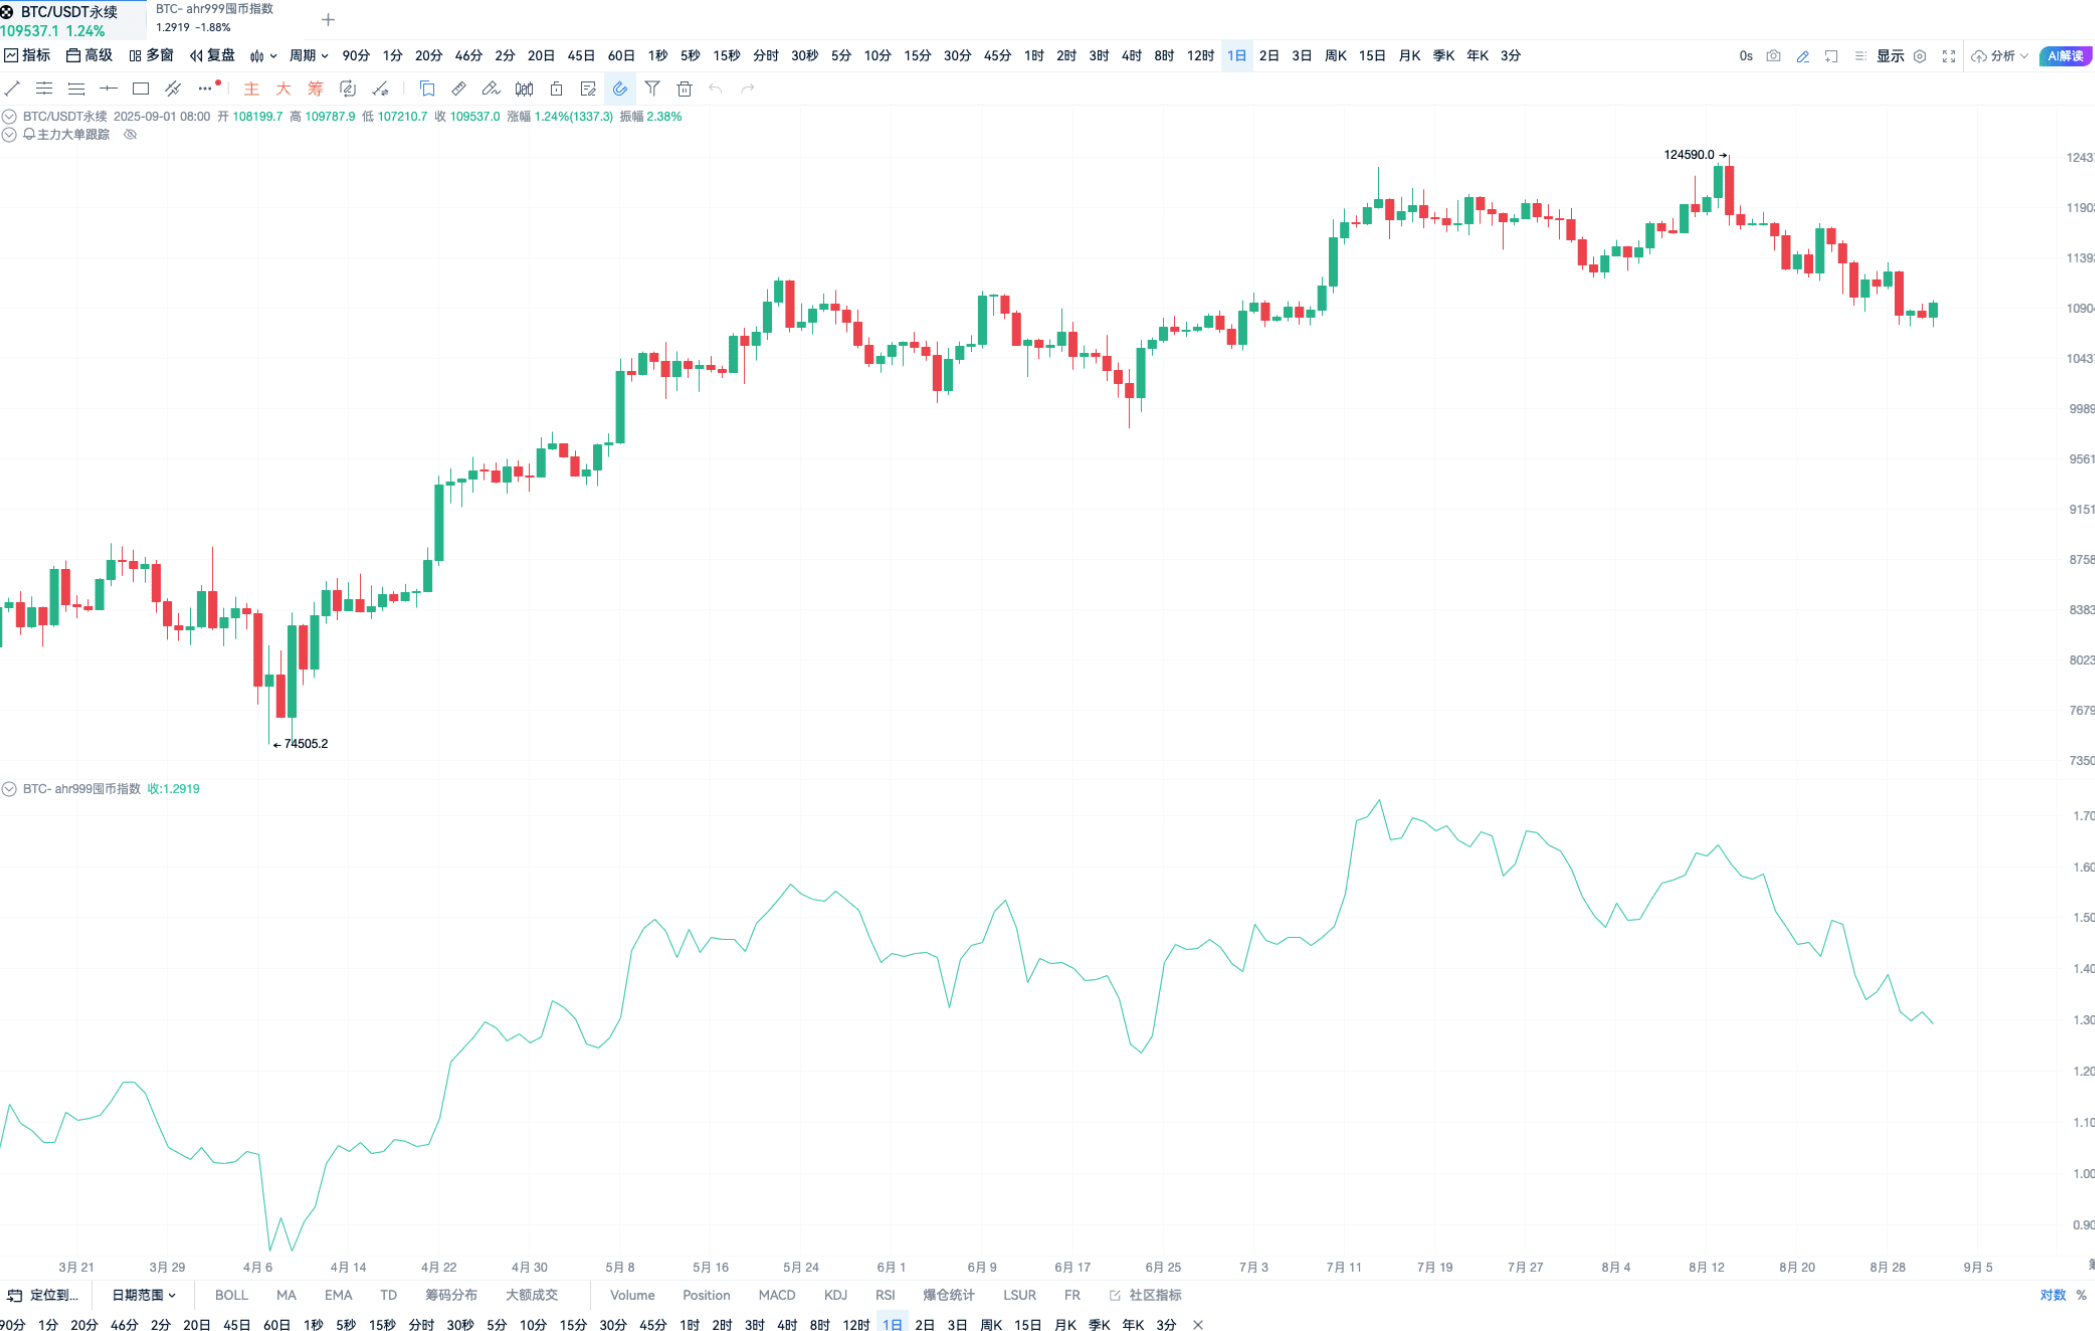
By adding it to the K-line, you can see the correlation between the index and BTC price trends, which is very clear.
So how do we use this index? Let me highlight the core logic:
The ahr999 index is used to assess the high and low prices of BTC and find buying opportunities. The formula is “(Bitcoin price / 200-day fixed investment cost) ÷ (Bitcoin price / index growth valuation).” In simple terms, it judges “whether it’s suitable to buy now” through two dimensions, with specific ranges clearly defined:
Value < 0.45: Bottom-buying range, a stage where "investing with eyes closed won't lose";
0.45~1.2: Fixed investment range, suitable for gradually buying and accumulating;
1.2~5: Waiting for take-off range, those holding coins can be patient;
Value > 5: Don’t blindly invest, wait for a pullback.
I specifically drew standard lines on the K-line.
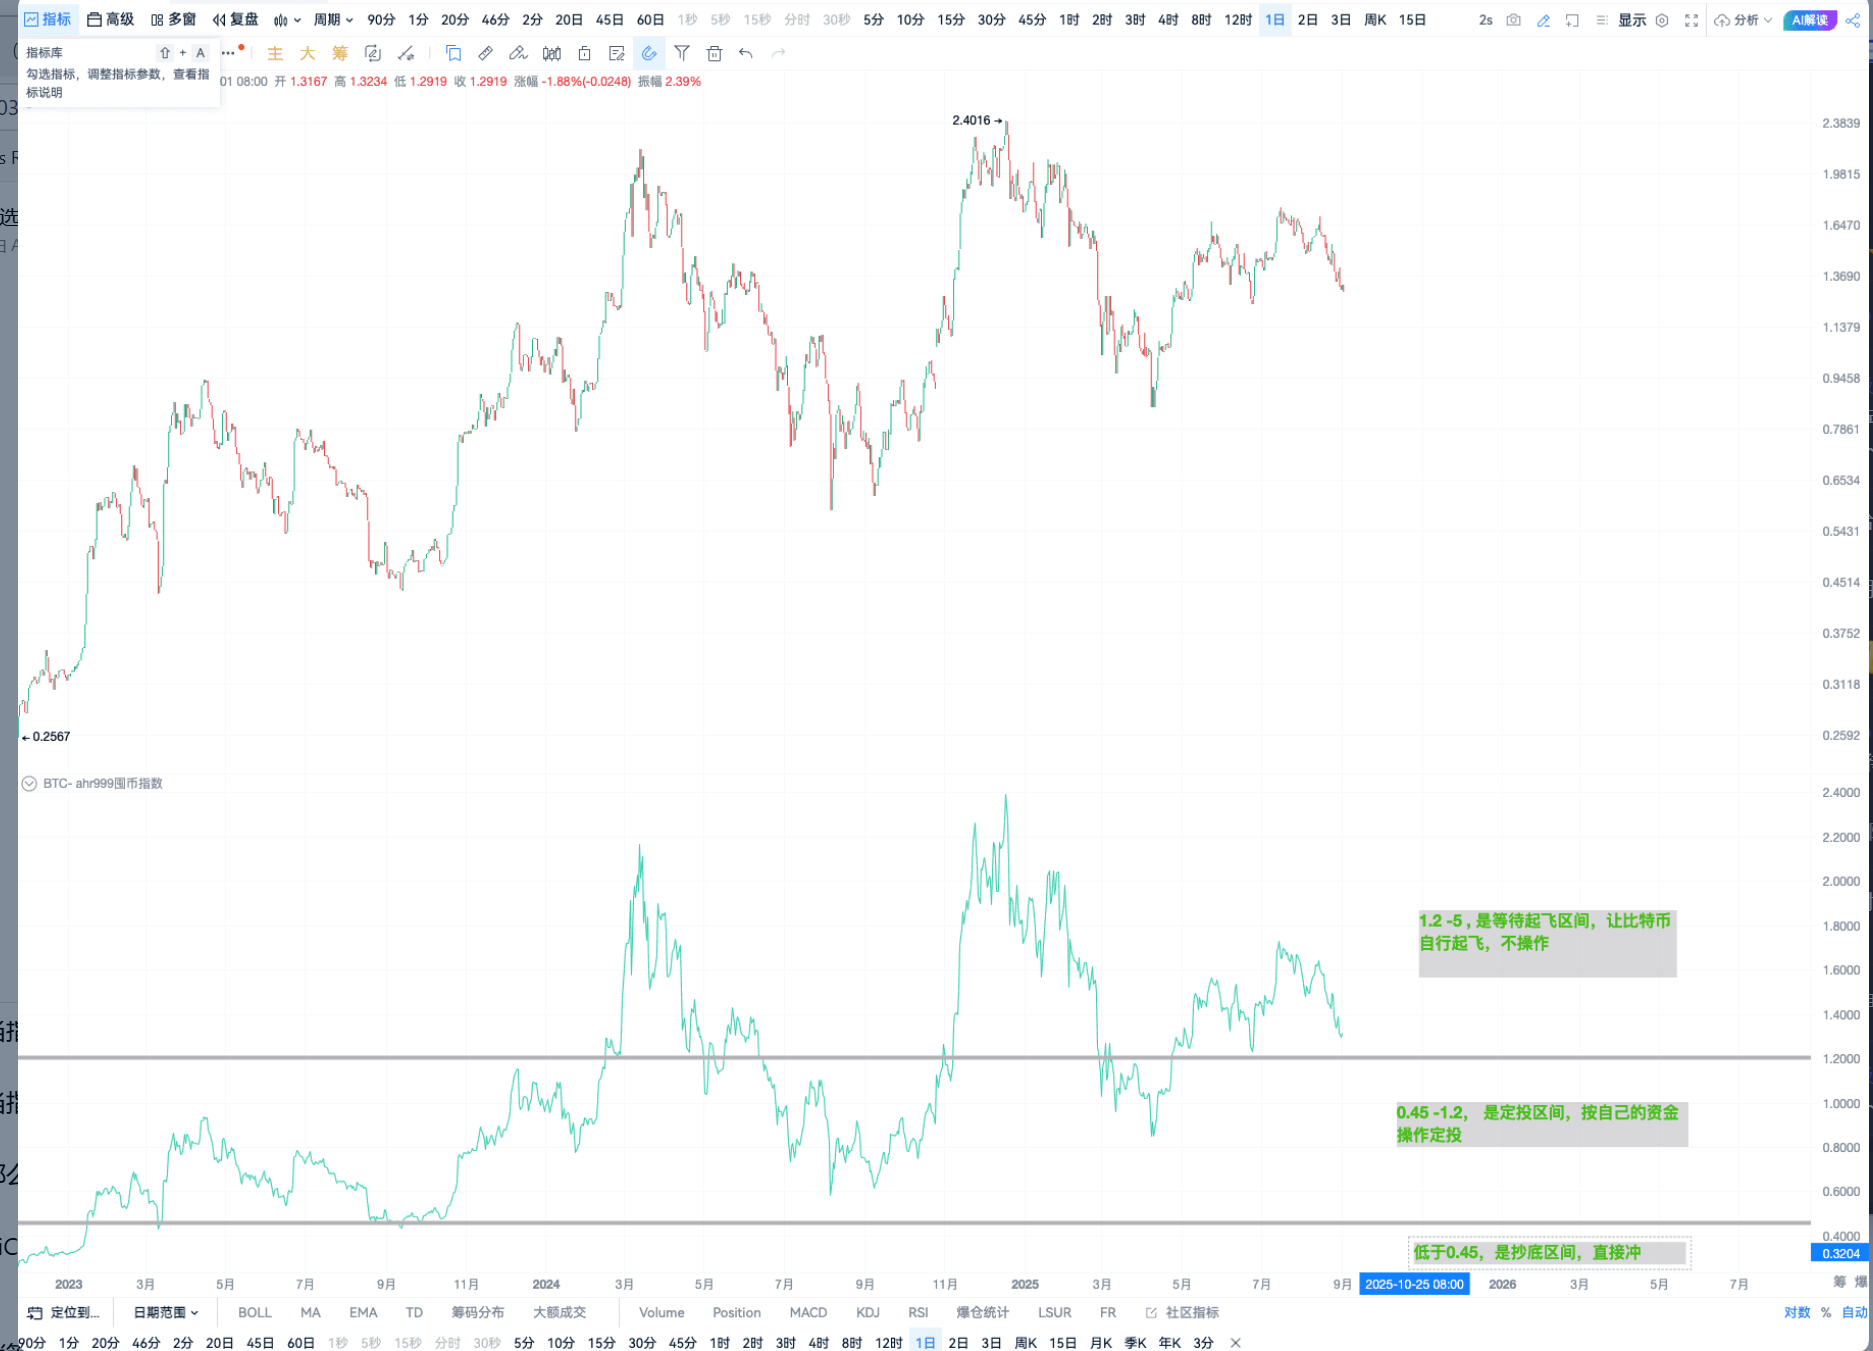
Everyone can see.
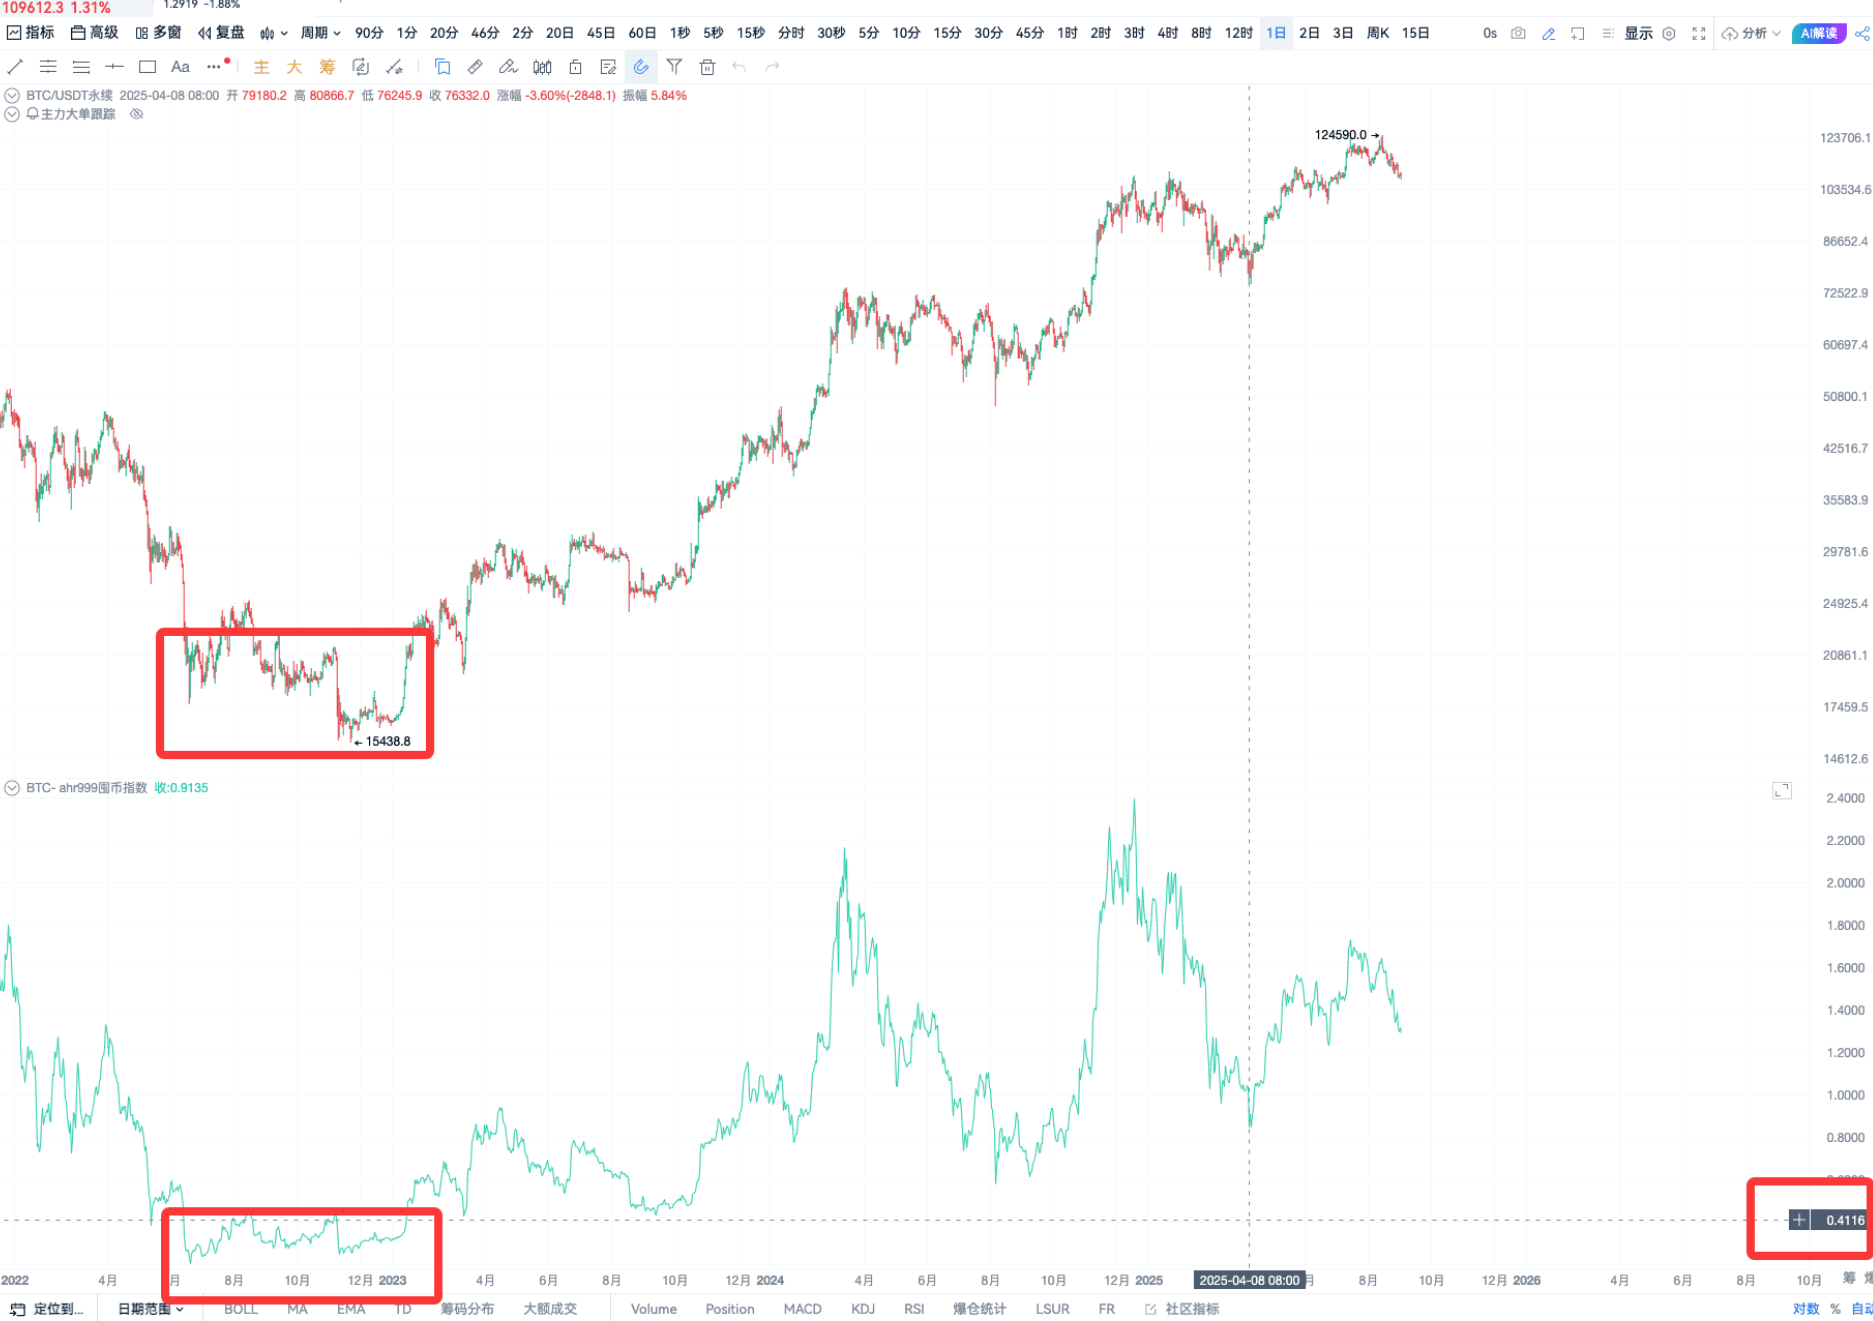
This period just happens to fall within the bottom-buying range. If you invest at this time, it’s basically "a no-brainer" to be stable;
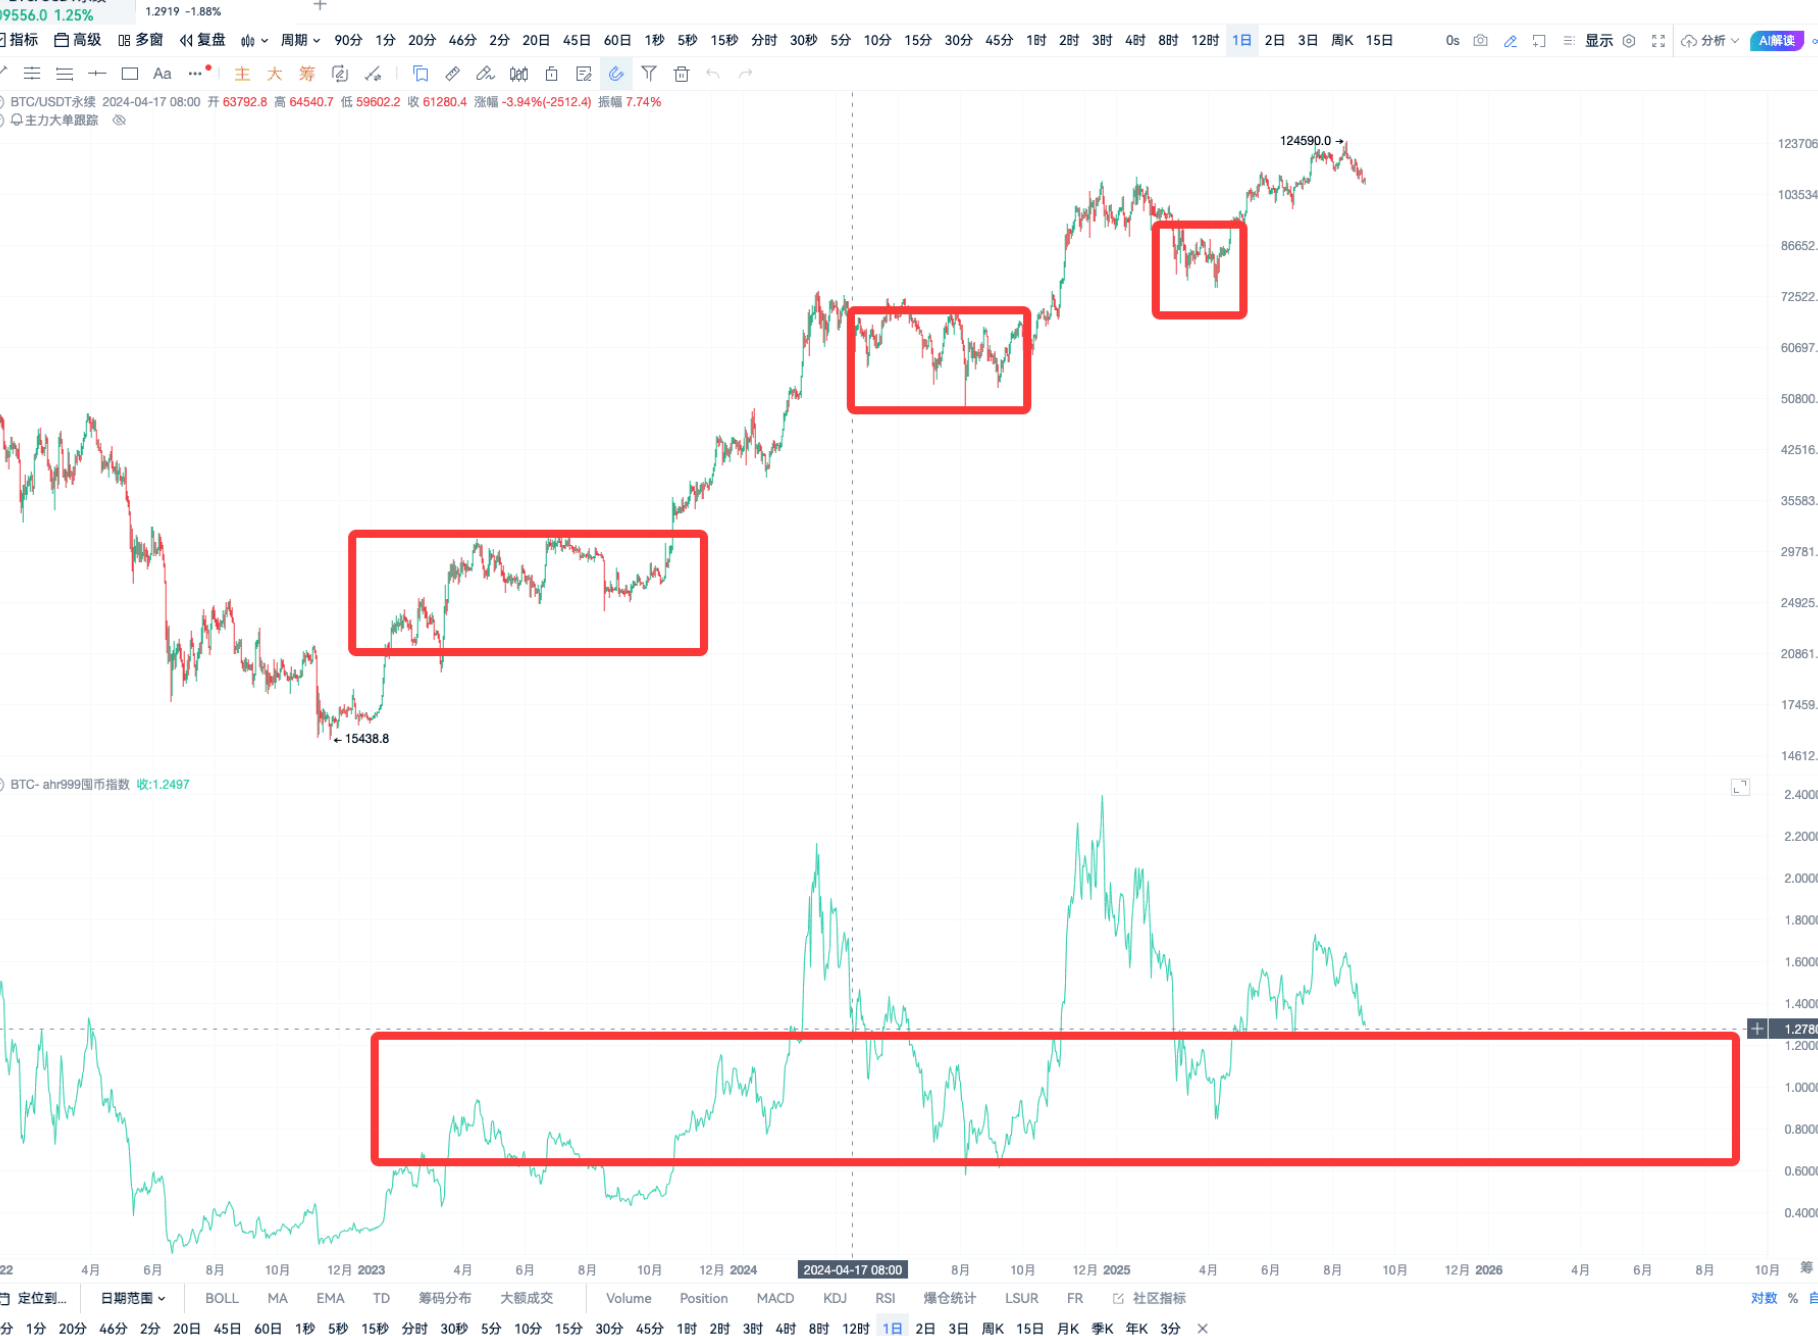
Looking again, this segment is a typical fixed investment range, suitable for those who don’t want to gamble on the short term. The live broadcast time is limited; otherwise, I really want to read the original text written by the author in 2018 word for word with everyone. It’s truly wonderful, and I recommend everyone to check it out. Here’s a screenshot of his prediction.
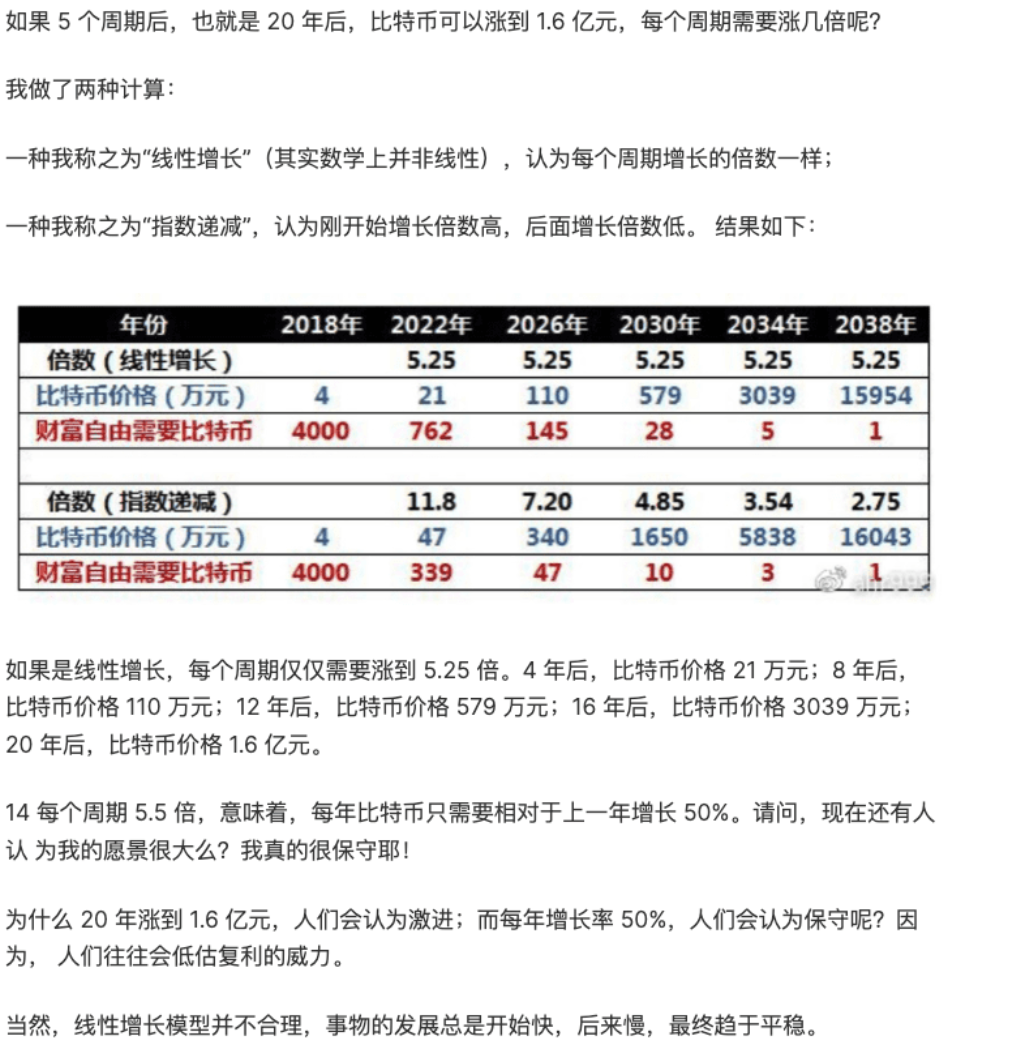
Let’s wait together until 2026 to see if we can achieve the goal of 150,000 USD!
After discussing the "peace of mind" of long-term fixed investment, let’s get into something exciting — the index arrangement suitable for contract players!
The first must-watch index for contracts: OKX-BTC Long/Short Position Ratio. AiCoin has already listed this index separately.
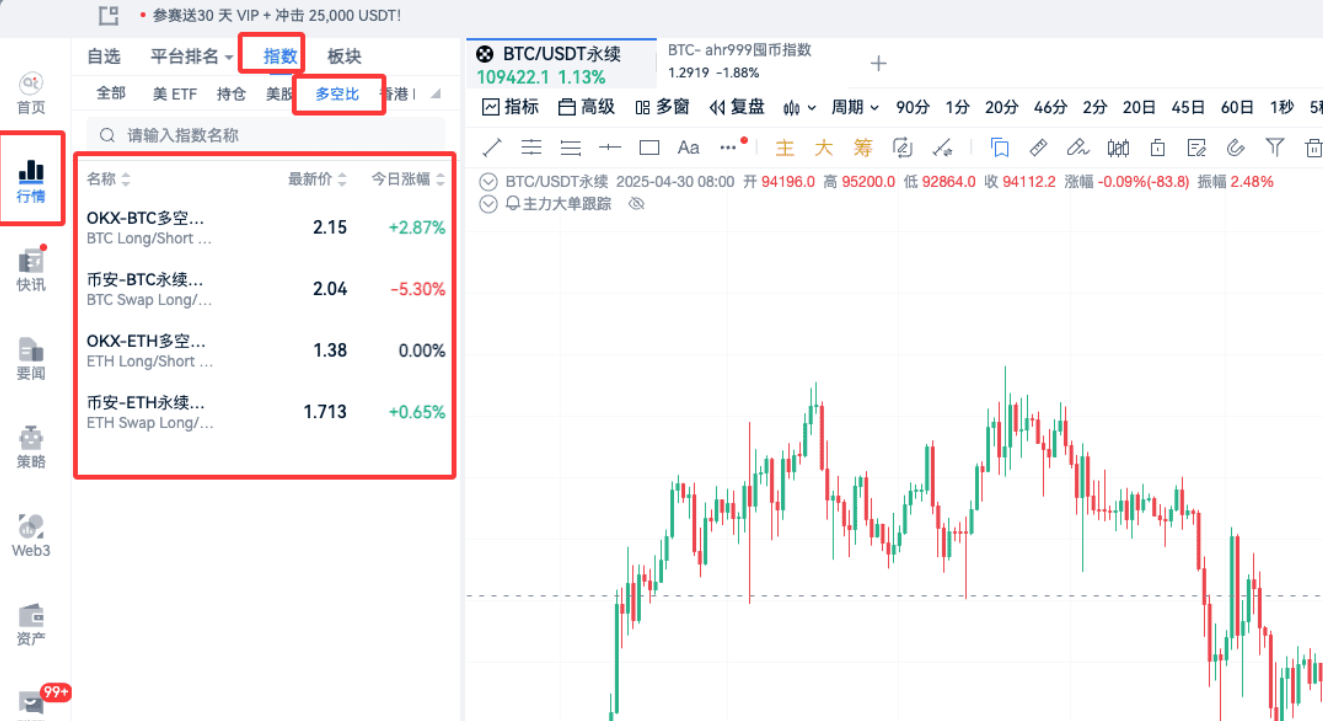
I suggest everyone focus on the BTC and ETH long/short ratios from two platforms: OKX and Binance, as they are the most reliable.
Let me explain what this index means.
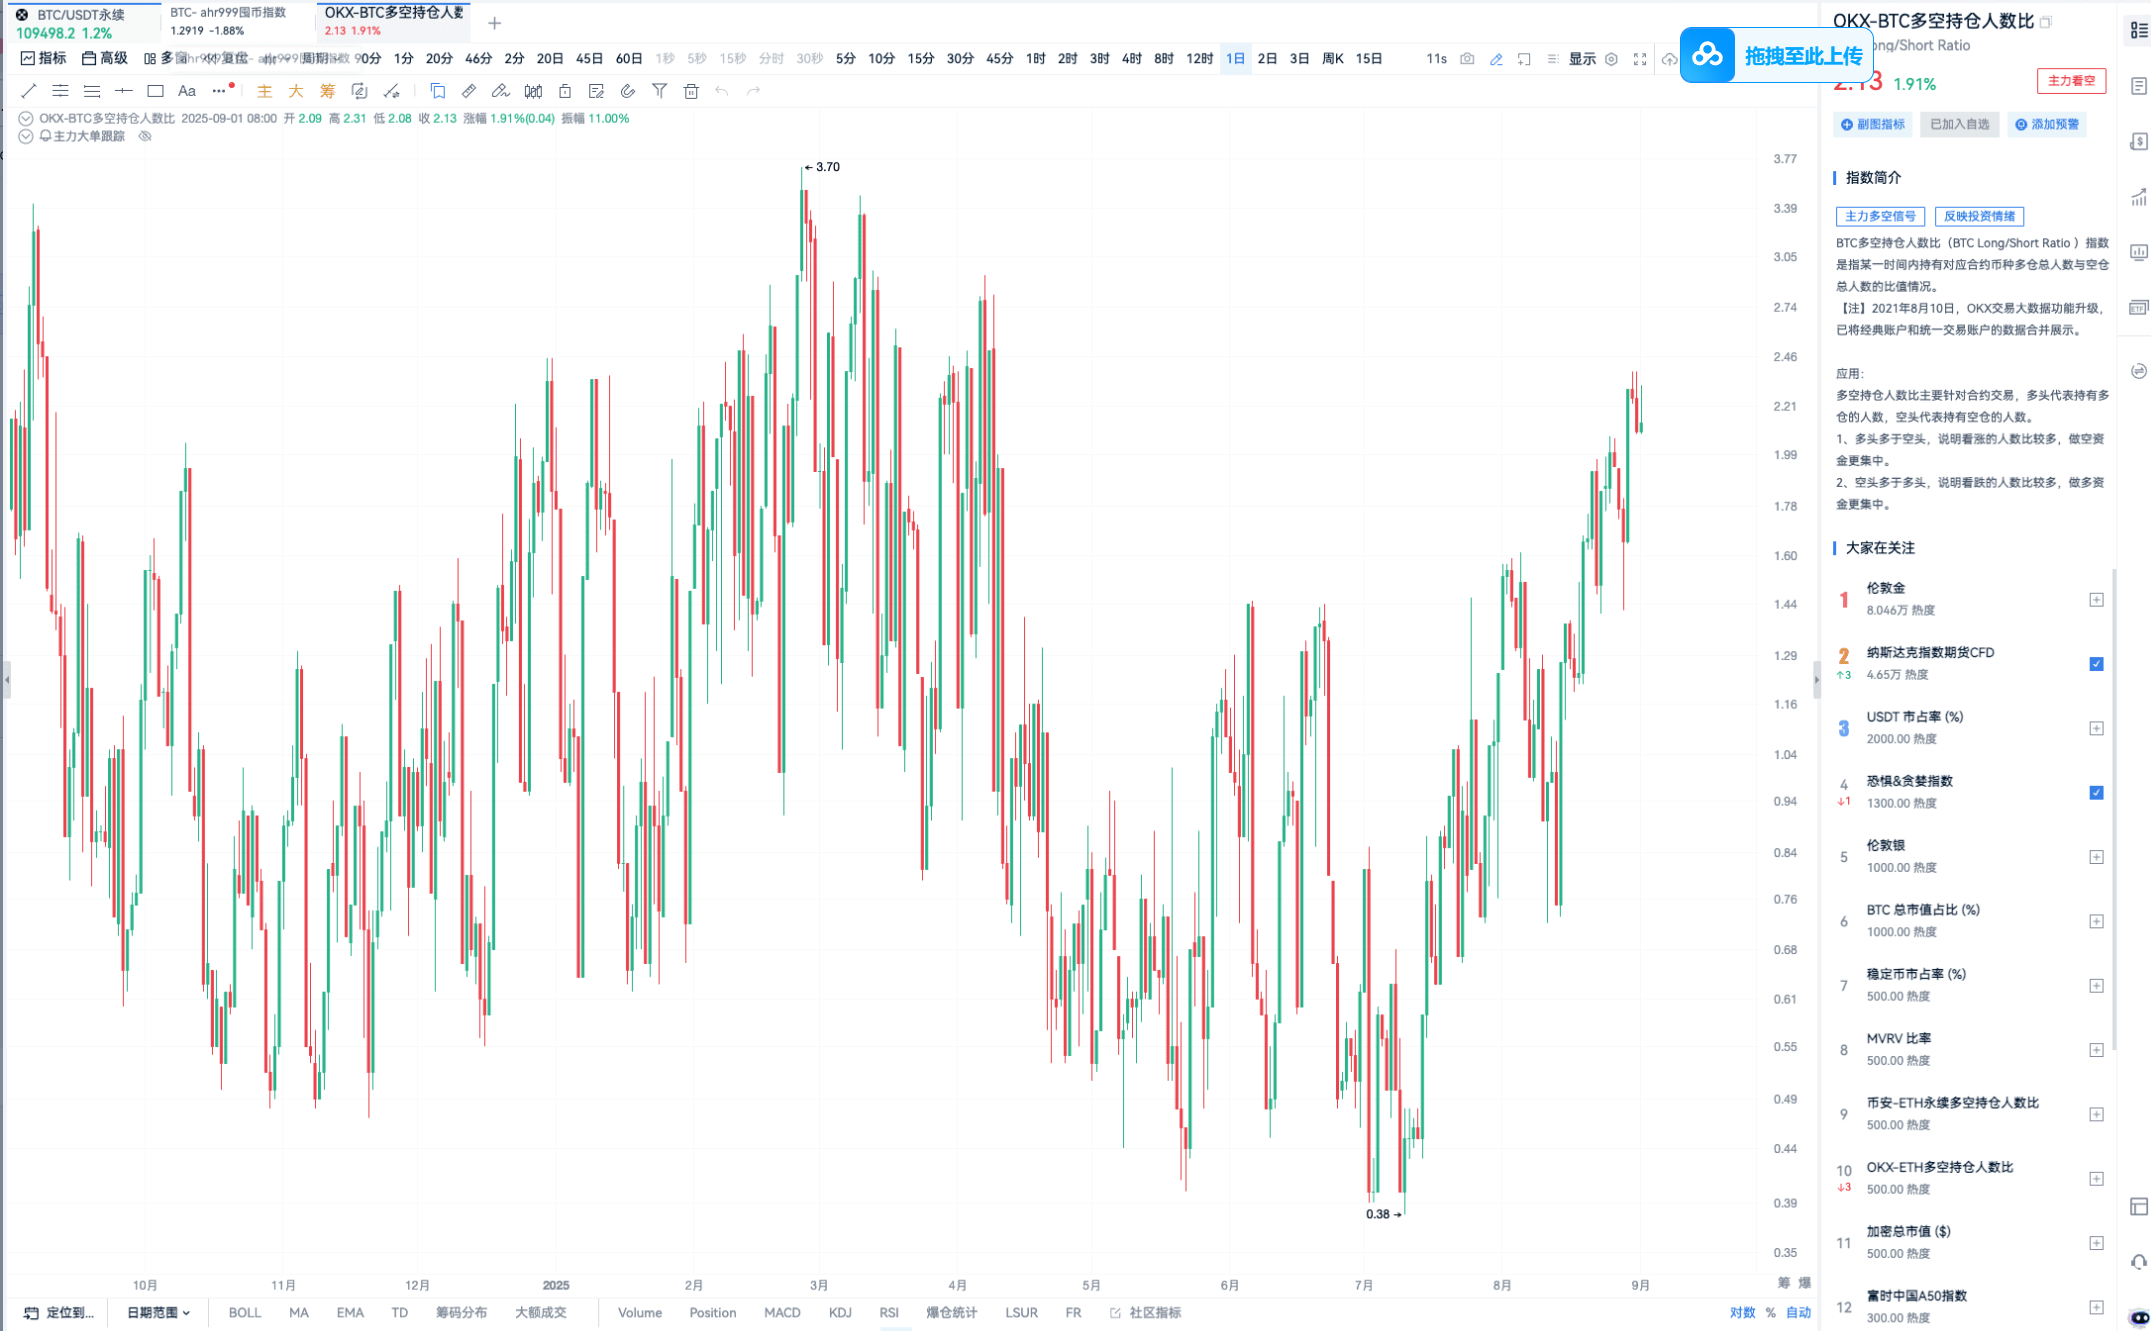
In simple terms, it’s the ratio of the total number of people holding long positions in BTC to the total number of people holding short positions at a certain moment. For example, if there are more long positions than short positions, it indicates that more people are bullish; conversely, if there are more short positions, it indicates a bearish sentiment. But I’ll summarize a more practical rule for you — the larger the long/short ratio, the more likely the market is to crash; the smaller the long/short ratio, the more likely the market is to surge.
According to the tracking by the AiCoin Research Institute, this index has a "warning value": if the long/short ratio on OKX (i.e., LSUR) is between 0.9 and 1.2, a surge is likely; if it’s between 2 and 3, be cautious of a crash.
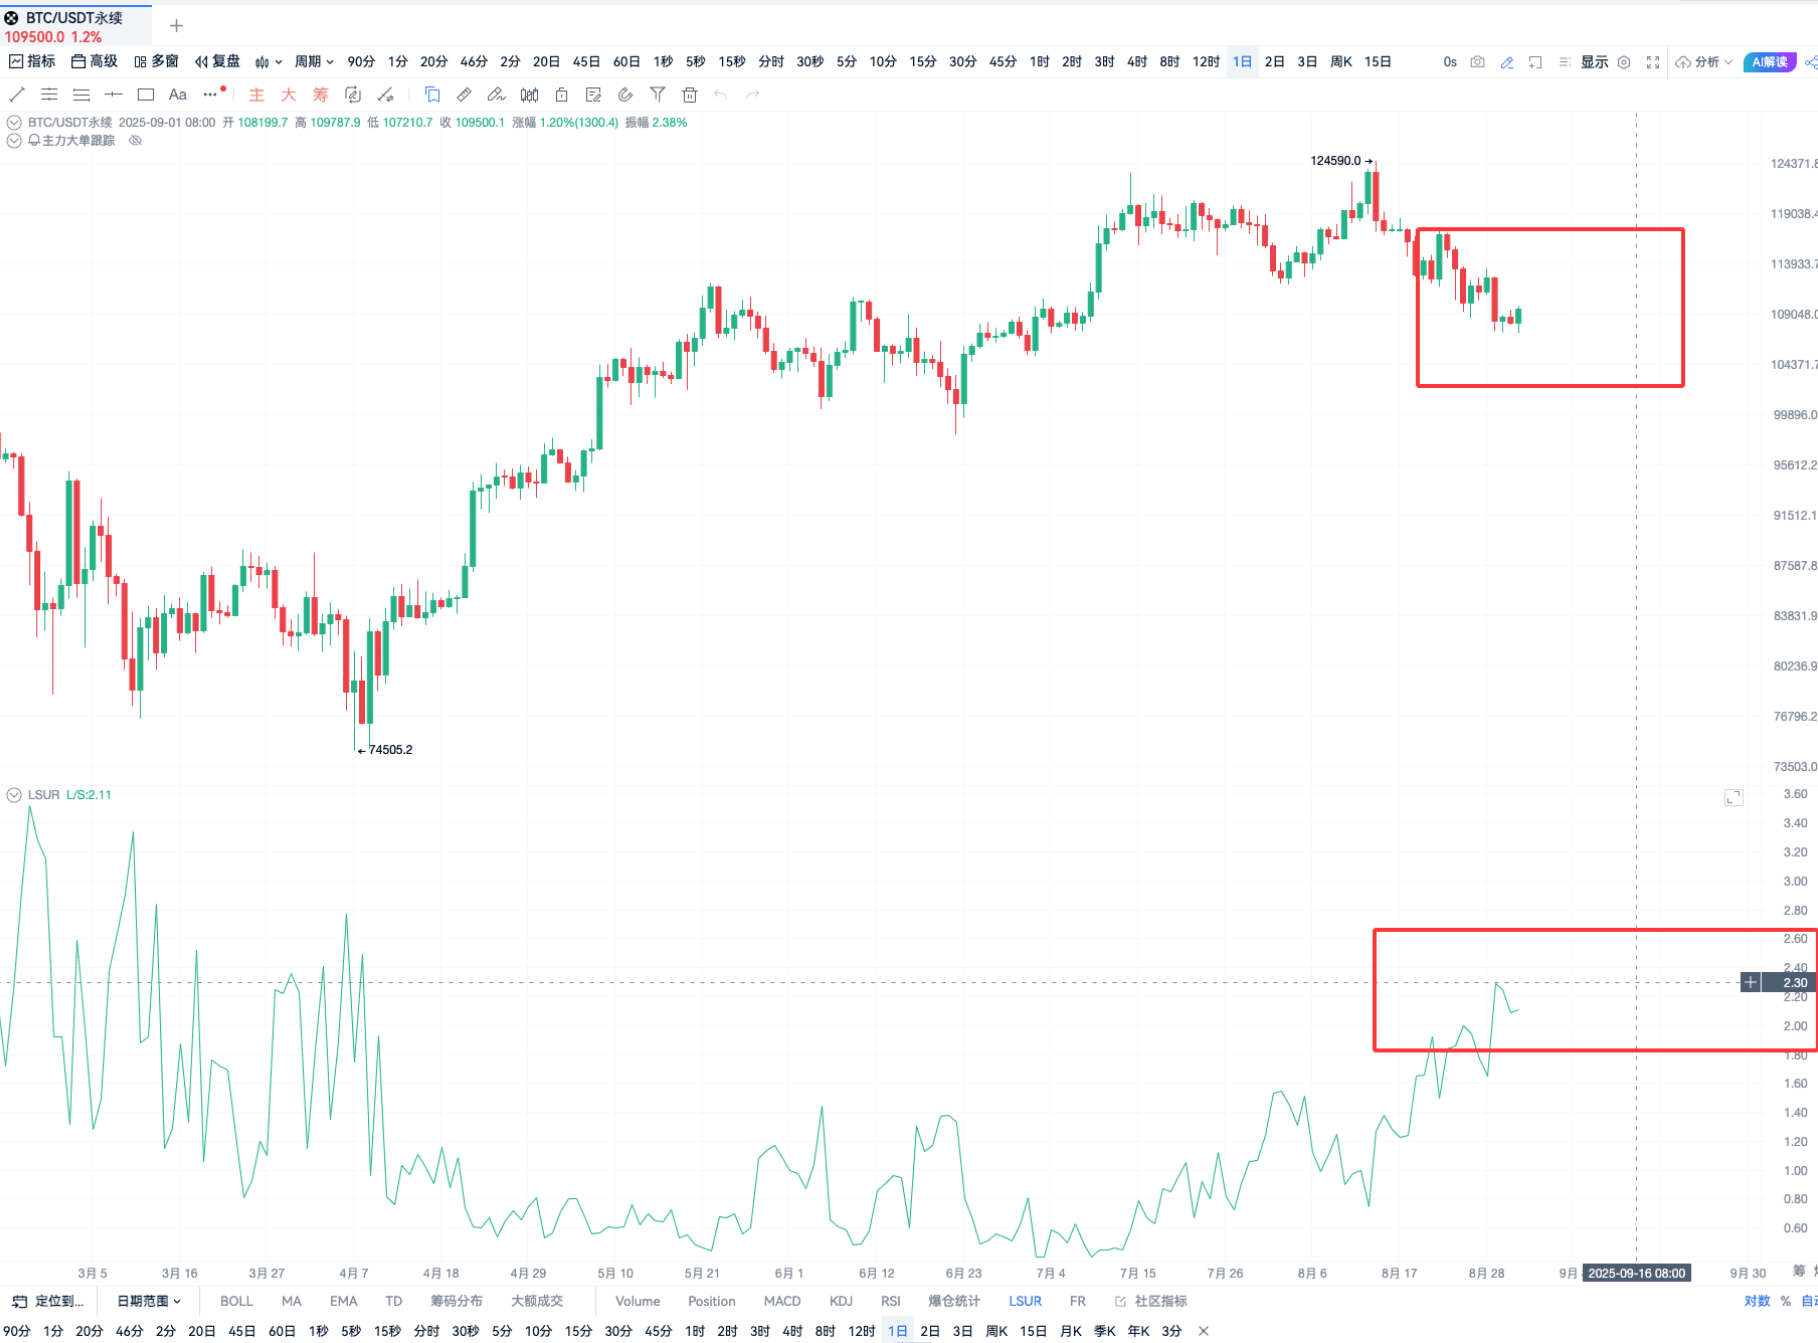
Like ahr999, it can also be added to the K-line to see its correlation with price trends.
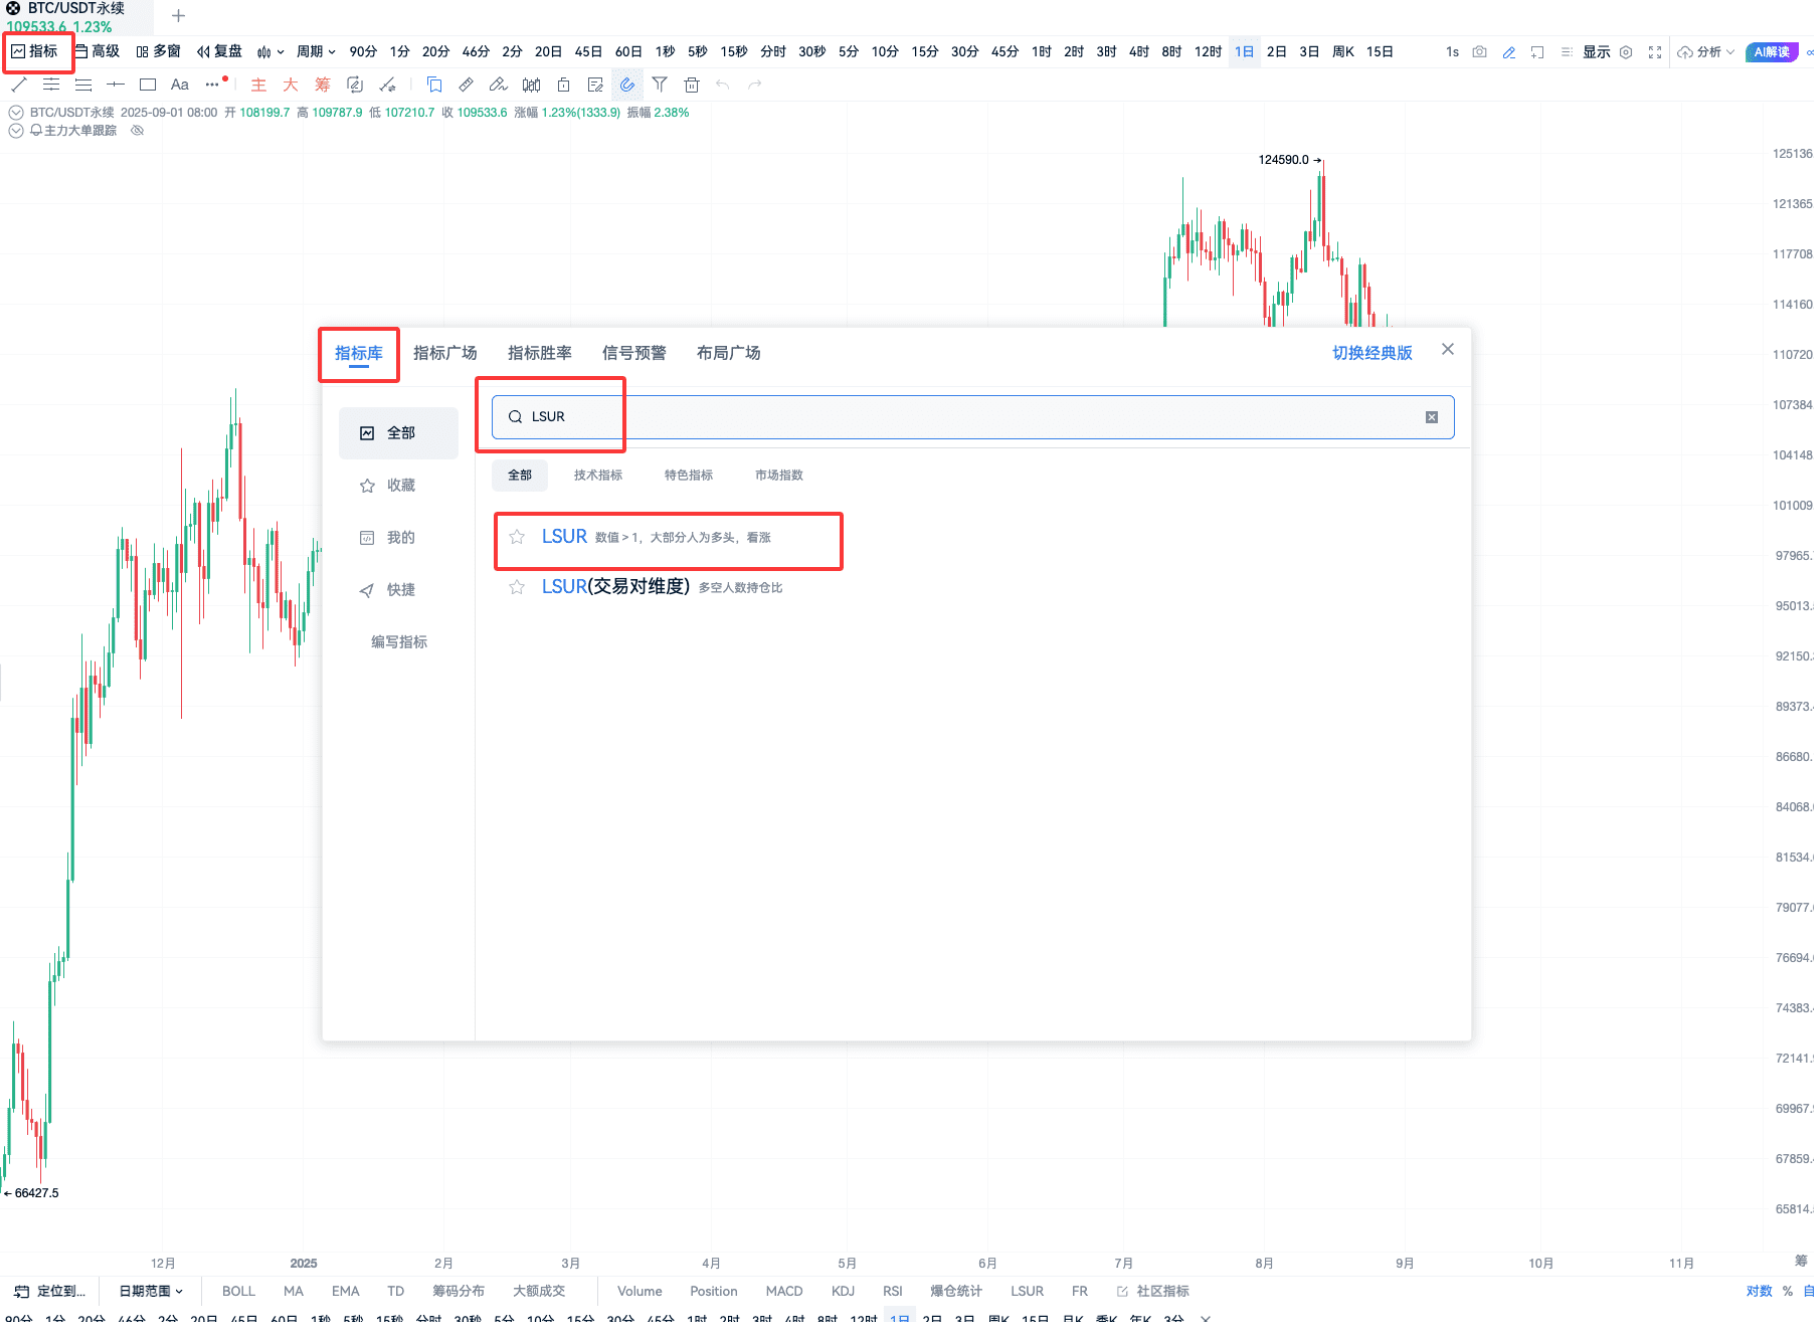
This index is particularly famous in the contract circle. Friends who have been doing contracts for a long time can definitely use it as a "weather vane."
However, I must remind you: looking at this index now is not a good time to go long, as it’s easy to get "buried."
So when trading contracts, you must pay attention to the main force's movements. Besides the long/short ratio, you can also look at "main force large orders" — real-time funding order data, which is intuitive and timely, helping you see whether the main force is buying or selling.
If you feel that watching contracts is too exhausting and you’re not confident in competing with the main force, I still advise you to look back at ahr999 — as the author said, separate HODLing BTC from work and life, and invest gradually. After ten or twenty years, you might thank your current self for making the right choice. This kind of "difficult but correct" thing, although it takes time to yield returns, can outperform most people who chase highs and cut losses.
Finally, let me share a "real-time sentiment mirror" — Fear and Greed Index.
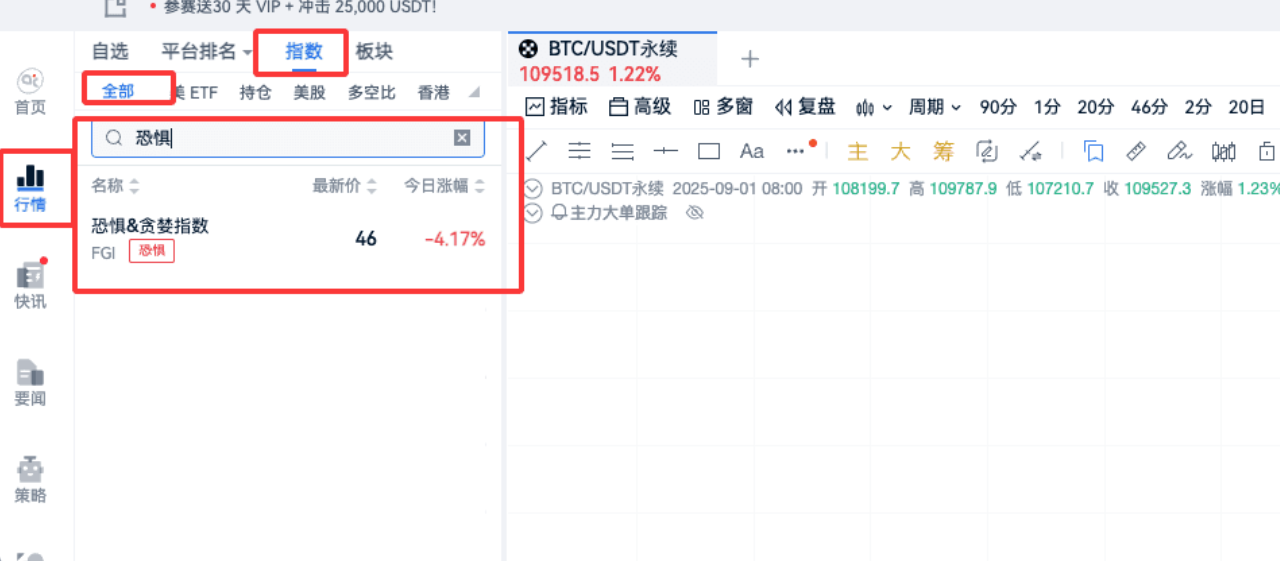
You can find its complete definition and real-time data in AiCoin. We all know that the crypto circle is particularly emotional: when prices rise, everyone fears missing out and buys more as it goes up (greed); when prices fall, they panic and sell regardless of the price (fear), which is simply "chasing highs and cutting losses." This index helps you escape the emotional trap.
Let me give you a simple grading system that’s easy to understand:
0~25: Extreme Fear
26~44: Fear
45~55: Neutral
56~74: Greed
75~100: Extreme Greed
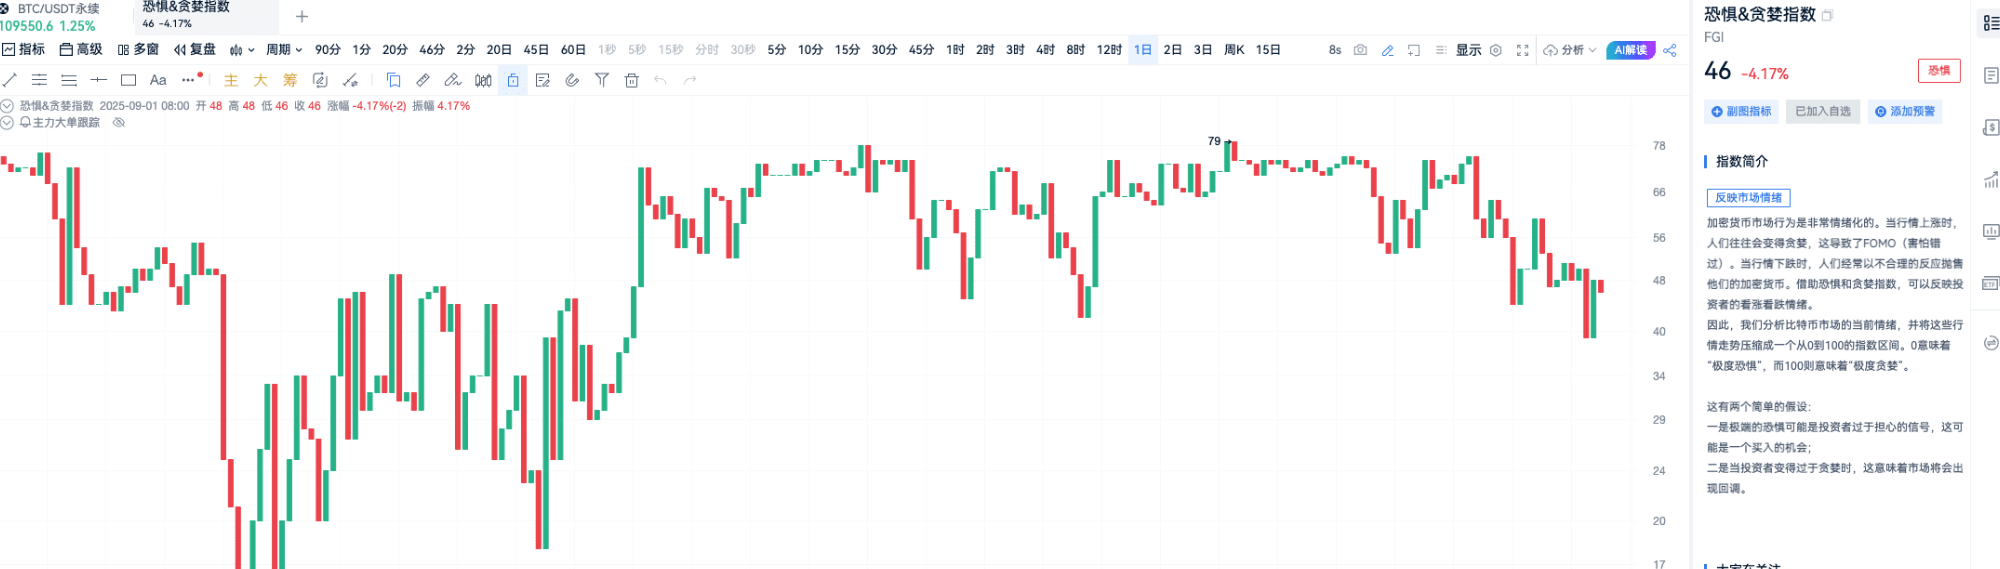
You don’t have to wait for others to say "even the vegetable vendor is talking about BTC before exiting" — after all, not everyone goes to the vegetable market; just looking at this index is enough. The core usage can be summed up in one sentence: be greedy when others are fearful, and be fearful when others are greedy. For example, when the index reaches "extreme fear," you can consider gradually positioning yourself; when it reaches "extreme greed," you should think about whether it’s time to reduce your holdings.
That’s all for the three indices! You can add these three indices to your watchlist like I do. You don’t need to monitor the market 24/7; after buying and holding, checking these data points is much more reliable than guessing the market blindly. If you plan to invest in the crypto space long-term, I strongly recommend reading the original text by ahr999. It’s not long; you can finish it in a few hours, and it will help you establish a more stable long-term mindset.
Finally, here’s a little tip: create a new group in AiCoin specifically for these three indices.
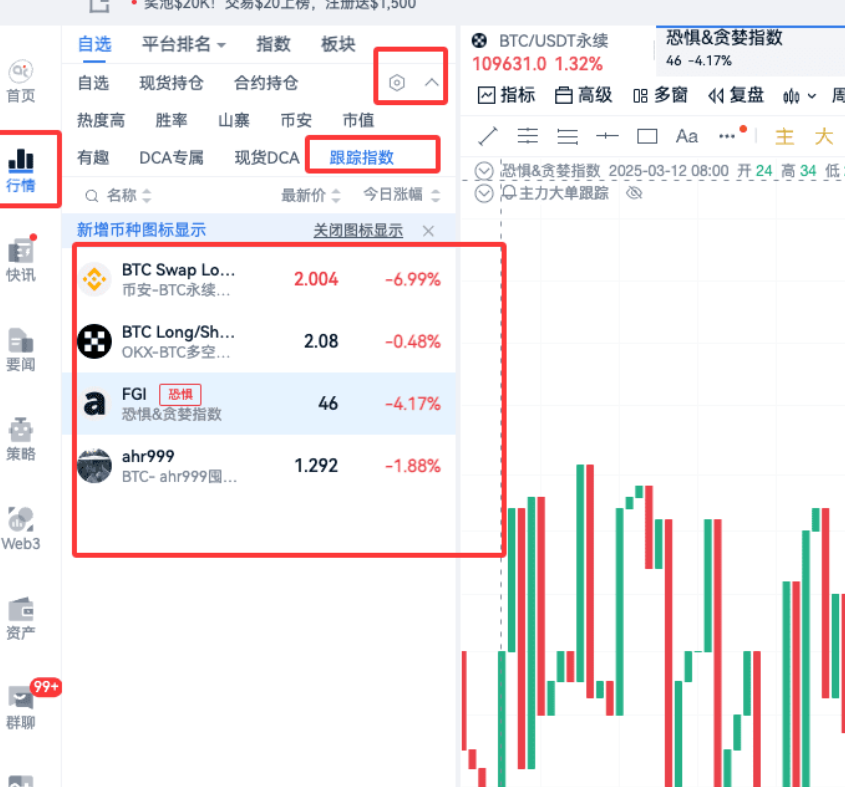
When you want to check them, you can access them with just one click, without having to search everywhere. That’s it for today’s valuable content. I hope everyone can use these three indicators to see through the BTC market, avoid pitfalls, and make more money!
This article only represents the author's personal views and does not represent the stance and views of this platform. This article is for information sharing only and does not constitute any investment advice to anyone.
免责声明:本文章仅代表作者个人观点,不代表本平台的立场和观点。本文章仅供信息分享,不构成对任何人的任何投资建议。用户与作者之间的任何争议,与本平台无关。如网页中刊载的文章或图片涉及侵权,请提供相关的权利证明和身份证明发送邮件到support@aicoin.com,本平台相关工作人员将会进行核查。


