Written by: Bitwise
Translated by: AIMan@Golden Finance
Note: Bitwise announced last week that it will release its first long-term capital market assumptions for Bitcoin (Note: Long-term market assumptions refer to predictions about the risks and returns of major global assets over the next 10 to 15 years, which play a key role in the portfolio construction process for professional investors). This is a data-driven report published at the urging of some large financial institutions in the United States. The report outlines Bitwise's predictions for BTC returns, BTC prices, volatility, and correlations with other assets over the next decade. This week, Bitwise released the full research report as follows:
Summary
- We expect the next 10 years to be a strong decade for Bitcoin, driven by three factors: (1) Bitcoin's continued rise as an institutional asset, which should generate sustained net inflows over time; (2) growing demand from institutional investors for exposure to hard assets as an inflation hedge; (3) Bitcoin's new supply is extremely limited and inelastic.
- We predict that Bitcoin will become the best-performing institutional asset over the next decade, with its price rising to $1.3 million by 2035 (a 10-year forward compound annual growth rate of 28.3%). These returns will be accompanied by significant volatility, although this volatility will be lower than historical averages.
- We believe Bitcoin will continue to exhibit low correlation with stocks, bonds, and all other major asset classes.
- We think the historical "four-year cycle" of Bitcoin is no longer applicable, although we caution that Bitcoin may still experience significant drawdowns.
- The greatest risks we foresee come from regulatory and legislative risks due to changes in the political environment, as well as the inherent risks associated with Bitcoin as a relatively new asset with a limited historical record. Other risks, including technological disruption related to quantum computing, while less prominent, are still worth mentioning.
- The models predicting Bitcoin's future returns are not perfect, relatively new, still evolving, and rely on limited data. Therefore, we strive to be conservative. We believe this is appropriate for a new, highly volatile asset.
- The trend: Over the past 16 years, Bitcoin has grown from an unproven concept to a $2.4 trillion asset, increasingly held by some of the world's most respected investors. This is the most challenging step in its growth process—borrowing the phrase from Peter Thiel, the famous "moment from 0 to 1." We believe the next decade will witness Bitcoin's "from 1 to 100."
I. Macroeconomic Assumptions
Bitcoin is primarily a macroeconomic asset. Therefore, macroeconomic conditions are crucial to our long-term capital market assumptions.
Specifically, Bitcoin is often viewed as a digital store of value, or "digital gold." While it has many other uses—and we expect certain payment-related uses to gain attention over the next decade—its role as "digital gold" is central to its investment thesis.
In this regard, the most important macroeconomic factors to consider are those related to debt, deficits, and fiat currency devaluation, as well as the role of the dollar as the world's dominant reserve currency, as these factors play a role in institutional demand for gold-like assets.
We believe these macroeconomic trends are easily predictable. Specifically, we expect major countries, including the United States, to continue accumulating debt at an accelerating pace, and the increasing debt burden will place greater pressure on these economies. As economist Lyn Alden stated, "Nothing can stop this train."
Over the next 10 years, we expect governments to respond to the growing debt burden by devaluing their currencies. As legendary hedge fund investor Ray Dalio wrote in June 2025:
"When national debt is excessive, lowering interest rates and devaluing the currency in which the debt is denominated is the path most likely to be taken by government policymakers, so it is worth betting that this will happen."
1.1 U.S. Debt is Rising Rapidly
The United States is approaching its 250th anniversary, a milestone worth reflecting on. Here are five shocking facts about U.S. debt 250 years later:
01 / In its first 200 years, the U.S. accumulated $650 billion in debt. Today, that number is $36.2 trillion.
02 / Half of all U.S. debt has been accumulated in the past 10 years.
03 / U.S. debt now exceeds $100,000 per capita.
04 / U.S. debt is 120% of GDP.
05 / The annual interest payment on U.S. debt is $952 billion, making it the fourth-largest expenditure in the U.S. budget.
Total U.S. Federal Debt (Trillions)
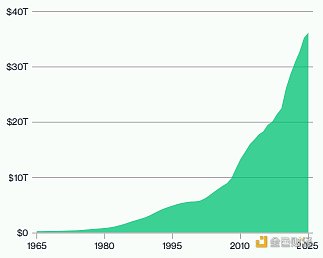
Data Source: Bitwise Asset Management, data from the U.S. Treasury, data date from January 1, 1966, to March 31, 2025.
1.2 DOGE: All Bark, No Bite
Current government spending is exacerbating the situation. The Congressional Budget Office projects that the U.S. deficit will increase by $1.9 trillion this year.
This is shocking to many, as the current U.S. government was elected under a mandate to reduce government spending. In early 2025, President Trump appointed Elon Musk to lead a new entity called the Department of Government Efficiency (DOGE), which promised to cut $2 trillion in government spending. Meanwhile, deficit hawks in Congress talked about reducing the U.S. annual deficit from its current level (over 6% of GDP) to 3% or lower.
None of this has happened. Less than six months later, Musk left the government, DOGE's cuts had little effect, and U.S. government spending reached an all-time high.
Cumulative Total Spending Since Trump's Inauguration Compared to 2023 and 2024 (Trillions)
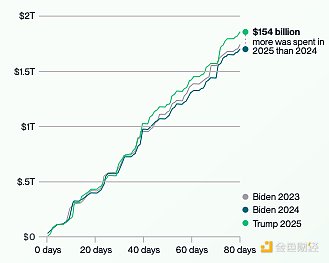
Data Source: The Wall Street Journal and the Treasury Department. Data as of April 11, 2025.
Note: The first day of 2025 is January 20; the dates for 2023 and 2024 align with the weekdays of 2025 and account for leap years.
1.3 Growing Demand for Insurance
We do not believe the U.S. is approaching hyperinflation or other apocalyptic scenarios. Instead, we share the concerns expressed by many leaders—including institutions like JPMorgan and BlackRock, as well as several former U.S. budget directors and chief economists—about the troubling trajectory of rising debt and deficits, which will erode the purchasing power of the dollar over time.
In turn, these trends may increase demand for hedging tools like gold and Bitcoin, which are not fiat currencies. The recent performance of these hedging tools—both have outperformed all other major assets since 2020—indicates that investors are preparing for this changing world.
We do not need to see catastrophic hyperinflation for the value of inflation hedging tools to rise significantly. This perspective is reflected in our price predictions.
Performance of Bitcoin Compared to Major Asset Classes Since 2020
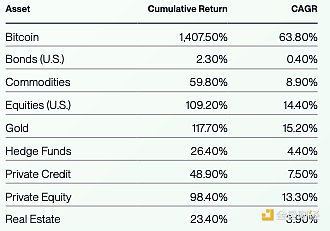
Data Source: Bitwise Asset Management, data from Bloomberg. Data date from January 1, 2020, to June 30, 2025.
Asset classes represented as follows: Bitcoin: Bitcoin spot price. Commodities: Deutsche Bank DBIQ Optimum Yield Diversified Commodity Index Total Return. Gold: Gold spot price. Hedge Funds: Bloomberg Macro Hedge Fund Index. Private Credit: Indxx Private Credit Index. Private Equity: S&P Listed Private Equity Total Return Index. Real Estate: MSCI U.S. REIT Total Return Index. U.S. Bonds: Bloomberg U.S. Aggregate Bond Index. U.S. Stocks: S&P 500 Total Return Index.
1.4 Reserve Assets, Central Bank Purchases, and a Changing Global Order
Another important macroeconomic trend to watch over the next decade is the shift in the dollar's role as the world's dominant reserve currency.
Data indicates that the dollar's dominance is waning. This trend is reflected in the declining share of the dollar in global central bank reserves, the declining share of the U.S. in global GDP, and recent central bank purchases of alternative assets (primarily gold).
We do not argue that the dollar will inevitably lose its role as the world's leading reserve currency. Rather, the data suggests that its dominance is declining over time, creating space for alternative assets and currencies to play a larger role.
We believe Bitcoin has a strong opportunity to carve out a place for itself in this alternative asset feast over the next decade. A number of countries, including the U.S., now hold Bitcoin, and this number has increased over the past year. As Bitcoin is more functional than gold in certain respects (easier to store, transport, and verify), it may compete with gold over time to become one of the preferred hard assets held by central banks and governments.
As the world moves toward a more complex, multipolar future, we believe multiple global reserve assets will emerge. We see Bitcoin as having a good chance of becoming one of these assets, a view reflected in our long-term price predictions.
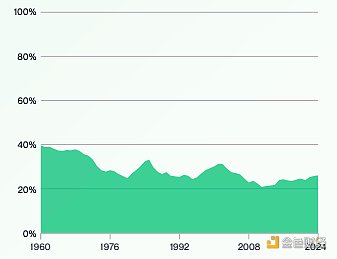
Dollar's Share in Global Foreign Exchange Reserves
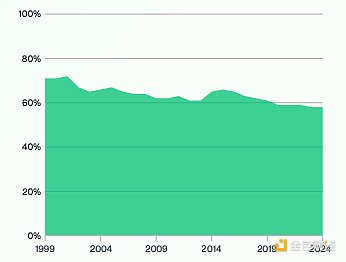
Data Source: Bitwise Asset Management, data from the International Monetary Fund (IMF). Data as of December 2024.
U.S. Share of Global GDP
Data Source: Bitwise Asset Management, data from the World Bank. Data as of December 31, 2024.
Central Bank Net Purchases of Gold (Tons)
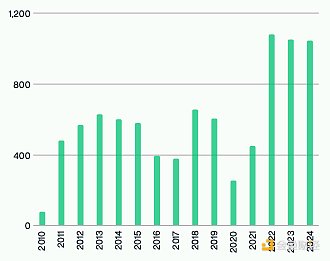
Data Source: Bitwise Asset Management, data from the World Gold Council. Data as of December 31, 2024.
1.5 Regulatory Assumptions
Over the past year, the global regulatory outlook for cryptocurrencies has significantly improved.
The main catalyst has been the 2024 U.S. elections, which replaced a government that actively opposed cryptocurrencies with one that openly supports them, reflected in changes in leadership at key agencies such as the Securities and Exchange Commission (SEC), the Office of the Comptroller of the Currency (OCC), the Commodity Futures Trading Commission (CFTC), and the U.S. Department of the Treasury.
However, this trend is not limited to the United States. Positive developments are also emerging in several regions, including the Middle East, China, the UK, and others, albeit at different paces.
The core question investors should ask about regulation is whether the recent positive trend is a long-term secular trend or a temporary partisan swing. In other words, will the trend supporting cryptocurrencies continue regardless of future election outcomes?
We believe the answer is yes.
In the U.S., cryptocurrency is one of the few policy issues that enjoys bipartisan support. Consider the GENIUS Act, which provides a regulatory framework for stablecoins and passed the Senate with a vote of 68 to 30, with 18 Democrats voting in favor. It also passed the House with a similar large margin (308 to 122).
The rarity of such bipartisan voting is worth noting: the GENIUS Act is only the third bill to reach the critical 60-vote threshold during the 2025 congressional session.
There are many reasons for the bipartisan support for cryptocurrencies, including their widespread popularity among younger voters. However, the most important explanation may be that the U.S. financial industry—traditionally a significant donor to the Democratic Party—supports this measure because it is eager to capitalize on the growth and profit opportunities offered by cryptocurrencies.
This profit motive is the core reason we believe cryptocurrency regulation will develop positively: as a broader range of investors and companies enter the cryptocurrency space, it becomes increasingly difficult for politicians to unite against it. Today, nearly every major financial institution in the U.S. has launched significant cryptocurrency initiatives. If BlackRock, JPMorgan, and Morgan Stanley are all heavily investing in cryptocurrencies—along with thousands of American companies and millions of Americans—it is hard to imagine politicians reversing course.
The global situation is similar, with many countries feeling the need to compete in this emerging field.
Our view is that you cannot put the genie back in the bottle: cryptocurrencies have entered the mainstream. This is why we believe the overall trajectory of cryptocurrency regulation over the next decade will be positive.
Institutional Cryptocurrency Adoption
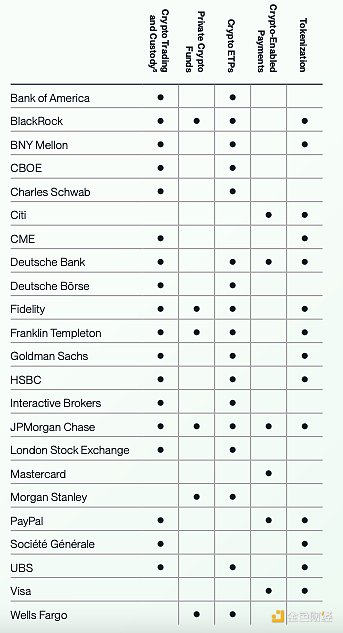
Data Source: Bitwise Asset Management, data from company filings and public statements. Data as of June 30, 2025.
II. Bitcoin Capital Market Assumptions
2.1 Return Assumptions
We believe Bitcoin will become the best-performing major asset in the world over the next decade, achieving a compound annual growth rate (CAGR) of 28.3%.
Our argument is driven by three main factors.
01 / Institutional Demand
Bitcoin is rare among assets because it was led by retail investors in its emergence. In contrast, most emerging assets—such as private equity and private credit—were initially embraced primarily by institutional investors, with retail investors showing interest only in the later stages of these assets' development.
Coupled with Bitcoin's strict scarcity (there will only ever be 21 million Bitcoins), the retail-first nature of Bitcoin creates a unique situation: nearly 95% of all Bitcoins that will ever exist have already been owned—primarily by retail investors—while the allocation ratio for most institutional investors is 0%.
In recent years, various types of institutional investors have begun to allocate Bitcoin on an increasingly large scale. Given that the new Bitcoins produced each year are very few (approximately $18 billion at current prices), these investors have to purchase Bitcoin from existing holders.
The World Bank estimates that institutional investors control approximately $100 trillion in total assets. Over the next decade, we believe these investors will allocate 1% to 5% of their portfolios to Bitcoin, meaning they will need to purchase between $1 trillion and $5 trillion worth of Bitcoin.
This has already begun: Bitcoin ETPs currently hold $170 billion in assets. But this is just a small down payment on the total investment required.
We believe this growing purchasing pressure will create sustained, long-term demand for Bitcoin, thereby driving up its price.
02 / Limited Supply
As mentioned above, Bitcoin's supply is strictly limited: there will only ever be 21 million Bitcoins. Additionally, the vast majority of Bitcoins have already been owned, with 19.9 million Bitcoins currently in circulation (94.6%).
Bitcoin's annual inflation rate is only 0.8% and will drop to 0.4% in 2028 and 0.2% in 2032 (based on the scheduled issuance plan, which halves the new issuance every four years). In contrast, the annual inflation rate of gold supply fluctuates between 1% and 2%.
Importantly, Bitcoin's supply is inelastic: any changes in demand for Bitcoin or its price will not lead to the production of more Bitcoins, which is different from gold, oil, or other major commodities.
The collision of massive institutional demand with limited, inelastic supply provides a straightforward economic rationale for our argument.
03 / Growing Concerns About Fiat Currency Devaluation
The backdrop for the growth in institutional demand is the increasing global concern over debt, deficits, and fiat currency devaluation, leading to a scramble for alternative exposures to hedge fiat currency risks.
As legendary hedge fund investor Paul Tudor Jones wrote in a 2020 article titled "The Great Monetary Inflation," which advocated for purchasing a basket of hard assets: "The best profit-maximizing strategy is to own the fastest horse. If I were forced to make a prediction, I would bet on Bitcoin."
U.S. federal debt has increased by $13 trillion over the past five years, now reaching $36.2 trillion. The annual interest payments on this debt are now $952 billion, making it the fourth-largest expenditure in the U.S. budget. Worse, interest rates now exceed expected GDP growth, making it more difficult to slow the growth of debt in the future.
The combination of these three factors—institutional demand, limited supply, and growing concerns about fiat currency devaluation—enables Bitcoin investors to benefit as Bitcoin captures an increasing share of the value storage market, which is also expanding in size.
Market Valuation Forecasts
Models predicting Bitcoin's future value are relatively new and still evolving. The academic literature is limited, and there is no consensus on the best approach.
Our preferred long-term valuation model is the Total Addressable Market (TAM) model, which aims to estimate the future size of the market that Bitcoin can serve and its expected future penetration in those markets. Given Bitcoin's fixed long-term supply, this model allows us to estimate the future value of the asset.
Bitwise Bitcoin Valuation Model
We believe Bitcoin has the potential to compete in multiple markets. This includes non-sovereign value storage markets like gold, as well as corporate treasury markets, national treasury reserve markets, and more.
The table below provides context using bear, baseline, and bull market scenarios, highlighting the projected size of each market in 2035 and our expectations for Bitcoin's penetration of that market at that time.
To be conservative, when calculating future prices under different penetration rates, we used Bitcoin's long-term total supply of 21 million, even though not all of this supply will be in circulation by 2035 (and assuming a significant portion has been lost).
An important input to this model is our forecast of the size of each market category in 2035. In most cases, we derive this estimate by examining the historical growth rates of that asset category over the past decade and then extending that growth rate into the next 10 years. Notably, even relatively slow growth rates can compound significantly over a decade. For example, we predict that the size of institutional investment assets will nearly double, despite its historical compound annual growth rate being relatively modest at 5.6%.
Readers may also notice that in our model, the value storage market grows significantly from $29 trillion to $92 trillion. This reflects the continuation of the market's growth rate over the next 10 years. We believe this estimate may be conservative, given our expectation of increased concerns about fiat currency devaluation over the next decade (and thus increased interest in fiat hedging tools).
We could not find an accurate historical estimate of the offshore wealth market size. Therefore, we applied a simple 3.0% compound annual growth rate to that market.
For the purposes of our long-term capital market assumptions, we rely on the baseline scenario, which we believe is the most likely outcome. We include bear and bull market scenarios to reflect market uncertainty.
Bitwise's Bitcoin Valuation Framework
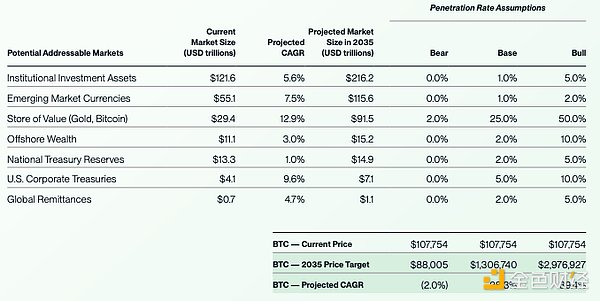
Data Source: Bitwise Asset Management, data from Bloomberg, IMF, World Bank, BCG, APMEX, Carfang Group, EU Tax Observatory; Bitcoin price as of June 30, 2025. The cutoff dates for current market sizes vary, resulting in different CAGR timeframes for the 2035 projections.
The Bitcoin valuation framework and price targets are for illustrative purposes only and are not predictions of future outcomes. This material represents an assessment of the market environment at a specific point in time and is not intended to predict future events or guarantee future results.
Forecasts
Our baseline scenario predicts a value of $1,306,740 per Bitcoin by 2035, equivalent to a 28.3% compound annual growth rate from current levels. This represents a significant decline from the previous 10-year and 5-year compound annual growth rates (82.5% and 63.8%, respectively), but remains high compared to Wall Street's forecasts for traditional assets such as stocks, bonds, real estate, and others.
We note that our predictions are relatively close to estimates from other leading cryptocurrency analysts, including Alliance Bernstein (which predicts Bitcoin will exceed $1 million by 2033) and Standard Chartered (which predicts Bitcoin will exceed $500,000 by 2028). Our predictions are more conservative than those from ARK Invest (which estimates $1.5 million to $2.5 million by 2030) and Strategy (which estimates $2.1 million by 2046).
Regarding other viewpoints, we review other widely cited Bitcoin valuation models in the appendix.
Why Does Bitcoin Have Value?
One common question critics ask about Bitcoin is: why does it have any value? After all, Bitcoin does not generate cash flow.
We believe the answer is simple.
We view Bitcoin as providing a service: the ability to store wealth in digital form without relying on banks or governments. The more people want this service, the more valuable Bitcoin becomes. The fewer people want this service, the lower Bitcoin's value. If no one wants this service, Bitcoin's value is zero.
This is no different from any other service.
The distinction lies in how value accumulates. For traditional software providers, users who want their service pay an annual subscription fee to the company. For Bitcoin, you cannot pay a subscription fee. After all, there is no "Bitcoin company." Instead, the only way to access the service is to purchase Bitcoin. If you buy Bitcoin, you gain access to this service—the ability to store wealth in digital form without a bank.
Now, more and more people want the service that Bitcoin provides. This is why it has been the best-performing asset over the past decade.
We believe that in the future, even more people will need this service as Bitcoin continues to mature and demand for non-sovereign assets grows. We are optimistic about the implications for Bitcoin's future price.
2.2 Correlation Assumptions
Bitcoin has a very low long-term correlation with other major assets. Over the past 10 years, its average correlation with different asset classes has been:
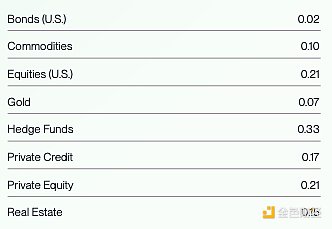
Data Source: Bitwise Asset Management, data from Bloomberg. Data dates from June 30, 2015, to June 30, 2025.
The asset classes are represented as follows: Bitcoin: Bitcoin spot price. Commodities: Deutsche Bank DBIQ Optimum Yield Diversified Commodity Index Total Return. Gold: Gold spot price. Hedge Funds: Bloomberg Macro Hedge Fund Index. Private Credit: Indxx Private Credit Index. Private Equity: S&P Listed Private Equity Total Return Index. Real Estate: MSCI U.S. REIT Total Return Index. U.S. Bonds: Bloomberg U.S. Aggregate Bond Index. U.S. Stocks: S&P 500 Total Return Index.
Most observers consider any correlation below 0.50 to be "low" correlation.
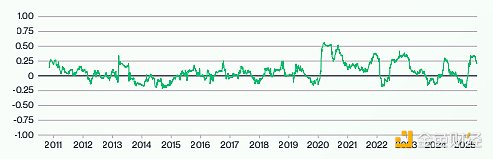
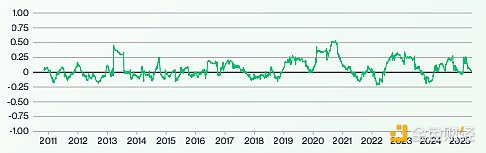
A close examination of how this correlation changes over time is quite revealing. The chart below shows the 90-day rolling correlation of Bitcoin with U.S. stocks since Bitcoin began trading. It indicates that Bitcoin's correlation with U.S. stocks has rarely exceeded 0.50. In fact, despite being labeled a risk asset, its 90-day correlation with U.S. stocks has never reached a "high" level (i.e., above 0.75).
This fact is surprising, as media reports often describe Bitcoin as a "risk asset" with "high correlation to stocks." Some even consider it a "high beta tech investment." These views stem from periods of sharp and negative declines when Bitcoin may have a high correlation with stocks, which is when the media tends to write stories about Bitcoin and correlation.
Consider the following: if you filter for those days in the past 10 years when U.S. stock values fell by 20% or more, Bitcoin averaged a decline of 2.6% on those days. However, it has historically rebounded faster and further than the stock market, which is why its long-term correlation is low.
The gap between the common perception of correlation and the data-driven reality presents opportunities for portfolio builders.
Correlation with Other Assets
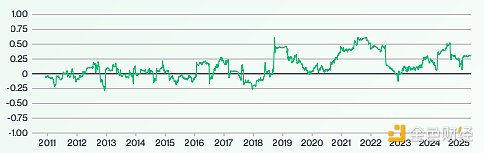
Since its inception, Bitcoin's correlation with bonds has been approximately 0.00, as shown in the chart below.
This is both intuitive and powerful. It is intuitive because the drivers of Bitcoin are different from those of bonds (more on this below). But it is powerful because it means that when Bitcoin is mixed into a portfolio with bonds, it provides a potential diversification tool.
Bitcoin also shows low correlation with a broad range of commodities, real estate, private equity, and private credit indices.
In other words, Bitcoin is a unique asset.
Bitcoin's Correlation with U.S. Bonds (90-Day Rolling)
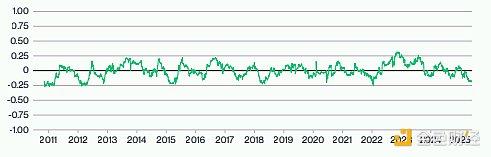
Data Source: Bitwise Asset Management, data from Bloomberg, data dates from July 19, 2010, to June 30, 2025. U.S. bonds are represented by the Bloomberg U.S. Aggregate Bond Index. Note: Correlation between -0.5 and 0.5 is traditionally defined as "low" or "no" correlation.
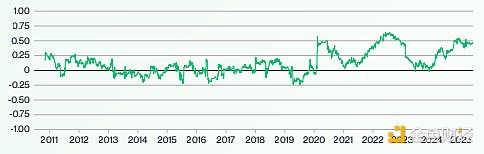
Bitcoin's Correlation with Commodities (90-Day Rolling)
Data Source: Bitwise Asset Management, data from Bloomberg, data dates from July 19, 2010, to June 30, 2025. Commodities are represented by the Deutsche Bank DBIQ Optimum Yield Diversified Commodity Index Total Return. Note: Correlation between -0.5 and 0.5 is traditionally defined as "low" or "no" correlation.
Bitcoin's Correlation with U.S. Stocks (90-Day Rolling)
Data Source: Bitwise Asset Management, data from Bloomberg, data dates from July 17, 2010, to June 30, 2025. U.S. stocks are represented by the S&P 500 Total Return Index. Note: Correlation between -0.5 and 0.5 is traditionally defined as "low" or "no" correlation.
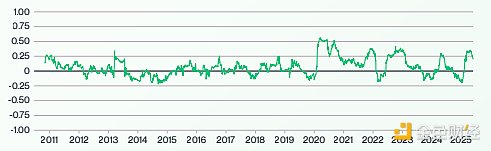
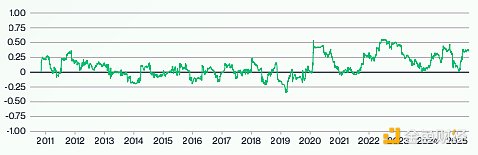
Bitcoin's Correlation with Gold (90-Day Rolling)
Bitcoin's Correlation with Private Credit (90-Day Rolling)
Data Source: Bitwise Asset Management, data from Bloomberg, data dates from September 2, 2013, to June 30, 2025. Private credit is represented by the Indxx Private Credit Index.
Note: Correlation between -0.5 and 0.5 is traditionally defined as "low" or "no" correlation.
Bitcoin's Correlation with Private Equity (90-Day Rolling)
Data Source: Bitwise Asset Management, data from Bloomberg, data dates from July 19, 2010, to June 30, 2025. Private equity is represented by the S&P Listed Private Equity Total Return Index.
Note: Correlation between -0.5 and 0.5 is traditionally defined as "low" or "no" correlation.
Bitcoin's Correlation with Real Estate (90-Day Rolling)
Data Source: Bitwise Asset Management, data from Bloomberg, data dates from July 19, 2010, to June 30, 2025. Real estate is represented by the MSCI U.S. REIT Total Return Index.
Note: Correlation between -0.5 and 0.5 is traditionally defined as "low" or "no" correlation.
Drivers of Bitcoin's Low Correlation with Other Assets
We believe there are two reasons for Bitcoin's low long-term correlation with stocks and bonds.
01 / A One-Time Secular Trend
The first is that Bitcoin is undergoing a one-time maturation process, transitioning from a small ecological asset that many people are unfamiliar with and unproven to a widely held alternative asset. This transition involves millions of investors investing in Bitcoin for the first time, providing an asymmetric inflow that is different from the bidirectional flows that affect most other mature assets. This effect may diminish over time, but it is an important driver of Bitcoin's unique return characteristics.
02 / Different Drivers
The drivers of Bitcoin are different from those of stocks, bonds, and other assets. While stocks and bonds are driven by economic growth, tax rates, geopolitical developments, and technological advancements, Bitcoin is driven by adoption rates, regulatory progress, and concerns about fiat currency devaluation. While there is overlap—e.g., all assets are influenced by monetary and fiscal factors—given the differences in their performance drivers, you would generally expect Bitcoin's returns to differ from those of stocks and bonds.
We believe these two factors will continue to persist in the future. Therefore, we expect Bitcoin's correlation with stocks and bonds to generally remain in the low range of 0.00 to 0.50 over the next decade.
We note that Bitcoin's correlation with stocks has been higher in the post-COVID era, which we attribute to the increasing influence of monetary and fiscal policies on stocks and bonds. As we expect this trend to continue to some extent, we use a stratified weighting approach to increase the weight of recent correlation trends in our forecasts. Using this method, we expect Bitcoin's average correlation with U.S. stocks over the next 10 years to be 0.39.
Using the same method, we expect the correlation with commodities to be 0.07, with gold to be 0.07, with hedge funds to be 0.32, with private credit to be 0.27, with private equity to be 0.36, with real estate to be 0.27, and with U.S. bonds to be 0.00.
2.3 Volatility Assumptions
Bitcoin's volatility has been declining over the past decade—its volatility of volatility has also been decreasing. In the chart below, this is illustrated by the downward trajectory of volatility and its tighter band of distribution over time.
Bitcoin's Historical Volatility
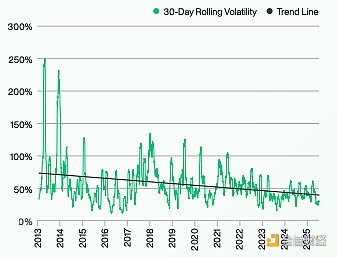
Data Source: Bitwise Asset Management. Data dates from January 1, 2013, to June 30, 2025.
We believe these trends reflect a fundamental reduction in the risks associated with Bitcoin as an investment over the past decade, as well as the diversification of its investor base. We expect both trends to continue over the next decade, leading to a further decline in Bitcoin's volatility (and its second-order volatility).
However, our model assumes that the rate of decline in Bitcoin's volatility will be 50% slower than historical trends. This reflects our view that some of the most fundamental challenges facing Bitcoin have significantly reduced risks, including those related to regulation, adoption, custody, and liquidity. As the risks that need to be mitigated in the market decrease, it is reasonable to expect a slowdown in the decline of Bitcoin's volatility.
A Historical Analogy: Gold
Investors questioning the long-term downward trend in Bitcoin's volatility can look to gold as a useful historical analogy.
Investors view gold as an asset that has existed for thousands of years, but in reality, it has only had a floating price for about 50 years in modern times. For most of its existence in the U.S., the dollar value of gold was typically fixed, and it wasn't until 1971 that politicians officially severed the link between gold and the dollar.
The chart of gold's price movements after this break is quite enlightening. Initially, gold's volatility soared to abnormally high levels as investors struggled to determine its role after the decoupling from the dollar. As investors gradually accepted its new status in the world, its volatility generally declined over the subsequent 26 years, reaching a low in 1997.
Gold's Historical Volatility
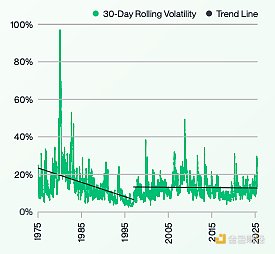
Data Source: Bitwise Asset Management, data from Bloomberg. Data dates from January 2, 1975, to June 30, 2025.
Importantly, gold's volatility did not drop to zero; in fact, it rebounded in the late 1990s and surged significantly during the 2008 financial crisis. These spikes reflect changes in the fundamentals of the gold market. Today, its volatility is generally slightly lower than that of U.S. stocks and slightly higher than that of U.S. bonds.
We expect Bitcoin to experience similar long-term results. It is currently in the process of establishing its status in the world, which is driving a one-time decline in its volatility. Ultimately, we expect it to reach a stable state, with average volatility similar to that of gold.
For modeling purposes, we position Bitcoin's future volatility at the midpoint of its expected journey from 2025 to 2035. This sets it at 32.85%. In reality, we expect near-term volatility to exceed the volatility of Bitcoin in the coming years as the market matures.
2.4 Cycle Assumptions
Historically, Bitcoin has operated on a four-year cycle, with three significant "up" years followed by a year of sharp correction. If the four-year cycle repeats, 2026 will be a correction year.
Bitcoin's Performance: Four-Year Cycle
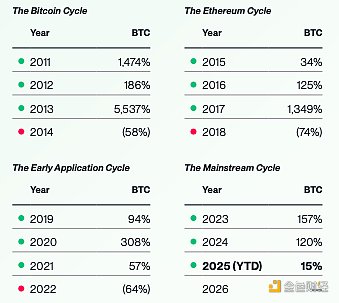
Data Source: Bitwise Asset Management. Data dates from December 31, 2010, to June 30, 2025.
Note: The names assigned to the four-year cycles represent our assessment of the forces that contributed most significantly to Bitcoin's performance during that period. Performance information is provided for informational purposes only. Returns reflect Bitcoin's own returns, not those of any fund or account, and do not include any fees. Past performance does not predict future performance of any investment strategy. Future crypto cycles may not be four years; the four-year increments are based on historical data for illustrative purposes and are not predictions of future outcomes. This material represents an assessment of the market environment at a specific time and is not intended to predict future events or guarantee future results.
There is no consensus on what drives this significant pattern. Below, we discuss four main theories.
01 / Bitcoin Halving
Every four years, the number of newly produced Bitcoins is halved. Although the halving dates do not perfectly align with the beginning or end of Bitcoin price cycles, many attribute the cycles to the long-term effects of this supply reduction.
02 / Interest Rate Cycles
Previous down years (2018, 2022) coincided with periods of rapid interest rate hikes by the U.S. Federal Reserve. Many believe these interest rate shocks contributed to Bitcoin's sharp corrections.
03 / Crypto Credit Cycles
Some researchers attribute the four-year cycle to classic boom-and-bust economic cycles: novel innovations generate new investments and strong returns, which in turn attract leverage and bad actors until prices reset. In Bitcoin's case, each correction has been accompanied by a collapse, such as the Mt. Gox collapse in 2014, the SEC crackdown on fraudulent ICOs in 2018, and the FTX collapse in 2022.
04 / Coincidence
Some observers believe the four-year cycle is coincidental, noting that it has only occurred three times.
At Bitwise, we suspect that all four arguments contain partial truths. Regardless, we believe the four-year cycle is unlikely to repeat in the future for the following reasons.
First, regardless of which explanation you look at, the impact of these forces (aside from coincidence) has diminished. For example, each subsequent Bitcoin halving reduces the supply by half compared to the previous one, leading to a diminished impact. Interest rates are unlikely to rise significantly in the near future; instead, most experts are calling for rate cuts. Similarly, leverage in the crypto system is relatively controlled (currently so—this is worth noting), so the boom-and-bust cycle effects may be weaker compared to historical periods. We should also add that improved regulation has reduced the likelihood of the kind of collapses that occurred during the corrections in 2014, 2018, and 2022.
Second, we believe the wave of institutional capital entering the space (officially beginning with the approval of spot Bitcoin ETPs in 2024) will last for years, partly because there remains a large portion of the institutional market that is still undeveloped. This will provide ongoing upward pressure on Bitcoin prices, which does not align with the historical four-year cycles.
Third, we believe that the regulatory shift supporting crypto, which begins with the 2024 elections, also creates a multi-year tailwind that spans historical four-year cycles.
We still anticipate significant market volatility and notable pullbacks in Bitcoin prices. However, we do not expect the classic four-year cycle to continue to hold in the future.
3. Bitcoin vs. Traditional Assets
Long-term capital market assumptions are useful for investors as they help design effective portfolios. Therefore, it is important to consider not only Bitcoin's long-term prospects but also the relative prospects of other asset classes.
To do this for non-crypto assets, we take a simple average of the latest long-term capital market assumptions from four leading financial institutions—J.P. Morgan, PIMCO, BlackRock, and Vanguard.
Notably, each provider uses different time frames (between 5 to 10 years) for their assumptions, and they model returns for asset classes using different target indices. For the purpose of creating an average forecast, we have ignored these differences. Therefore, the table below should be viewed as an approximate average rather than an exact group prediction.
Unsurprisingly, the results show that Bitcoin is both the best-performing and the most volatile major asset, with a lower correlation to other assets. This is consistent with its historical performance and the potential outcomes we predict.
2025 to 2035 Forecast: Bitcoin's Returns, Volatility, and Correlation with Major Asset Classes
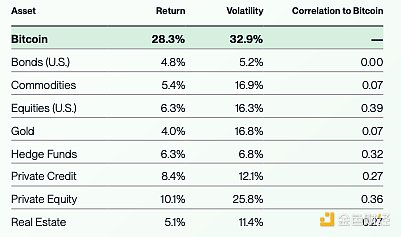
Data Source: Bitwise Asset Management. Bitcoin's return and volatility forecasts are developed by Bitwise. The forecasts for other asset classes are averages of estimates from J.P. Morgan, PIMCO, BlackRock, and Vanguard capital market reports, which may be based on different indices and date ranges.
For correlation, asset classes are represented as follows: Bitcoin: Bitcoin spot price. Commodities: Deutsche Bank DBIQ Optimum Yield Diversified Commodity Index Total Return. Gold: Gold spot price. Hedge Funds: Bloomberg Macro Hedge Fund Index. Private Credit: Indxx Private Credit Index. Private Equity: S&P Listed Private Equity Total Return Index. Real Estate: MSCI U.S. REIT Total Return Index. U.S. Bonds: Bloomberg U.S. Aggregate Bond Index. U.S. Stocks: S&P 500 Total Return Index.
Note: Correlation between -0.5 and 0.5 is traditionally defined as "low" or "no" correlation.
4. Risks and Considerations
Bitcoin is a highly volatile asset with a limited historical record. The regulations surrounding Bitcoin are rapidly evolving, institutional adoption is still in its early stages, and the underlying technology supporting Bitcoin is relatively new. Additionally, these and other factors make the process of predicting Bitcoin's future returns, correlations, and volatility inherently uncertain and subject to significant risks and potential errors.
Here are some key risks to consider.
01 / Bitcoin's Limited Historical Record
Bitcoin was developed in 2008-09 and began trading widely on public exchanges in 2010. The first institutional investment product offering Bitcoin exposure was launched in 2014, while spot ETPs linked to Bitcoin were not introduced until 2024.
The result of these relatively short time frames is that there is limited data available for assessing Bitcoin's future returns, correlations, and volatility. Given the constantly changing nature of the Bitcoin market, regulation, and other developments, future returns may not closely resemble past performance, which presents additional risks. Analysts studying Bitcoin's historical returns can only examine returns under macroeconomic conditions that have existed since its launch, and future macroeconomic conditions may differ from those in the past.
Due to Bitcoin's limited historical record, investors should carefully consider the risks of heavily relying on historical data for Bitcoin predictions. While we have attempted to account for these risks in our analysis, they still exist.
02 / Regulatory and Legislative Risks
The regulatory and legislative environment surrounding Bitcoin is more dynamic and underdeveloped than that of many other assets, and it is changing rapidly, both in the U.S. and abroad. Significant unexpected changes in the regulatory and legislative status of Bitcoin in the U.S. or globally could significantly alter Bitcoin's outlook, either positively or negatively.
03 / Institutional, Corporate, and Government Adoption of Bitcoin is a New Trend
Bitcoin was initially an asset primarily dominated by retail investors. In recent years, institutions, corporations, and governments have begun acquiring Bitcoin, and its future growth prospects largely depend on the continued adoption by these investor groups. However, this is a relatively new development, and it remains uncertain whether the recent adoption trends will persist into the future.
04 / Technological and Quantum Risks
Bitcoin is a technology, and like any technology, it comes with risks. For the Bitcoin blockchain to function well, its underlying source code must be continuously updated in response to changes in the surrounding technological environment. There is a risk that Bitcoin may not keep pace with the times, and if it fails to do so, it will face technological challenges or competitive threats.
For example, if quantum computing (a technology designed to process information at rates exponentially higher than today’s supercomputers) develops rapidly, the core technologies behind Bitcoin and many Bitcoin wallets may be at risk. At some point in the future, the Bitcoin blockchain may need to undergo a significant upgrade to transition to quantum-resistant cryptography to mitigate risks in this area. Even if Bitcoin successfully completes this upgrade—which is uncertain—individual wallets that do not transfer assets to quantum-resistant addresses may also face risks. Failing to adequately adapt to advancements in quantum computing could expose the Bitcoin blockchain and Bitcoin investments to risks.
05 / Other Risks
Bitcoin also faces many other significant risks, including those related to macroeconomic developments, trading, custody, and other factors. This document does not attempt to define all the risks associated with Bitcoin but rather highlights specific risks that may introduce uncertainty into our capital market assumptions.
Conclusion
In its brief 16-year history, Bitcoin has transformed from a little-known fringe investment into a $2.4 trillion asset held and studied by some of the world’s most sophisticated investors. This journey has been marked by exceptional returns, extraordinary volatility, and significant new questions regarding its future risk-return characteristics. As institutional investors increasingly weigh the unique characteristics of this asset, obtaining high-quality data and forecasts becomes more critical when modeling Bitcoin's role in portfolios.
This report provides that foundation.
Our analysis leads us to the following key capital market assumptions for Bitcoin over the next decade:
Institutional investors will allocate 1% to 5% of their portfolios to Bitcoin, amounting to $1 trillion to $5 trillion.
Growing government debt, public spending, and monetary expansion will exert downward pressure on fiat currencies, increasing demand for store-of-value assets like gold and Bitcoin.
Given Wall Street and mainstream society's increasing acceptance of Bitcoin, recent regulatory progress is unlikely to be reversed in the future political environment.
We believe the historical four-year cycle of Bitcoin is no longer applicable due to the diminishing impact of halvings, the depth of new institutional demand, and enduring regulatory progress.
Putting all of this together, we predict a compound annual growth rate of 28.3% for Bitcoin over the next decade, with volatility at 32.9%, and that it will continue to maintain low correlation with stocks, bonds, commodities, and other traditional assets. In this scenario, the next 10 years will represent the institutional era for Bitcoin, during which it becomes a mainstream alternative asset that any thoughtful investor will find hard to ignore.
Appendix: What Do Other Models Say About Bitcoin's Future Price?
While we strongly favor the TAM (Total Addressable Market) model, the crypto industry widely follows various other Bitcoin valuation models. We do not endorse these models. However, given their widespread attention—and the reality that no model is perfect—it is worth considering the views of three of the most frequently cited models regarding Bitcoin's potential appreciation.
Model 1: Stock-to-Flow Model
The Bitcoin Stock-to-Flow model was originally proposed by the pseudonymous crypto research analyst PlanB in a 2019 article titled "Modeling Bitcoin's Value with Scarcity." The Stock-to-Flow model assumes that Bitcoin's value is related to its scarcity. Specifically, it posits that there is a logarithmic relationship between Bitcoin's market value and the ratio of its total circulating supply ("stock") to its annual new supply ("flow"). This model is closely related to the view that Bitcoin's value is driven by its "halving" process, which occurs every four years, halving the number of new Bitcoins produced each year.
PlanB updated the model in April 2020, introducing the "Stock-to-Flow Cross-Asset Model," which examines various assets based on this relationship.
Critics of the Stock-to-Flow model point out its inherent bullish bias: because Bitcoin's stock-to-flow ratio increases programmatically over time, the model predicts that Bitcoin will continue to rise indefinitely. Others note that it does not account for macroeconomic or regulatory developments.
The Stock-to-Flow model predicts a Bitcoin price of $1.16 million by 2035.
Model 2: The Bitcoin Power Law Model
The Bitcoin Power Law model was proposed by a pseudonymous crypto researcher known as Dilution-proof in 2022 and has gained attention as an alternative to the Stock-to-Flow model.
The Bitcoin Power Law model is based on the observation that Bitcoin's price has historically followed a power law relationship. The model predicts that Bitcoin's price will fluctuate between support and resistance levels, which can be estimated by connecting previous highs (and lows) on a logarithmic chart of Bitcoin price versus time.
The Bitcoin Power Law model is descriptive rather than causal. Like the Stock-to-Flow model, it is inherently bullish, predicting that Bitcoin will continue its upward trajectory over time.
The Bitcoin Power Law model predicts a Bitcoin price of $1.5 million by 2035.
Model 3: The Bitcoin Autocorrelation Exchange Rate Model (BAERM)
The Bitcoin Autocorrelation Exchange Rate Model (BAERM) is a quantitative model designed to explain and predict Bitcoin prices based on the premise that Bitcoin returns are autocorrelated—that is, its price moves according to self-referential historical patterns. The model assumes that Bitcoin prices expand exponentially over time, but this trend is influenced by halving cycles, market effects, and the daily autocorrelation of Bitcoin prices.
This model is complex. It attempts to provide a more comprehensive analysis of Bitcoin's historical price trends than standard trend-following or momentum models while still trying to explain the real impact of momentum in the Bitcoin space.
The model is retrospective and does not include factors such as demand, macroeconomic conditions, or regulatory developments. Skeptics argue that it over-indexes historical returns and that the out-of-sample results of this recently introduced model will be less predictive than historical results. Since the model was only recently introduced (2023-24), it is too early to make judgments.
The Bitcoin Autocorrelation Exchange Rate Model predicts a Bitcoin price of $7.5 million by 2035.
Bitwise Research Report PDF Download Link.
免责声明:本文章仅代表作者个人观点,不代表本平台的立场和观点。本文章仅供信息分享,不构成对任何人的任何投资建议。用户与作者之间的任何争议,与本平台无关。如网页中刊载的文章或图片涉及侵权,请提供相关的权利证明和身份证明发送邮件到support@aicoin.com,本平台相关工作人员将会进行核查。


