From a technical structure perspective, Bitcoin/Ethereum's weekly level currently shows KDJ and MACD continuing to oscillate upwards. However, the KDJ three lines have reached an absolute high, and the MACD has shown a slight decrease in short-term bullish volume. In terms of BOLL, the upper band is still in an opening phase, but this week's coin price is too close to the upper band, which will indirectly affect the upward space this week. Currently, Bitcoin's weekly chart is relatively sluggish, having fallen below the five-day and ten-day moving averages. The KDJ and MACD in the auxiliary chart are in a death cross resonance, indicating that institutions or large holders have started to sell high. A pullback for Ethereum this week is also a high-probability event, and we will refer to support levels step by step to assess the strength of the pullback.
On the daily level, today KDJ and MACD show a decrease in bullish volume, with short-term indicators exhibiting a slight downward oscillation. The upper band of BOLL has narrowed (indicating increased selling pressure at high points). Currently, the daily KDJ, MACD, and BOLL are generating a strong bearish resonance. The main chart's three-day moving averages are strongly aligned downwards, and today the coin price has closed below the three-day moving averages. Therefore, a short-term downward oscillation is expected. In terms of operations, it is advisable to treat this as a rebound to short, with specific points for reference:
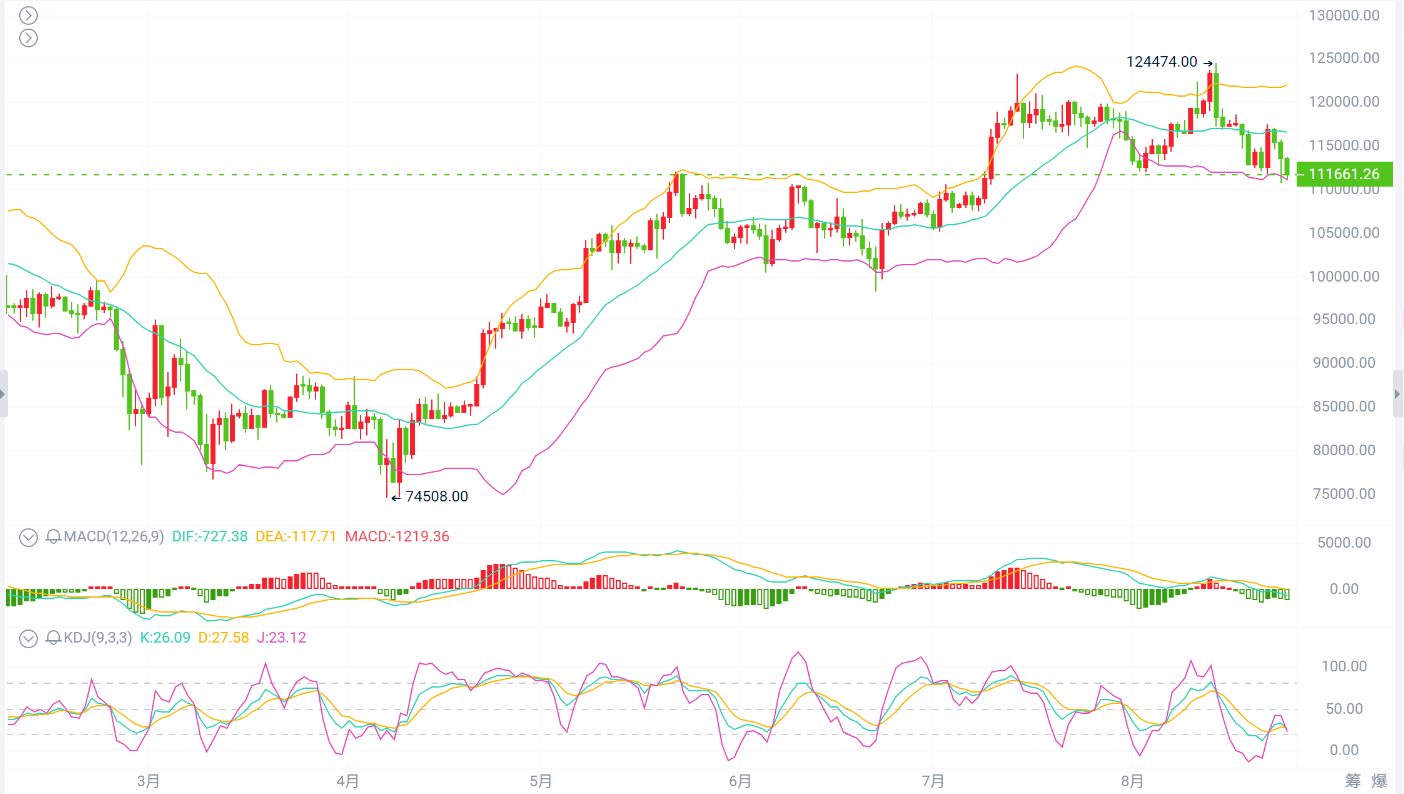
BTC: Short at 112500-113000, target 110500
ETH: Short around 4640-4670, target 4540
The above are personal operational suggestions. The market is ever-changing, and the article has a certain lag. Specific operations should be based on real-time guidance. If you have any questions, feel free to consult.

免责声明:本文章仅代表作者个人观点,不代表本平台的立场和观点。本文章仅供信息分享,不构成对任何人的任何投资建议。用户与作者之间的任何争议,与本平台无关。如网页中刊载的文章或图片涉及侵权,请提供相关的权利证明和身份证明发送邮件到support@aicoin.com,本平台相关工作人员将会进行核查。


