Price Trend Analysis
- K-line Pattern:
Recently, the K-line has shown a trend of oscillating downward. After a long upper shadow bullish line appeared on August 22, it closed with two consecutive bearish days, indicating heavy selling pressure above.
On August 24, a small body bearish line was formed, with the price approaching the previous low support area (114236), which may test this support in the short term.
Technical Indicators:
MACD: Both DIF and DEA are operating below the zero axis, with green bars expanding, indicating an increase in bearish momentum, but it is necessary to pay attention to any signs of divergence.
RSI: The current value is 45.91, in a neutral to weak range, not entering the oversold area, still having room for further decline.
EMA: The 7-day EMA (115203.82) has been broken, and the 30-day EMA (116005.65) is exerting pressure on the price. The 120-day EMA (109263.88) is far from the current price, with no obvious long-term support below.
Trading Volume:
On August 22, trading volume significantly increased, accompanied by a rise and fall, indicating a growing divergence between bulls and bears.
The trading volume gradually shrank over the next two days, with a strong wait-and-see sentiment in the market, requiring caution regarding directional choices.
Buy and Sell Points
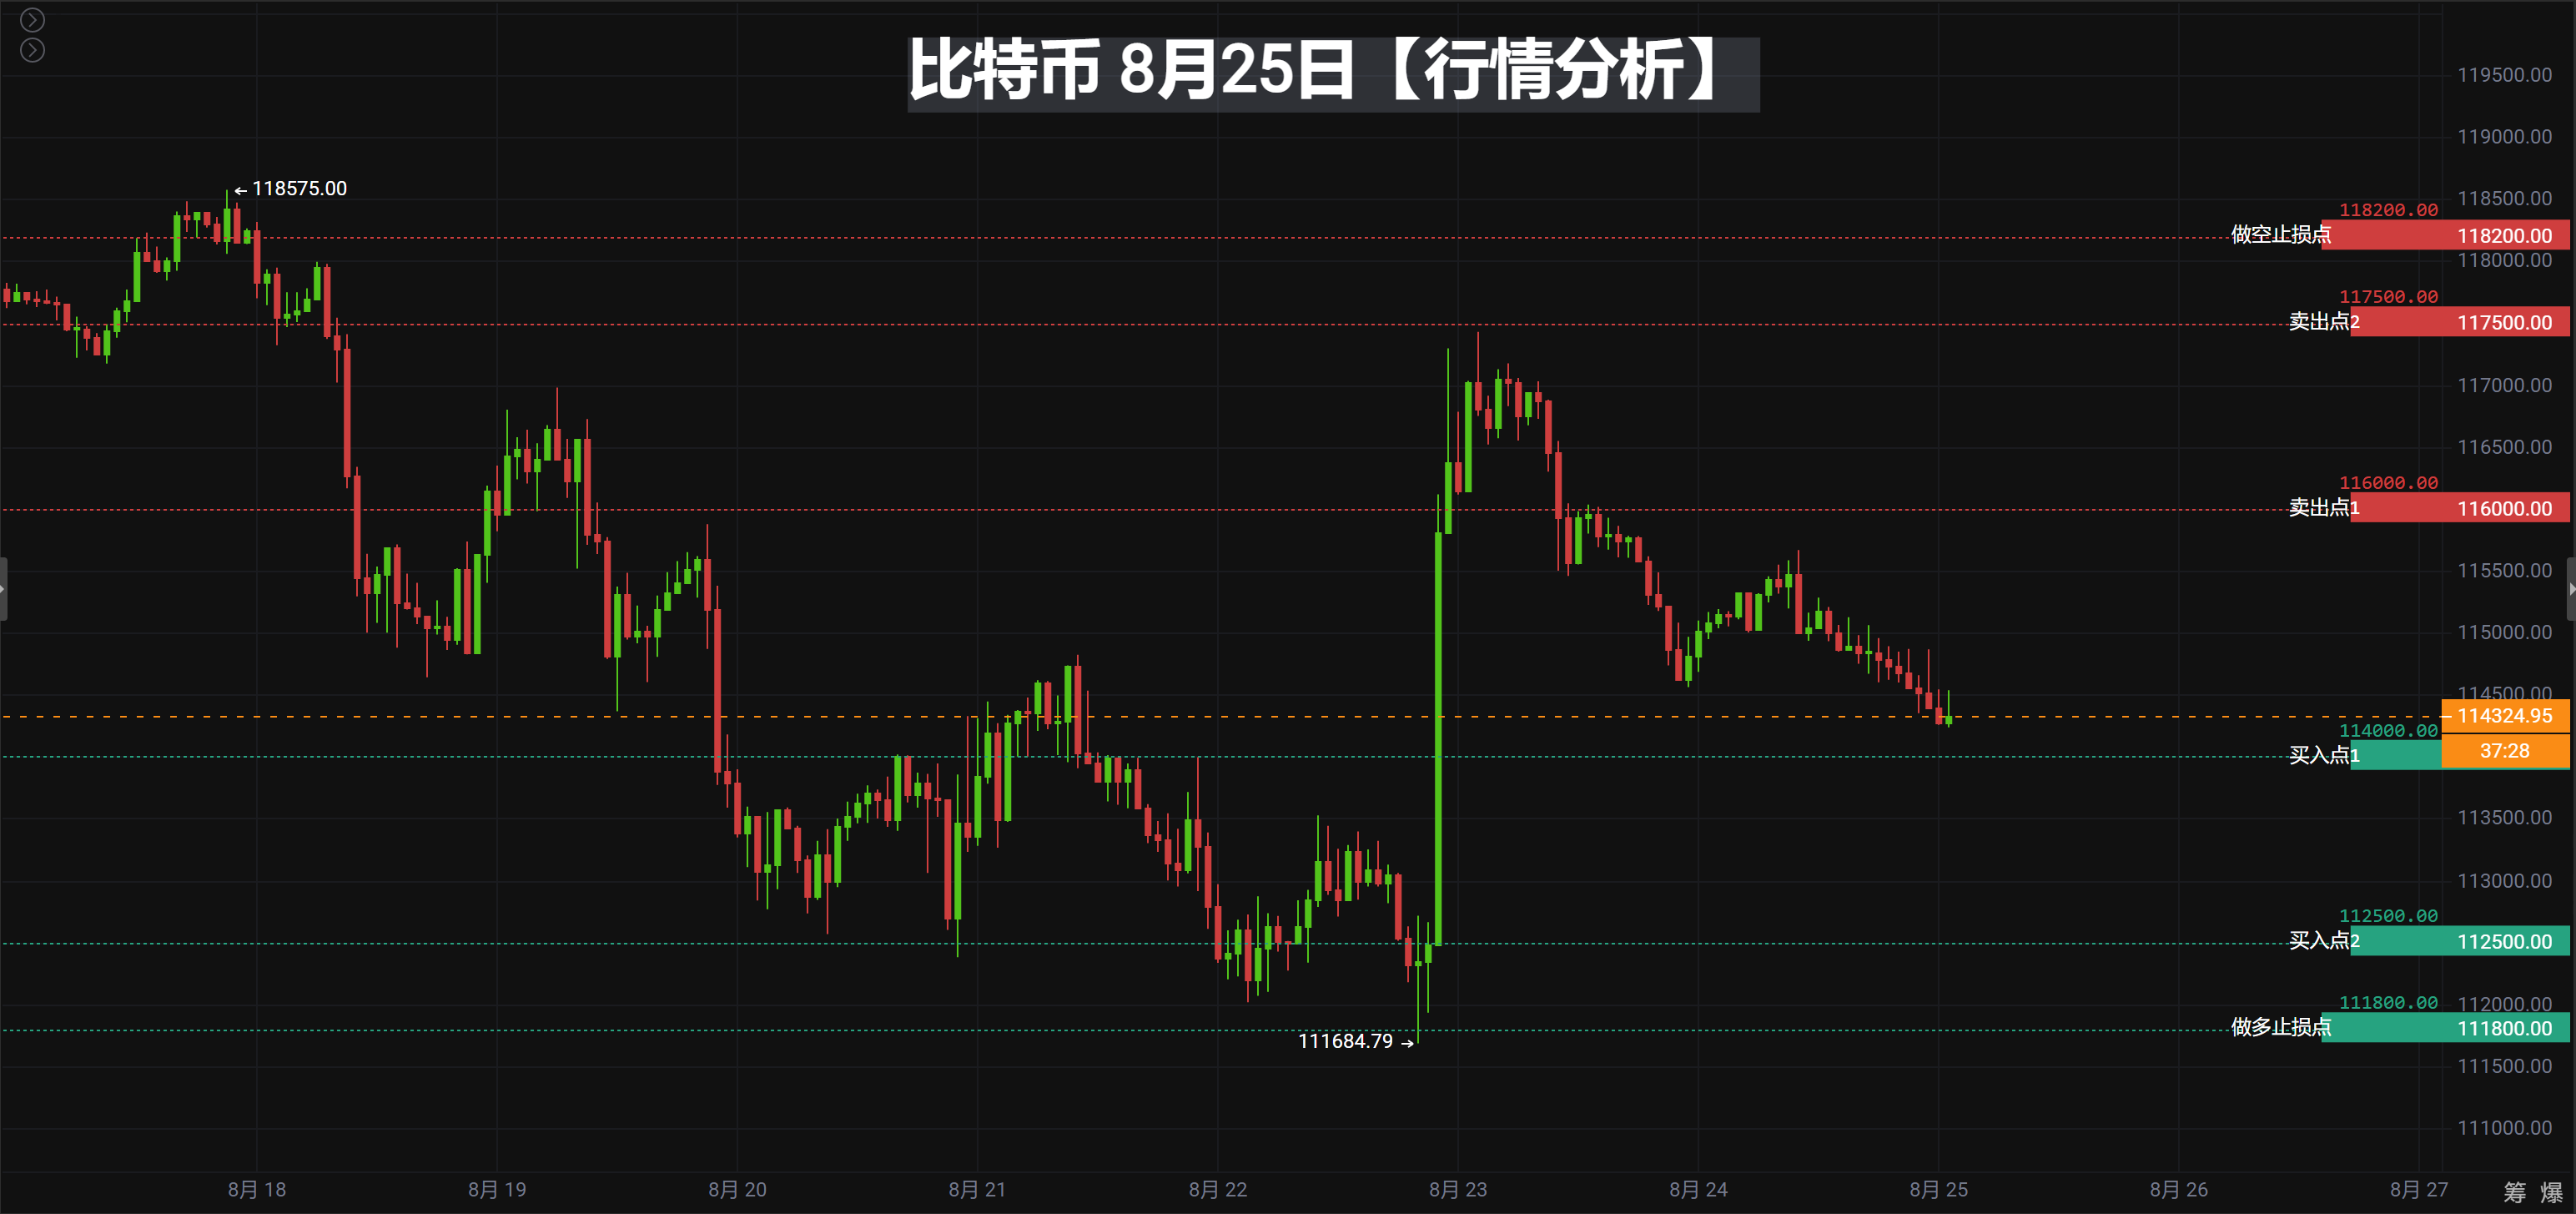
Buy Point One: 114000 USDT (Reason: Approaching the previous low support area of 114236, the integer level may form short-term support)
Buy Point Two: 112500 USDT (Reason: The lowest price on August 21, historical swing low, with strong buying support)
Long Stop Loss Point: 111800 USDT (Reason: If it falls below 112500 and continues to decline, the trend will weaken, and timely stop loss is necessary)
Sell Point One: 116000 USDT (Reason: Approaching the 30-day EMA pressure level of 116005.65, also an integer level, which may produce selling pressure)
Sell Point Two: 117500 USDT (Reason: Near the high point of August 23 at 117030, combined with a larger integer level, there is significant resistance)
Short Stop Loss Point: 118200 USDT (Reason: If it breaks through 117500 and stabilizes, it indicates that the upper space is opening up, and decisive stop loss is required)
BTC#ETH
Live explanation of real-time strategies at any time throughout the day
#Tencent Meeting: 919-948-0091
[The above analysis and strategies are for reference only. Risks are to be borne by the user. The article review and publication may have delays, and specific operations should follow the real-time strategies of crypto experts.]
Join the group chat to discuss and learn professional knowledge in the crypto space, so as not to be the chives under the sickle (you can receive position allocation strategies, teaching you how to make money in a bull market and earn coins in a bear market)
——Crypto Expert Community, a community focused on technical analysis. Anyone with questions about operations or trends can communicate and learn with me! Share and profit together! Remember the crypto expert, available 24 hours a day, follow the crypto expert to avoid getting lost!

Scan the QR code with WeChat to follow my public account
免责声明:本文章仅代表作者个人观点,不代表本平台的立场和观点。本文章仅供信息分享,不构成对任何人的任何投资建议。用户与作者之间的任何争议,与本平台无关。如网页中刊载的文章或图片涉及侵权,请提供相关的权利证明和身份证明发送邮件到support@aicoin.com,本平台相关工作人员将会进行核查。


