Live commentary on real-time strategies 24/7
#Tencent Meeting: 919-948-0091
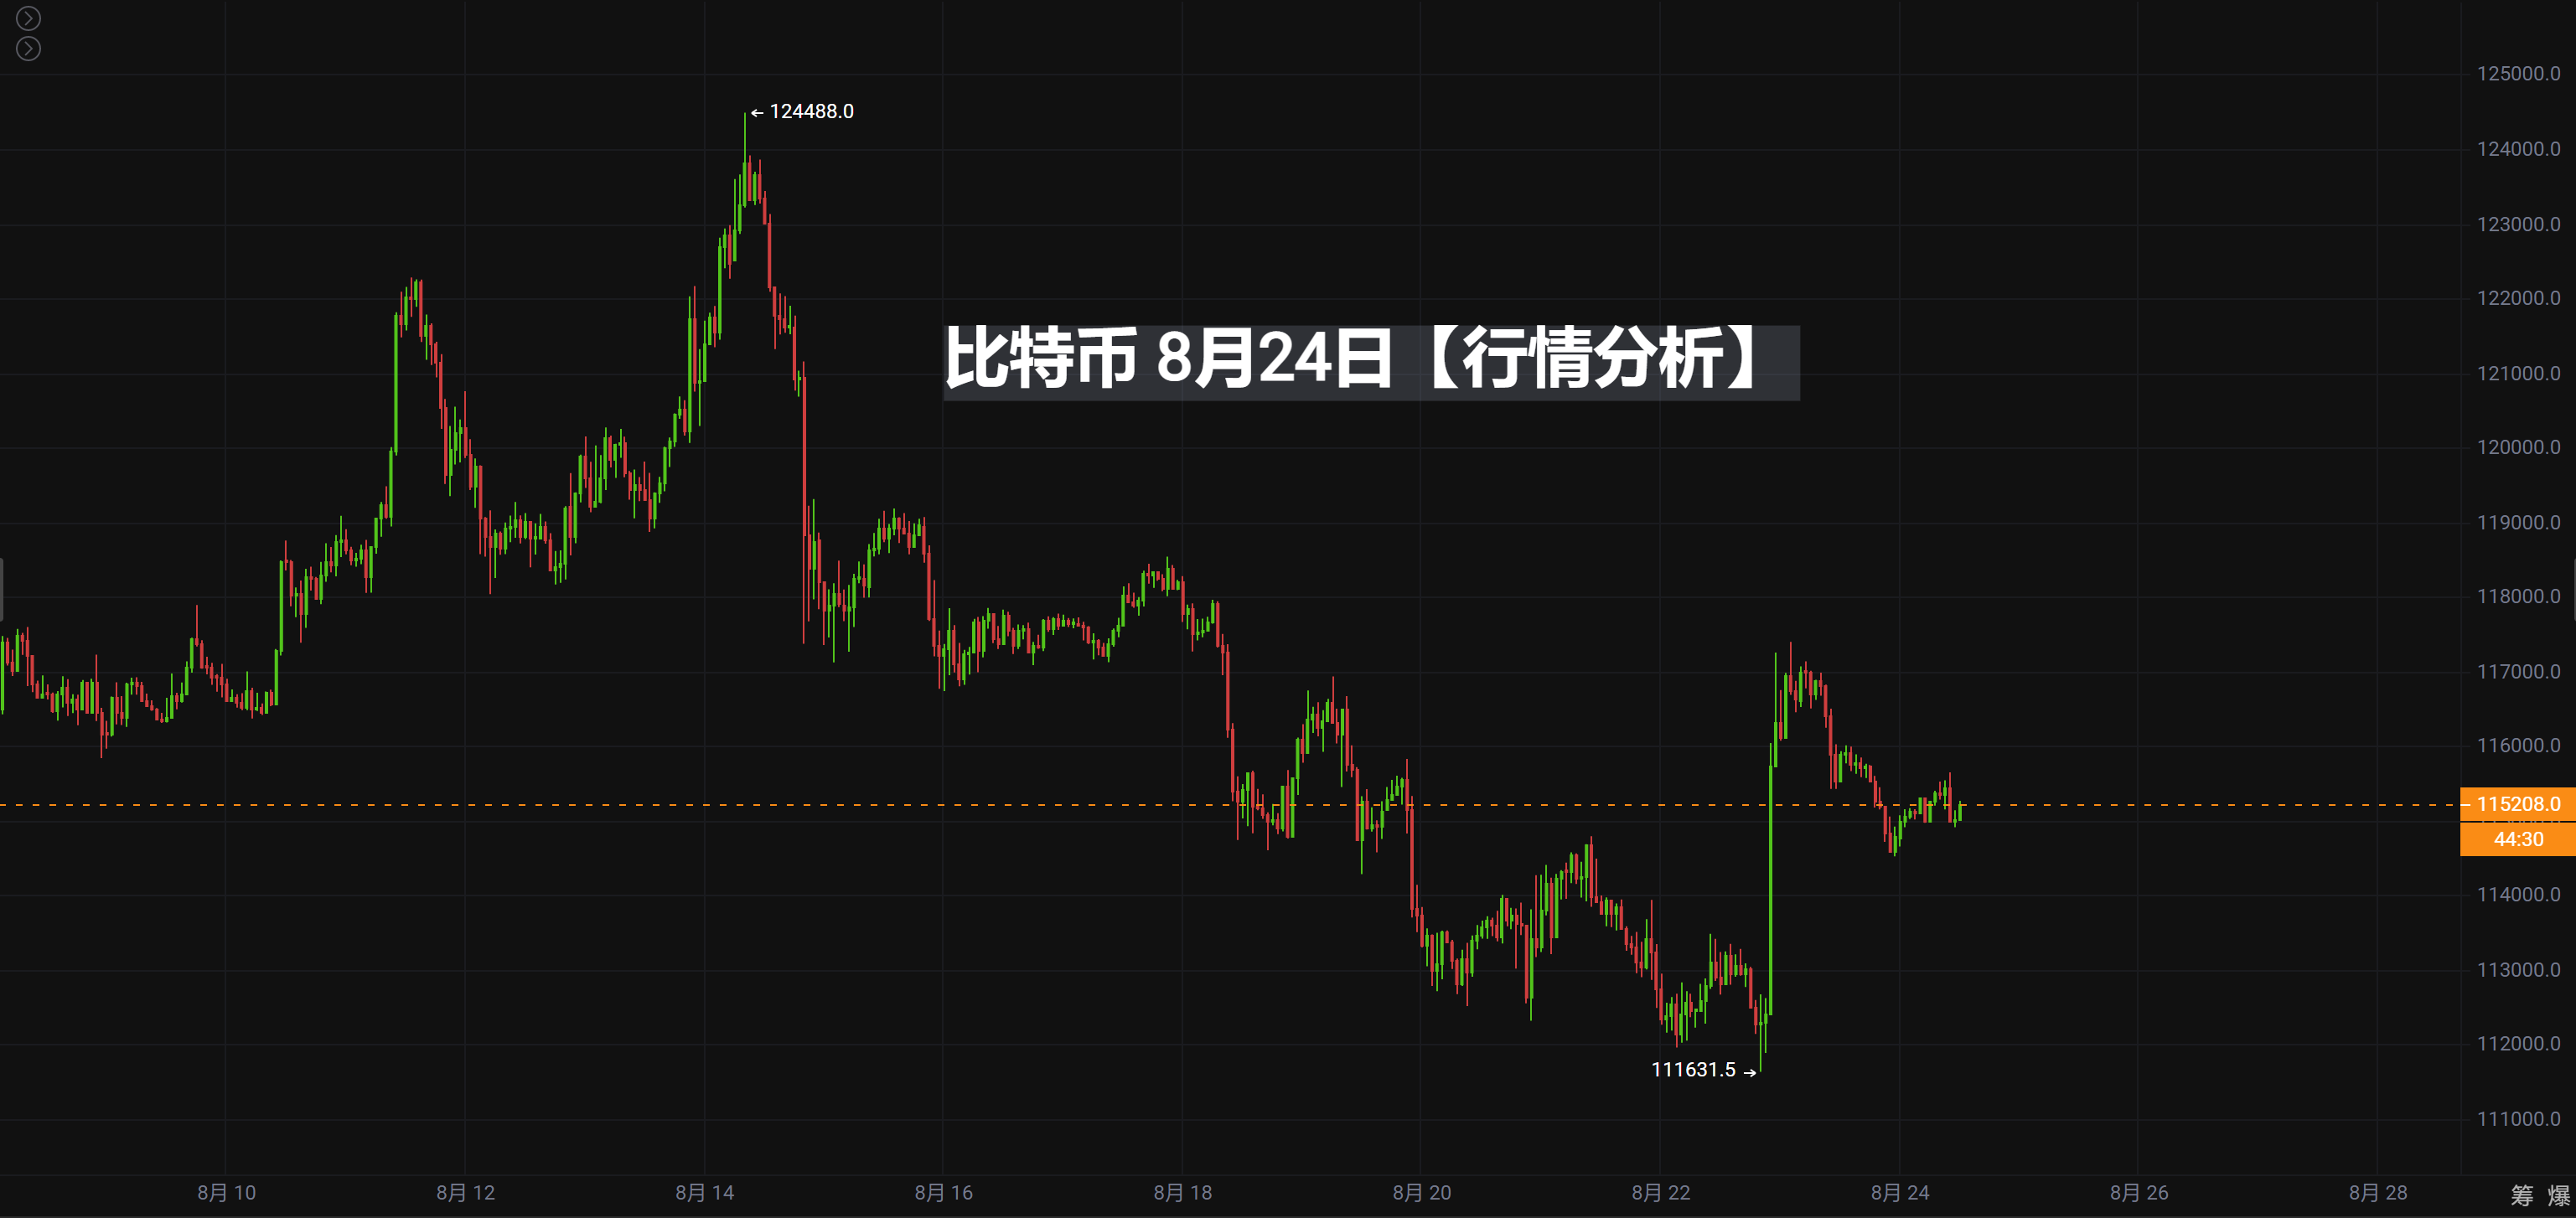
BTC August 24, 2025 [Market Analysis]
🔹 K-Line Pattern
Bitcoin's movement yesterday continued to maintain a volatile pattern, with multiple attempts to break through the 117500 resistance level failing, showing clear signs of short-term pressure.
The daily line closed with a small bearish candle, with prices running near the moving averages, indicating that both bulls and bears are still in a tug-of-war.
The support in the 115500–116000 area remains effective, with buying interest stepping in during multiple retests.
🔹 Technical Indicators
MACD: The fast and slow lines continue to converge below the zero axis, with the momentum bars shortening, indicating that the market direction remains unclear.
RSI: RSI14 fluctuates in the 48–52 range, positioned neutrally, with weak momentum.
EMA: EMA7 and EMA30 are entangled and flat, with prices being suppressed by the moving averages, but the long-term EMA120 still maintains an upward trend, indicating that the long-term bullish structure has not been broken.
🔹 Trading Volume
Recent trading volume has been overall sluggish, with insufficient market trading enthusiasm.
Each short-term rebound lacks volume support, indicating insufficient upward momentum.
Trading Suggestions (Reference Points)
Buy Point One: 116000 USDT (lower boundary of the volatile range, can go long if it holds)
Buy Point Two: 114500–115000 USDT (strong support area, near the long lower shadow low)
Stop Loss: 113800 USDT (if broken, it may open up downward space)
Sell Point One: 117500 USDT (short-term strong pressure, multiple obstacles, can go short)
Sell Point Two: 118500 USDT (key resistance area, if it does not break with volume, be cautious with long positions)
Stop Loss: 119200 USDT (if it breaks and stabilizes, it may test 120000)
📌 Summary:
Bitcoin is currently in a consolidation phase, with the direction of bulls and bears still not fully clear.
It is recommended to continue shorting at the high end and going long at the low end of the range, paying attention to the breakout situation in the 116000–117500 range, and waiting for volume signals to confirm the direction.
BTC#ETH
[The above analysis and strategies are for reference only. Please bear the risks yourself. The article review and publication may have delays, and the strategies may not be timely. Specific operations should follow the real-time strategies of crypto experts.]
Join the group chat to discuss and learn professional knowledge in the crypto space, so as not to be the chives under the sickle (you can receive a position allocation guide, teaching you how to make money in a bull market and earn coins in a bear market).
—— Crypto Expert Community, a community focused on technical analysis. Friends who have any questions about operations or trends can communicate and learn operations with me! Let's share and profit together! Remember the Crypto Expert, available 24/7, follow the Crypto Expert to avoid getting lost!

Scan the QR code with WeChat to follow my public account
免责声明:本文章仅代表作者个人观点,不代表本平台的立场和观点。本文章仅供信息分享,不构成对任何人的任何投资建议。用户与作者之间的任何争议,与本平台无关。如网页中刊载的文章或图片涉及侵权,请提供相关的权利证明和身份证明发送邮件到support@aicoin.com,本平台相关工作人员将会进行核查。


