Today, let's discuss the core feature of our product from a beginner's perspective — the K-line chart! This is a "must-learn" in cryptocurrency trading, and its importance goes without saying.
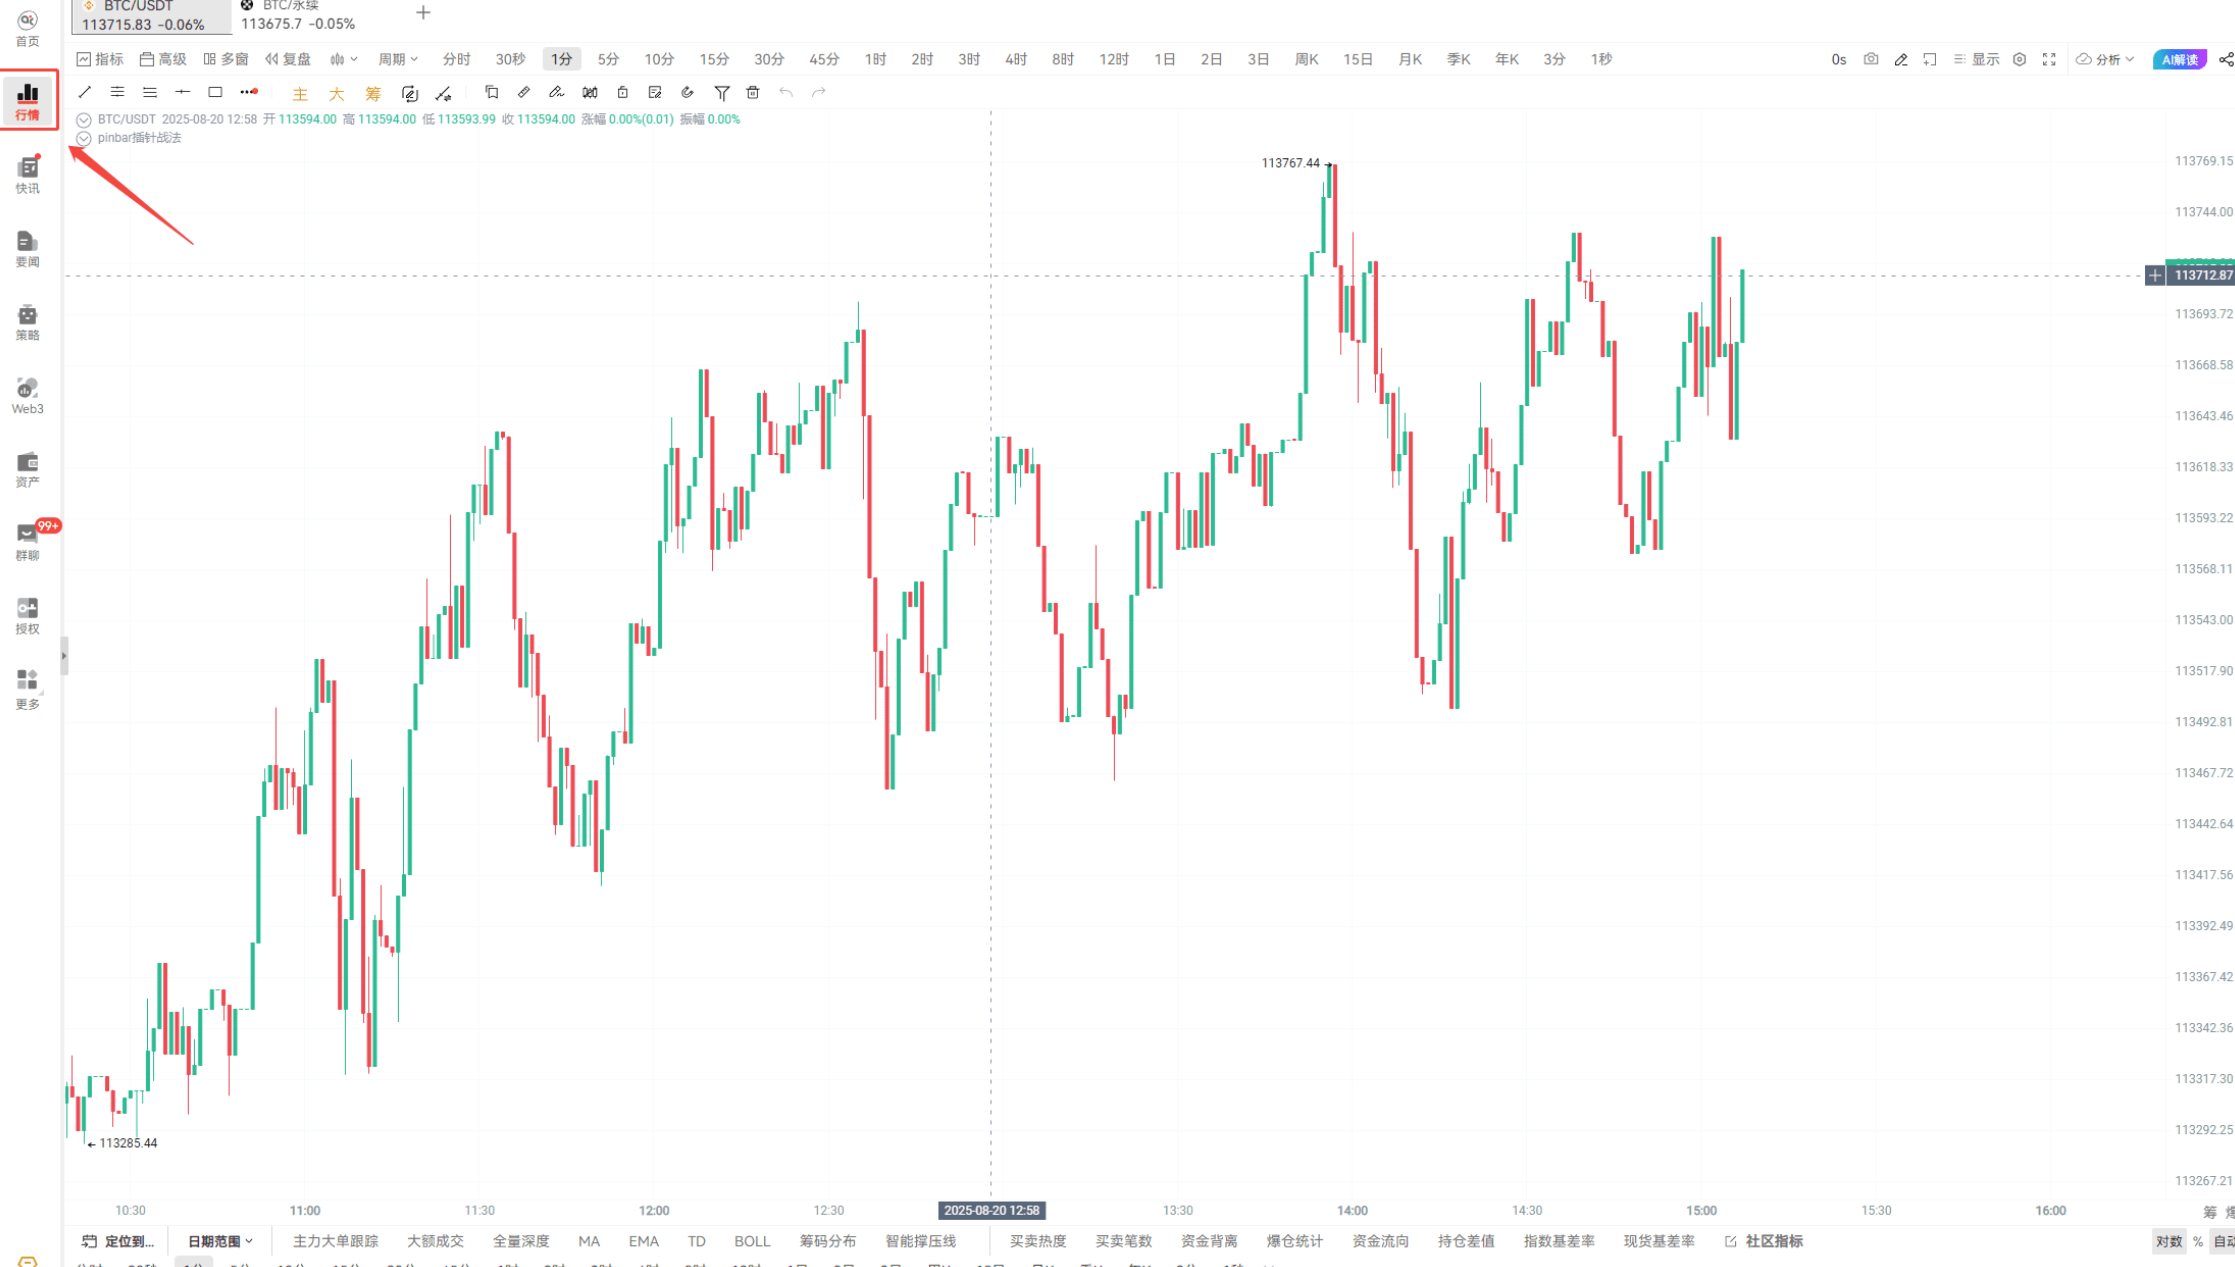
First, you need to know where to find the K-line. Open the homepage and click on "Market" at the bottom, and the K-line chart for the cryptocurrency you are interested in will appear. You can also use the cryptocurrency filter we discussed in the last beginner's session, which serves as a review of old knowledge. Do any of you remember this feature?
Find "Condition Selection" on the homepage, and below it are the cryptocurrency strategies we have saved. Today, we will use the "Spot Trading Volume Selection Method," which is a pre-set strategy with parameters ready to go. For those who don't understand how to customize parameters, you can check out the previous live stream for a refresher. Today, the main package is here to "feed" knowledge to the beginners.
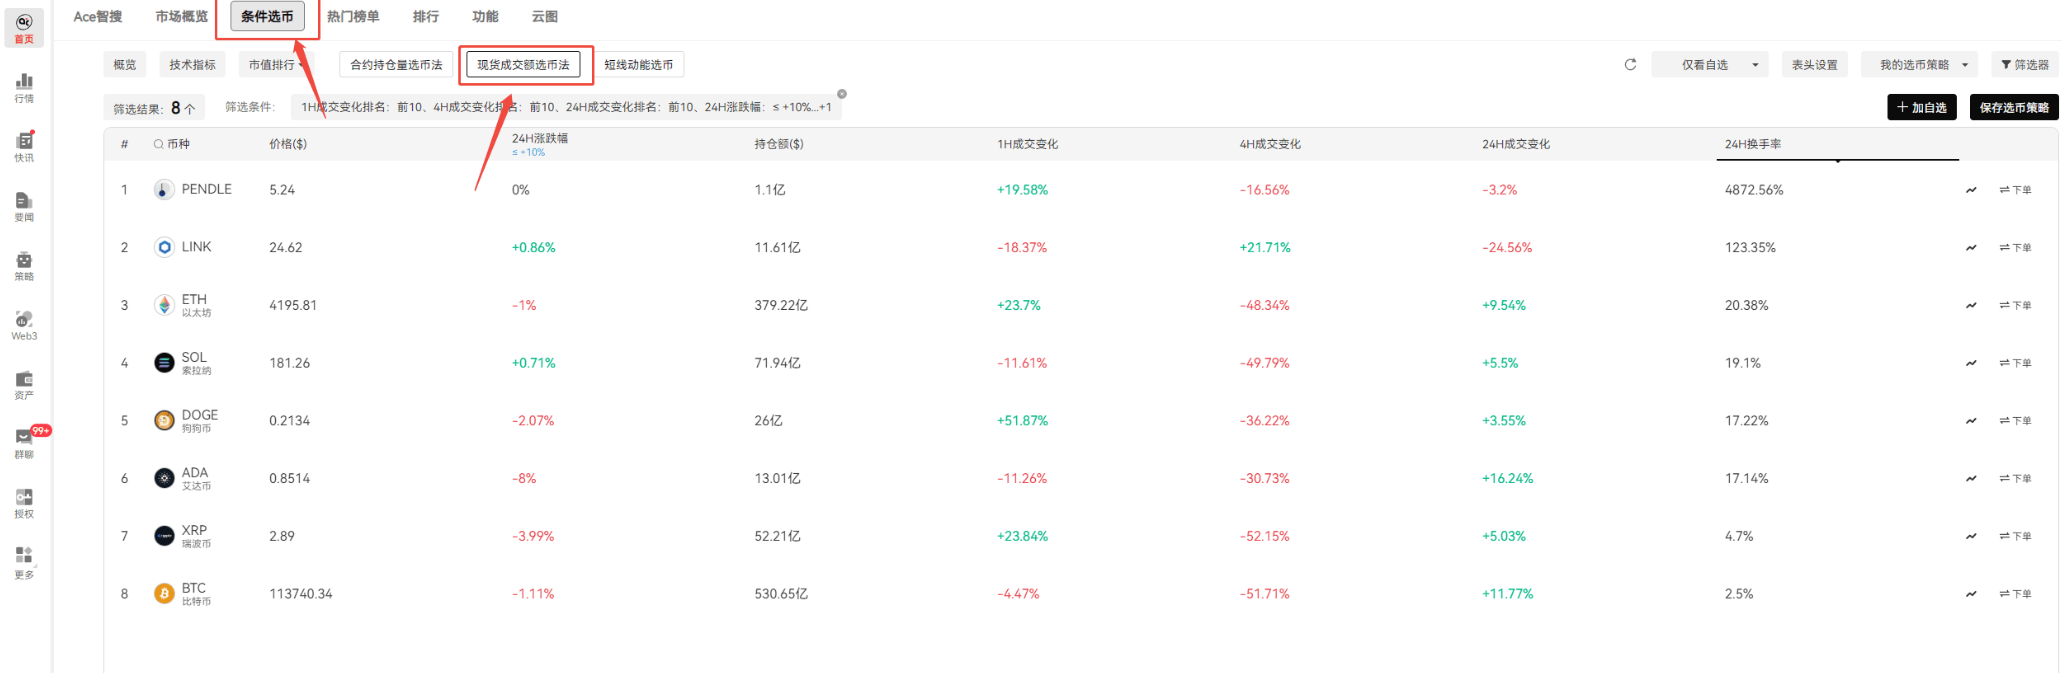
After filtering with this strategy, the cryptocurrencies that meet the criteria will be listed here. Choose one at random, for example, BTC, and click "Order" on the right. You will see options for spot and contract trading. Since spot trading cannot use leverage, let's try the contract option. After that, you will be redirected to the market interface.
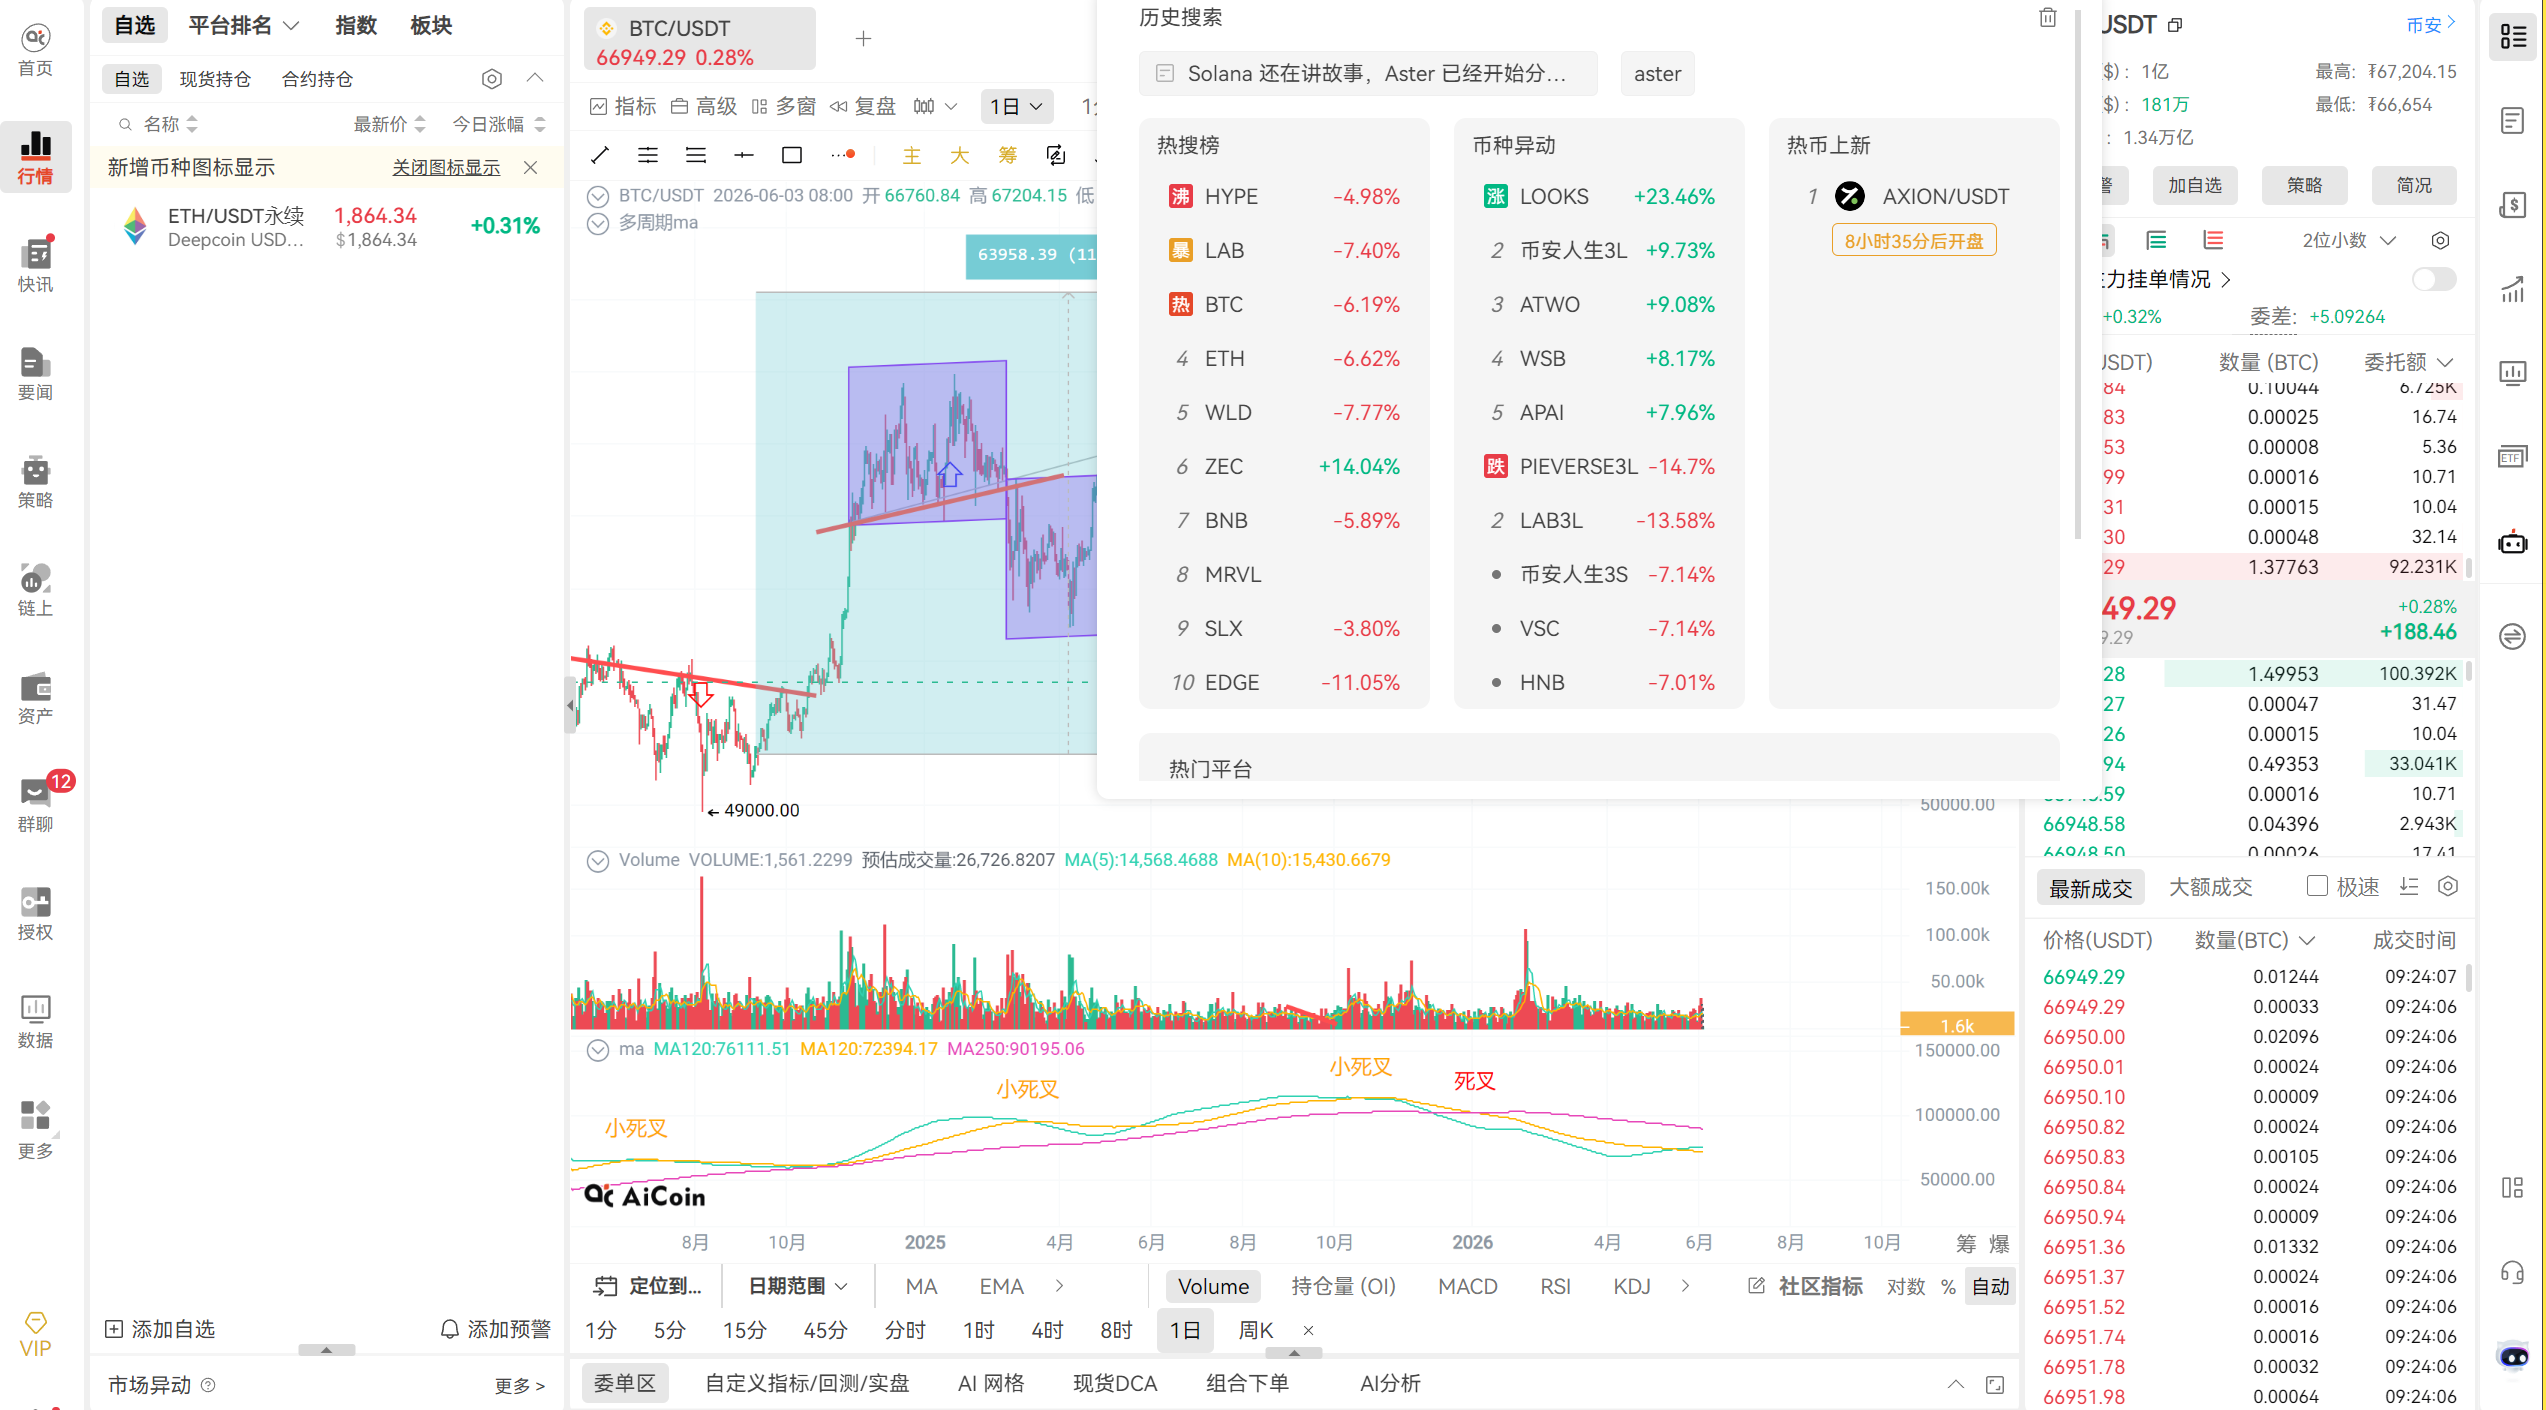
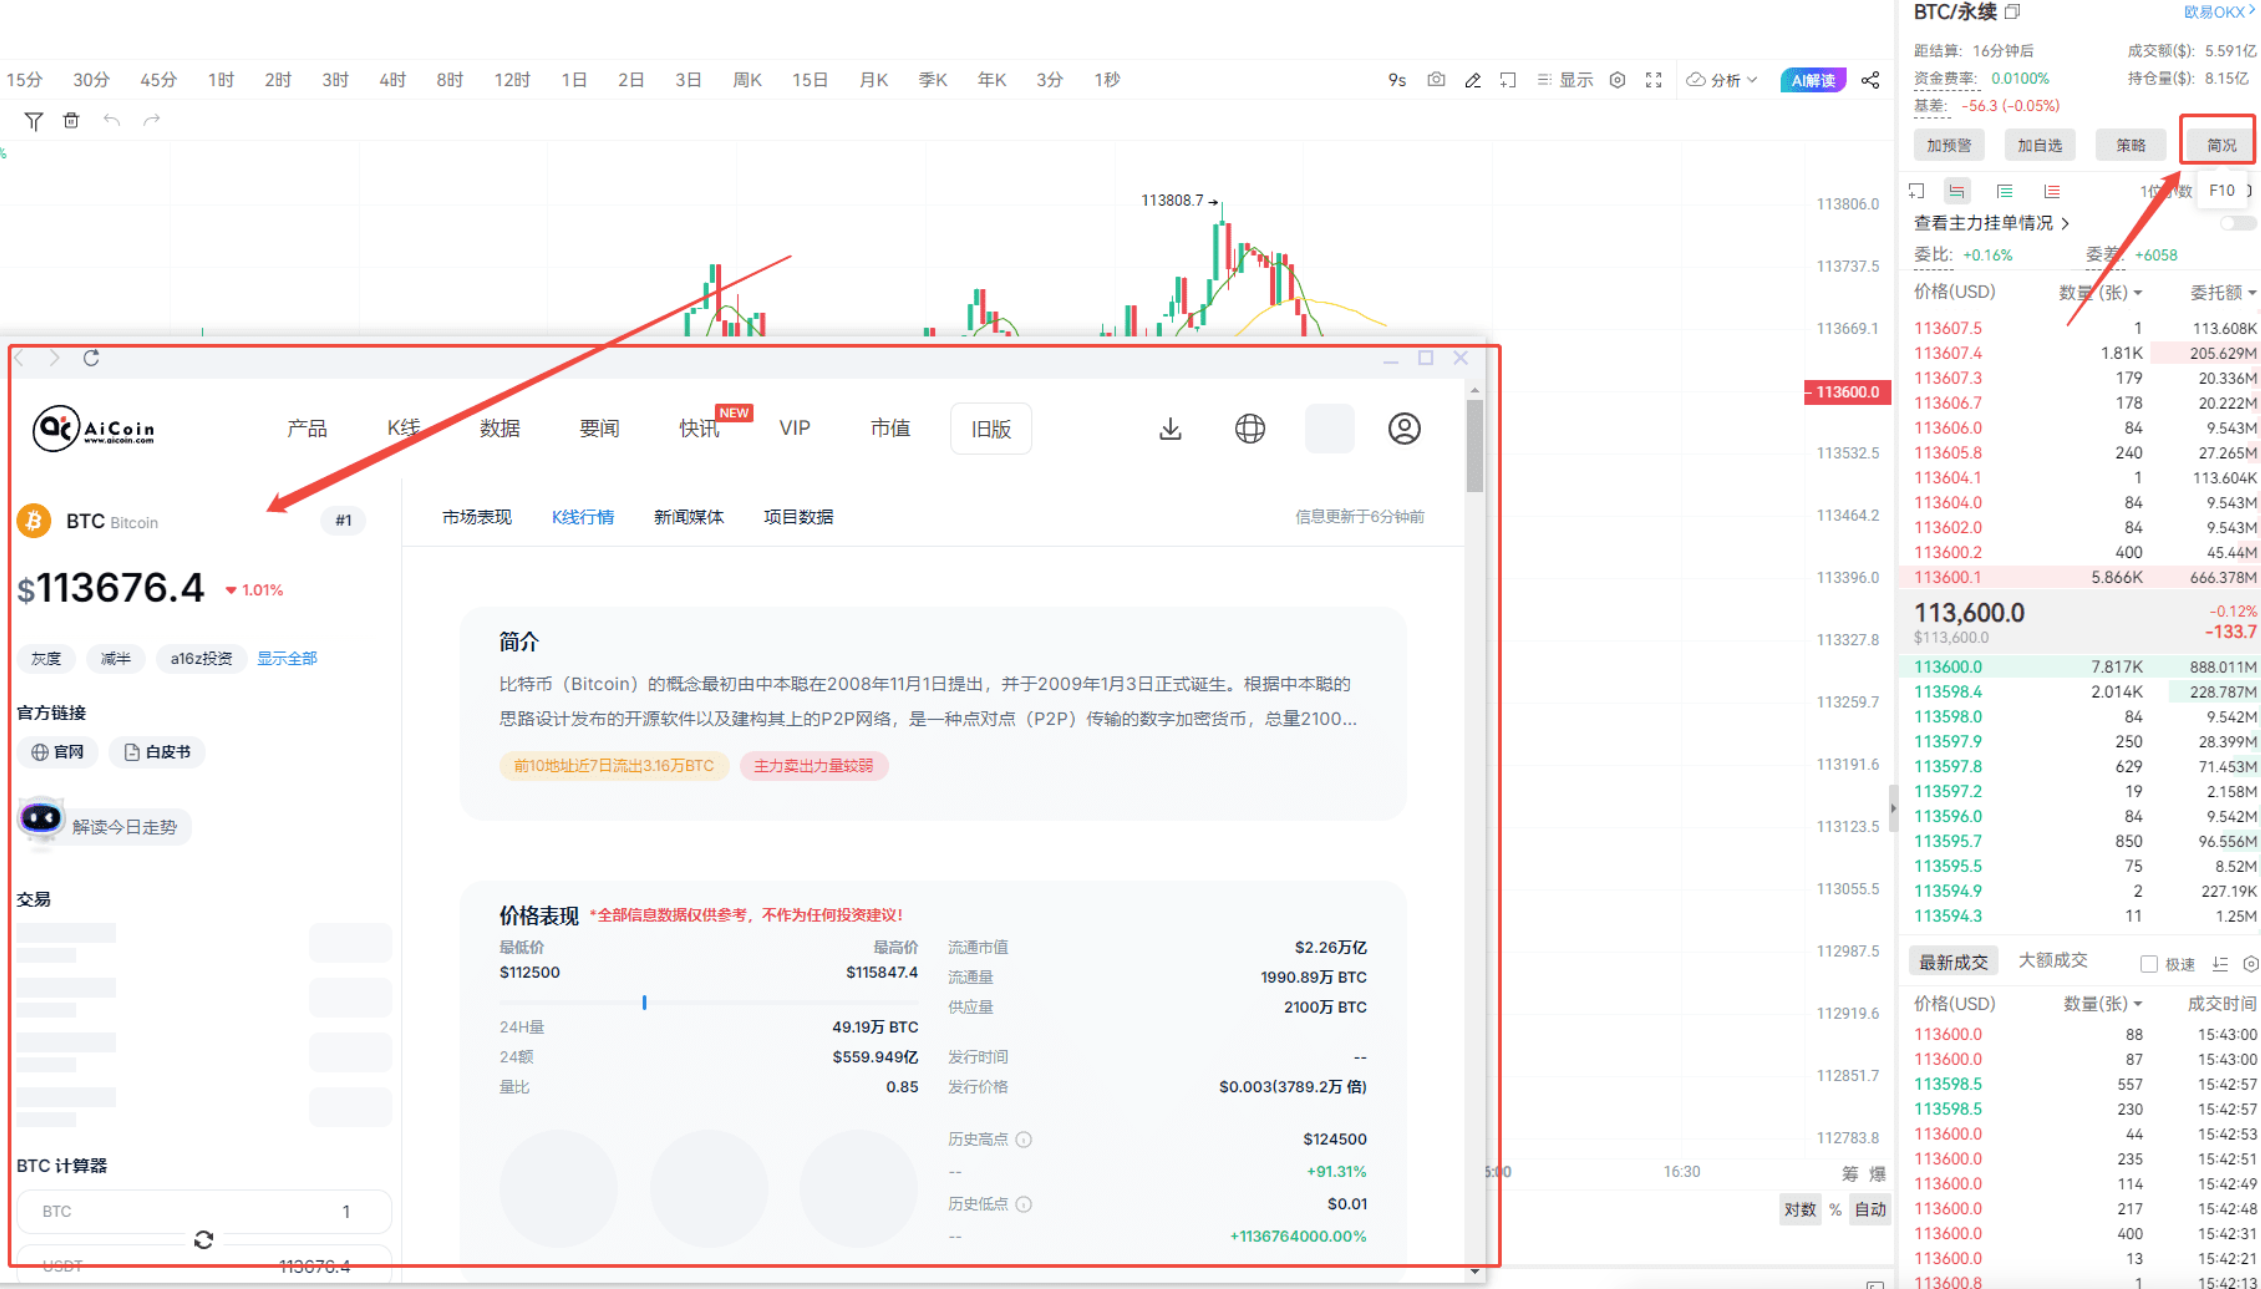
This is the K-line chart, and we will explain it clearly from top to bottom and left to right.
At the top are all the cryptocurrencies we are following; clicking on one will switch to it. Right now, we are looking at the BTC perpetual contract. Below that, there are a bunch of dense terms.
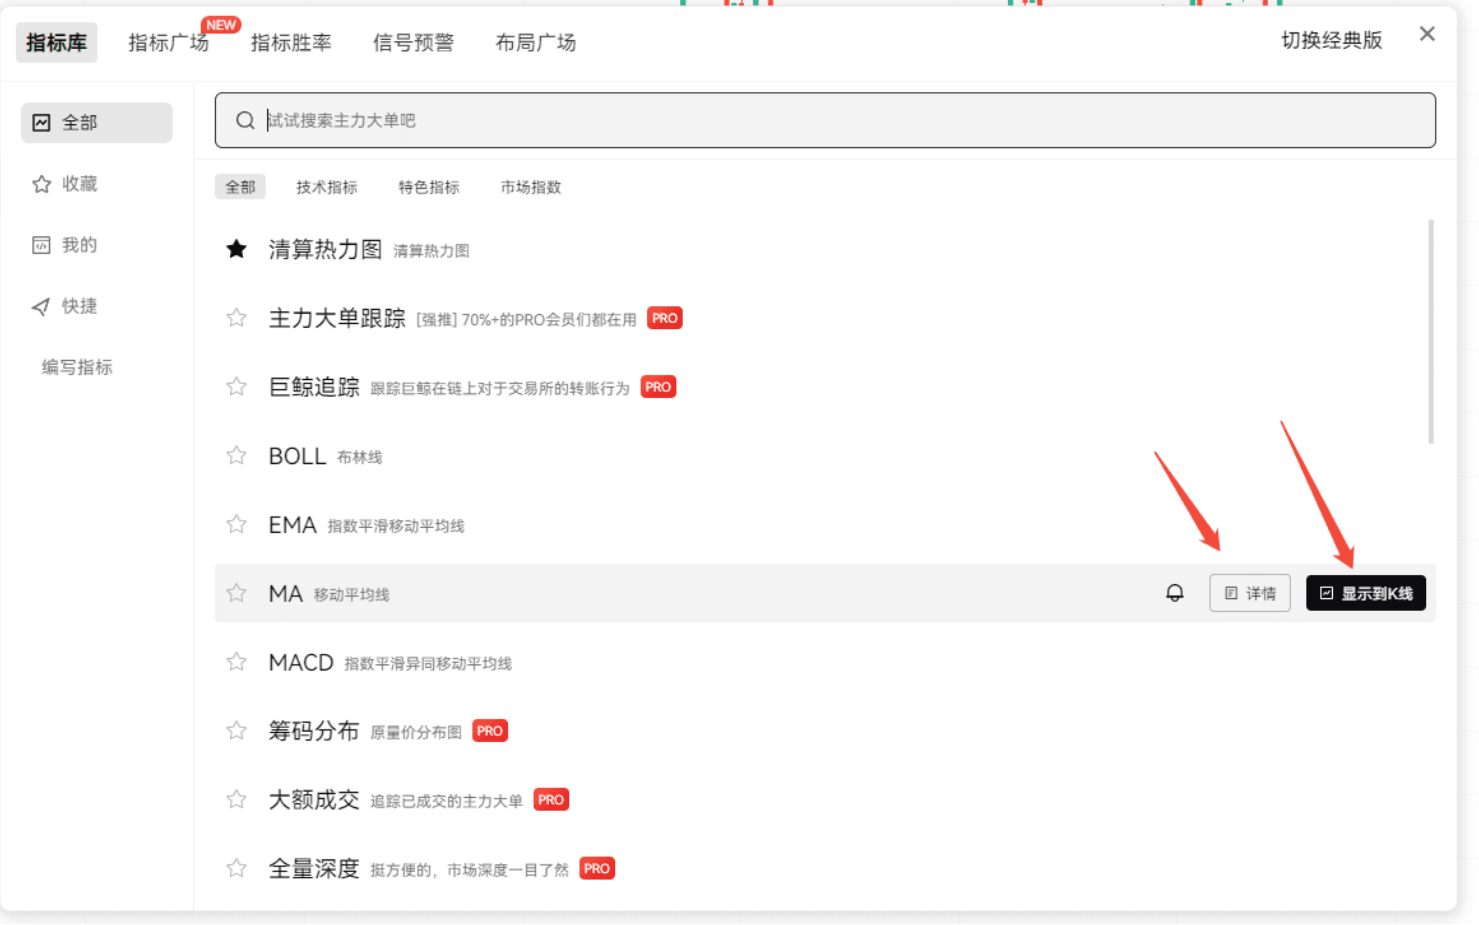
First, let's look at "Indicators." The MA (20), MACD, and others we discussed in the last lesson can be selected here.

Let's select an MA line first, using the default parameters of MA (7, 30) without adjustments (you can manually adjust if you want). These represent the 7-day and 30-day moving averages.
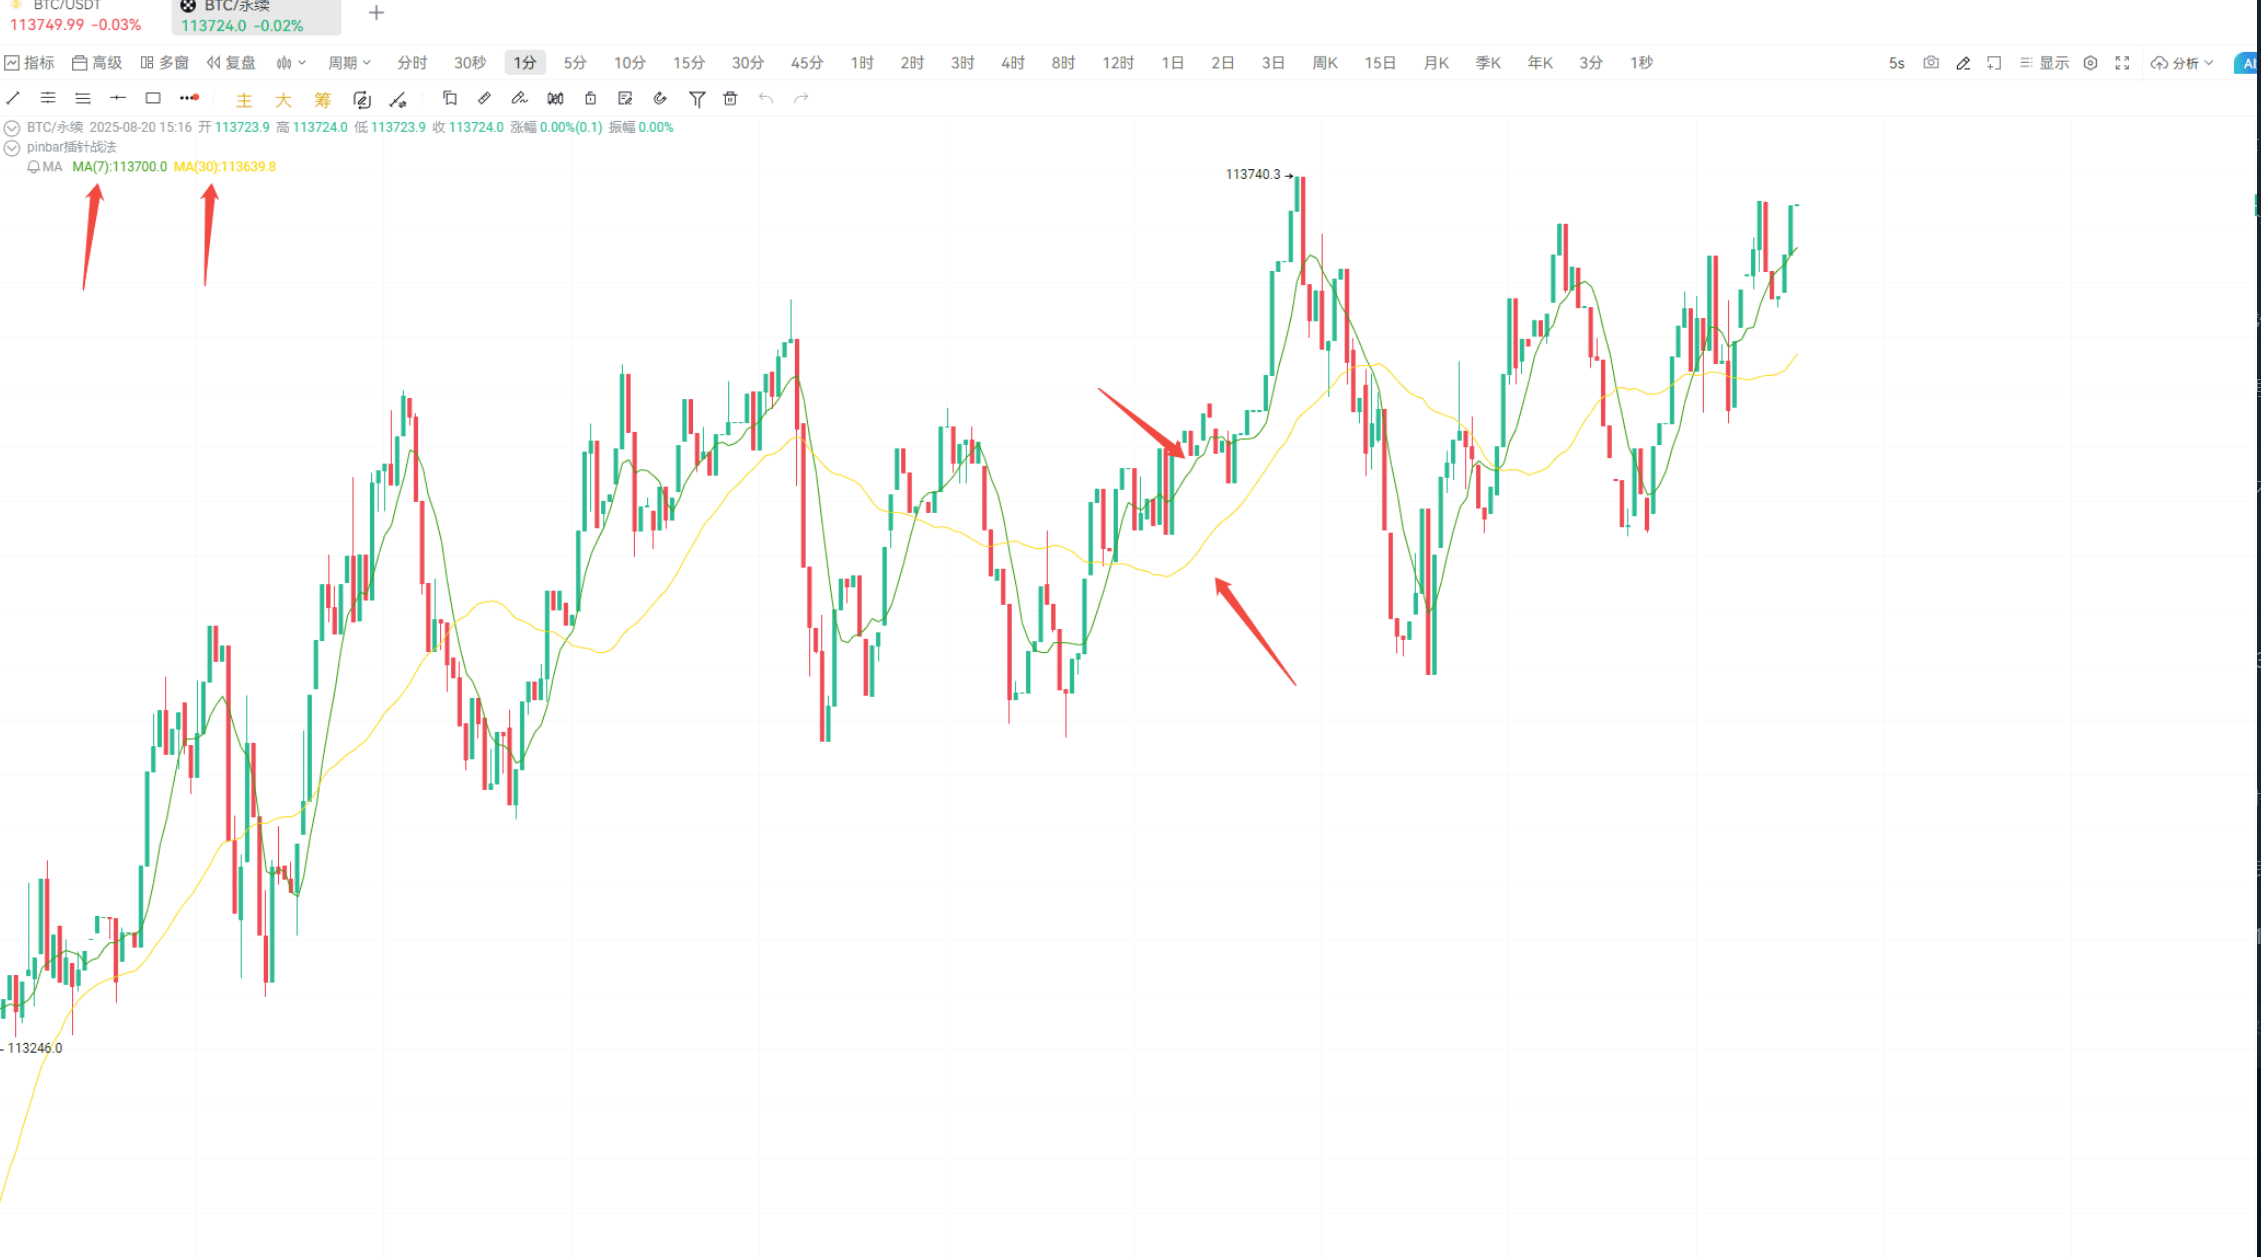
The chart will show a yellow line and a green line, corresponding to the 30-day and 7-day averages, with the meaning of the colors indicated in the upper left corner. The colors can be customized; set whatever color you like.
You can skip the terms next to the indicators for now; let's look directly at the "Period" on the far right.

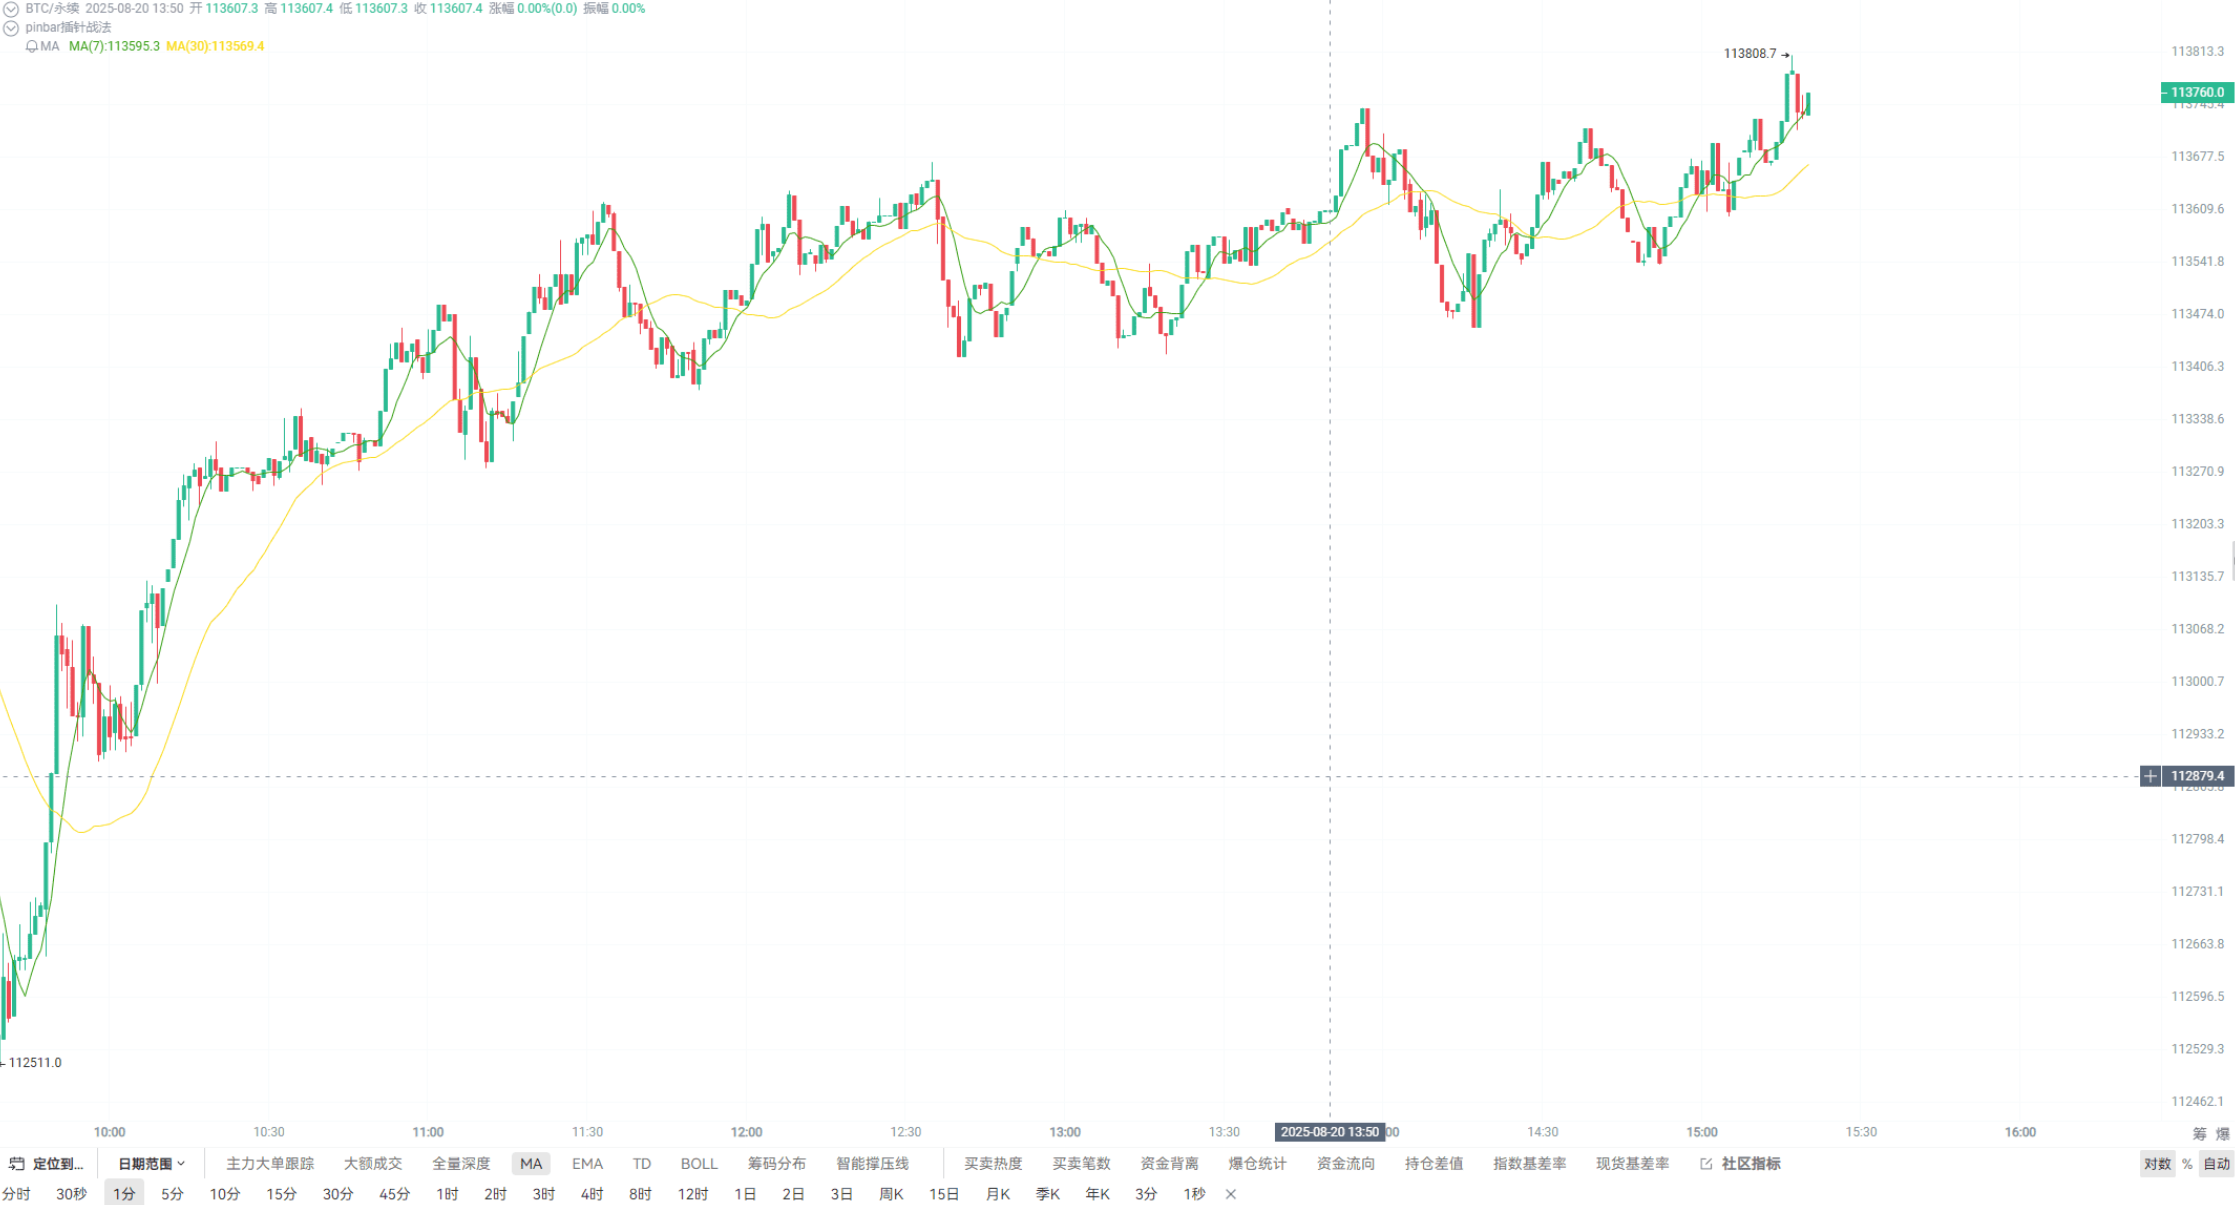
Except for the 45-minute option, which is a VIP feature, you can switch between other time periods. These time periods represent the duration of each box in the K-line chart. For example, selecting 1 minute means that one red or green block represents the price change within one minute.
Do you have any questions so far? If you’re silent, I’ll assume you understand, hehe. It seems like you all have potential! Let's continue; this row is the drawing function. Experienced users will use it to mark key points and trends, while beginners may use it less for now. If you want to learn more, we can cover it in a dedicated session later.
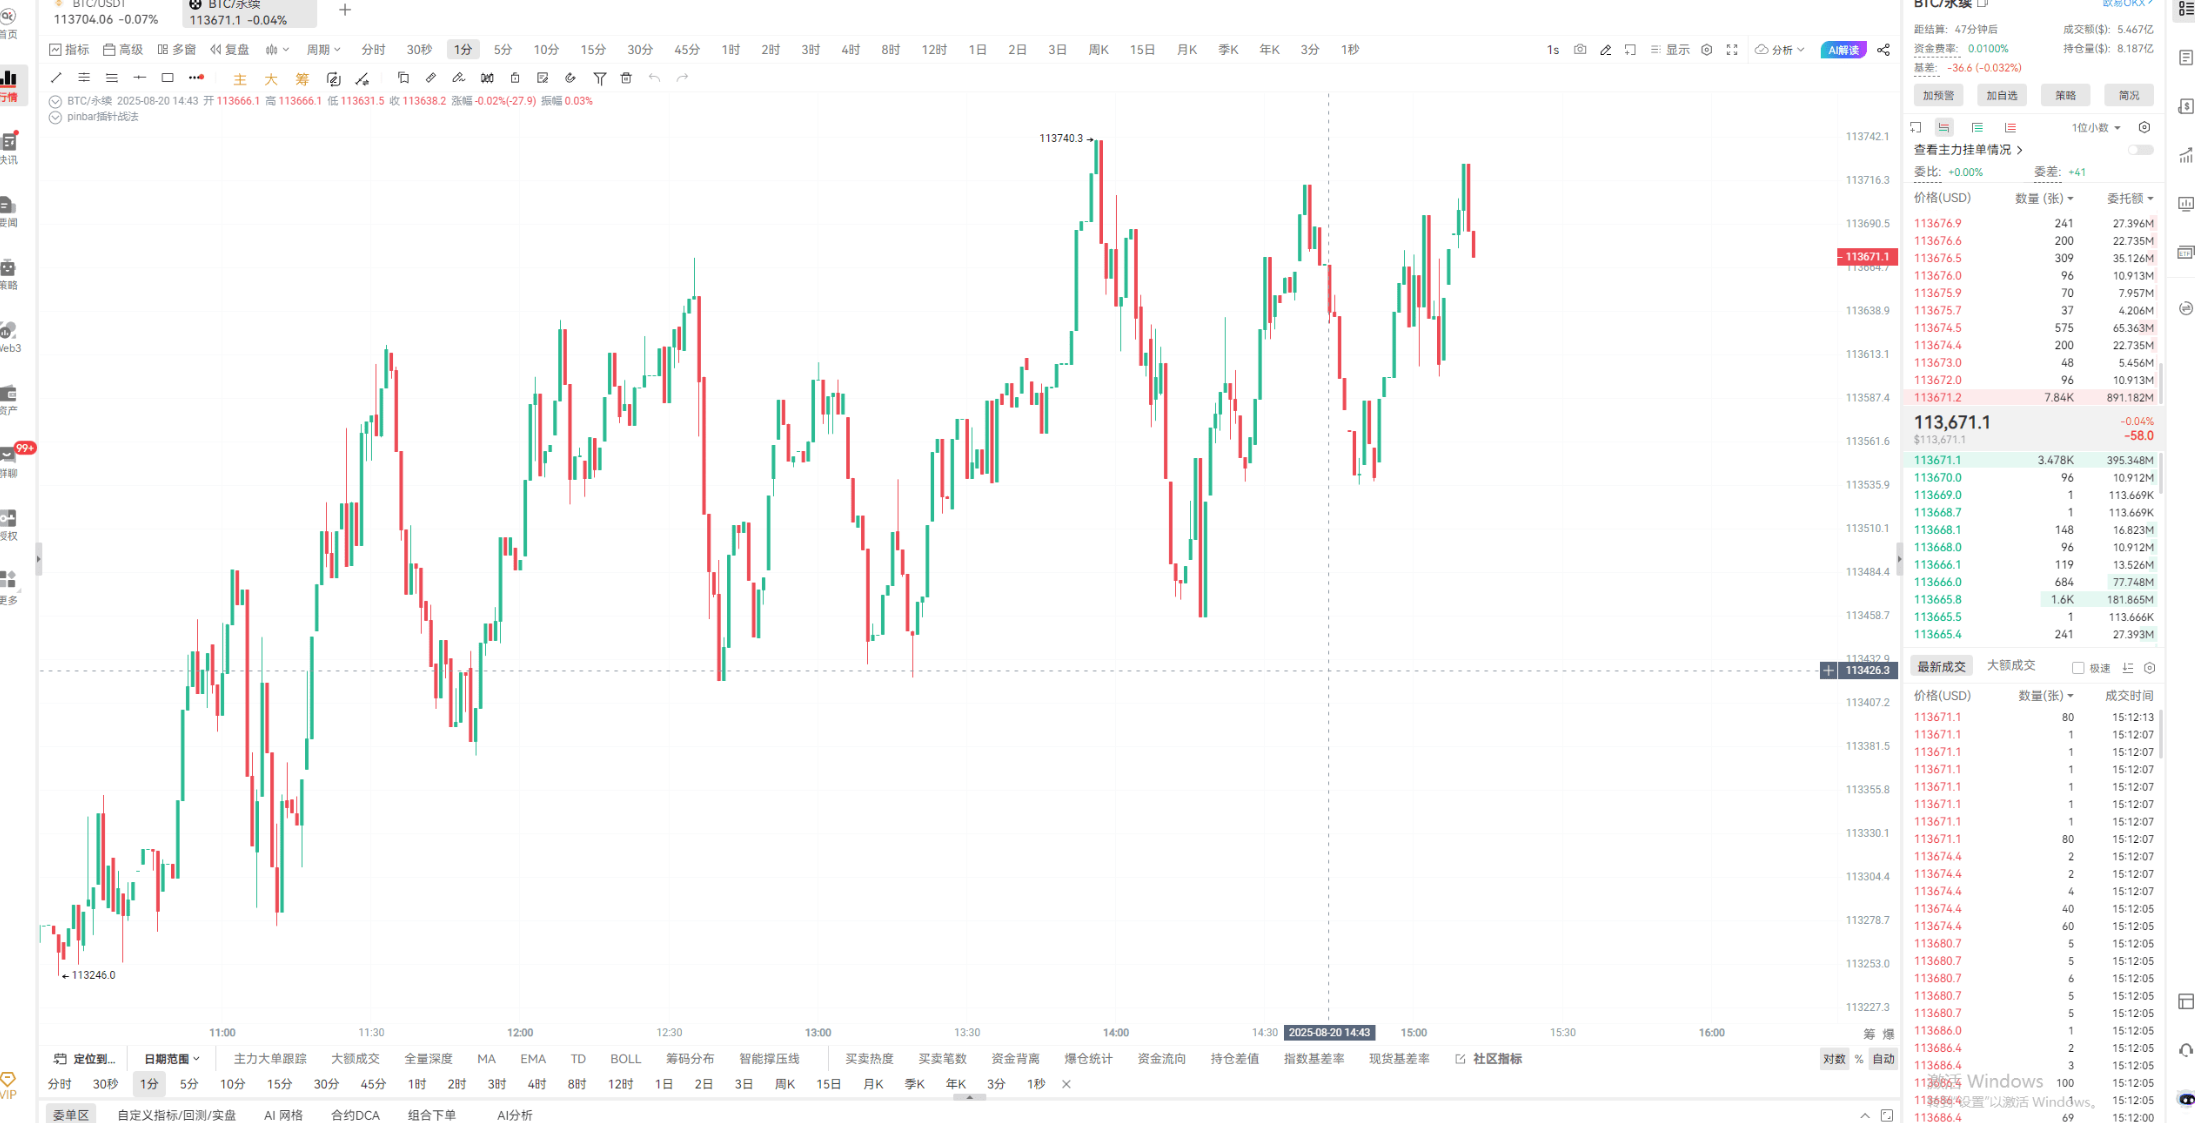
Next is the core K-line section.

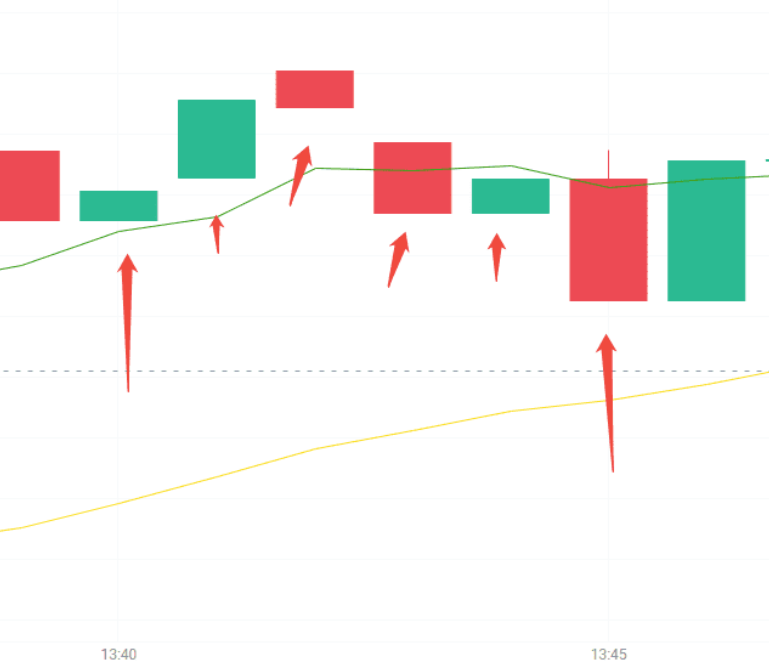
For beginners, looking at the K-line mainly means observing price increases and decreases. The colors in the cryptocurrency market are the opposite of those in the A-shares market: green indicates an increase and red indicates a decrease. So, while stock traders fear a sea of green, it might be a good thing for us, haha!
The MA indicator line we selected earlier is also present in the price line, showing golden crosses and death crosses. Does everyone remember how to judge these? If you forgot, I’ll repeat it again! A golden cross occurs when the MA line crosses above the price line, usually signaling an upward trend; a death cross occurs when the MA line crosses below the price line, usually signaling a downward trend. By combining this K-line chart, you can see many intersection points corresponding to price changes, which is the clever use of indicators. However, different cryptocurrencies and time frames will affect the effectiveness of the indicators, so they should be used in conjunction with actual conditions.
Next is the order area. The first part is the pending order area; clicking here will redirect you to the exchange to place an order.
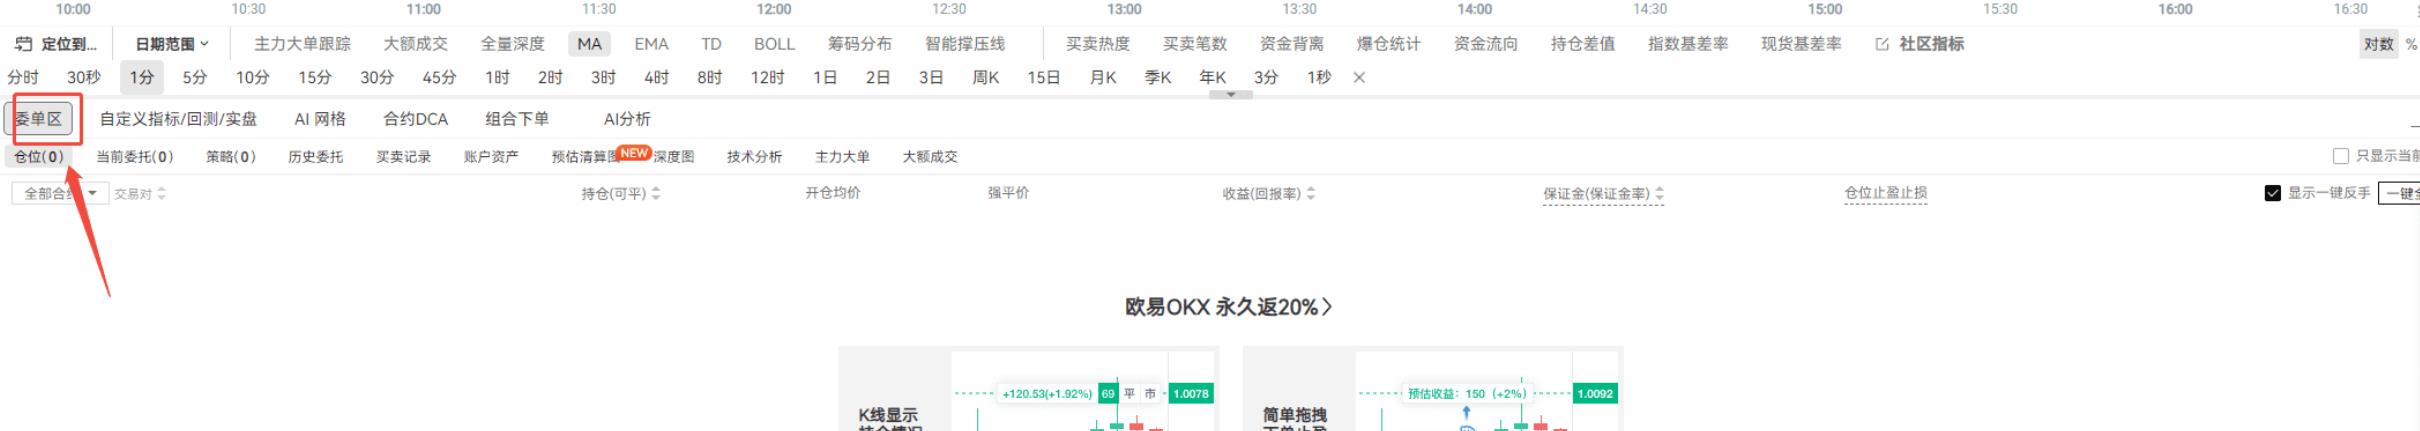
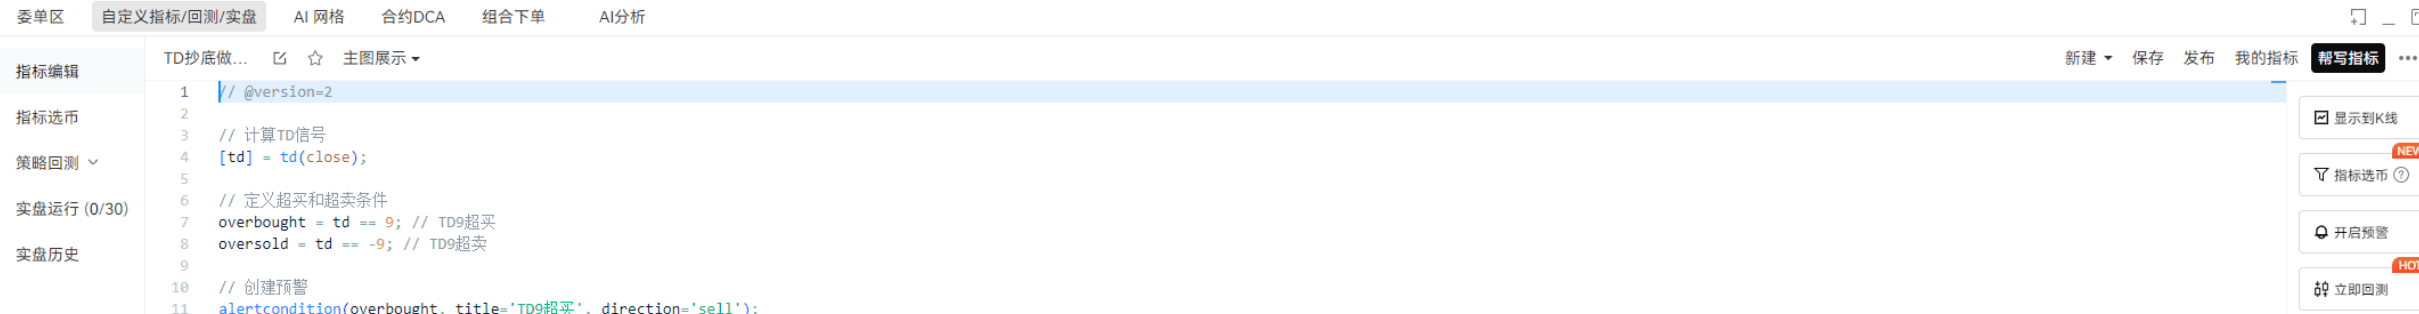
Next to it is the custom indicator, where you can set parameters for MA, EMA, and other lines. Those who can code can give it a try, or use the member-exclusive feature to have AiCoin's official team help you write it. Have any of you tried this?
Behind the order area, there is also a grid function.
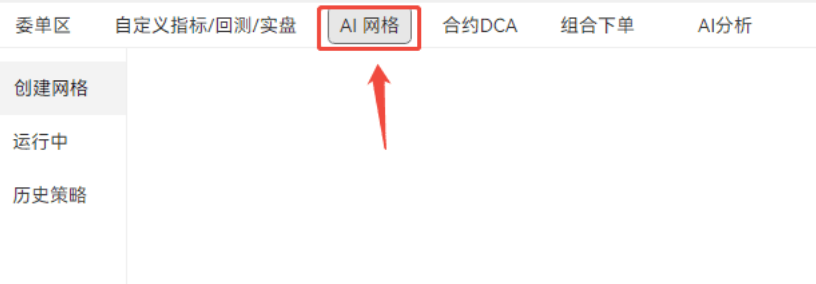
The grid is a trading method suitable for automated operations. By setting an upper limit price (selling point) and a lower limit price (buying point), trades will be executed automatically when the price reaches these points, profiting from price fluctuations. The advantage is that it can generate profits in stable or volatile markets without the need for manual monitoring; however, be cautious of losses in trending markets, accumulated fees, and risks from extreme market conditions. Beginners are advised to start small and adjust gradually. In simple terms, it’s automated buying and selling without needing to monitor the market 24/7.
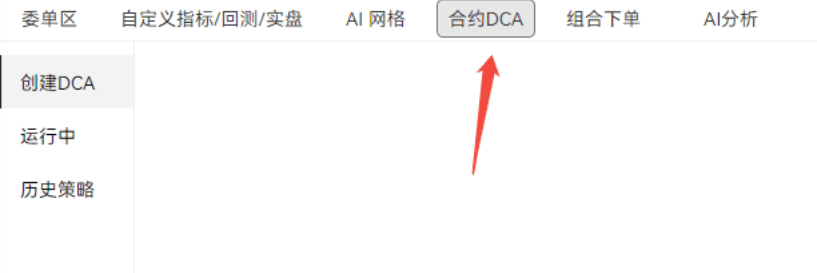
Next is DCA, which stands for Dollar-Cost Averaging in spot trading, a strategy of regularly buying a fixed amount.
Buying in batches can reduce timing risks and is suitable for long-term investors. The main difference between this and the grid method is that one is used more for long-term, while the other is used more for short-term. For those who believe in the long-term rise of cryptocurrencies, using DCA can smooth out costs. However, it’s still important to choose tools based on the situation, so I won’t elaborate further here.
The subsequent combined orders and AI analysis can be used as needed, but they are not frequently used. Let’s look at the right column.
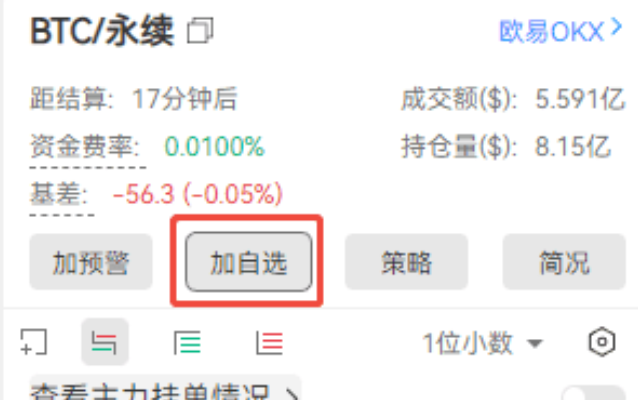
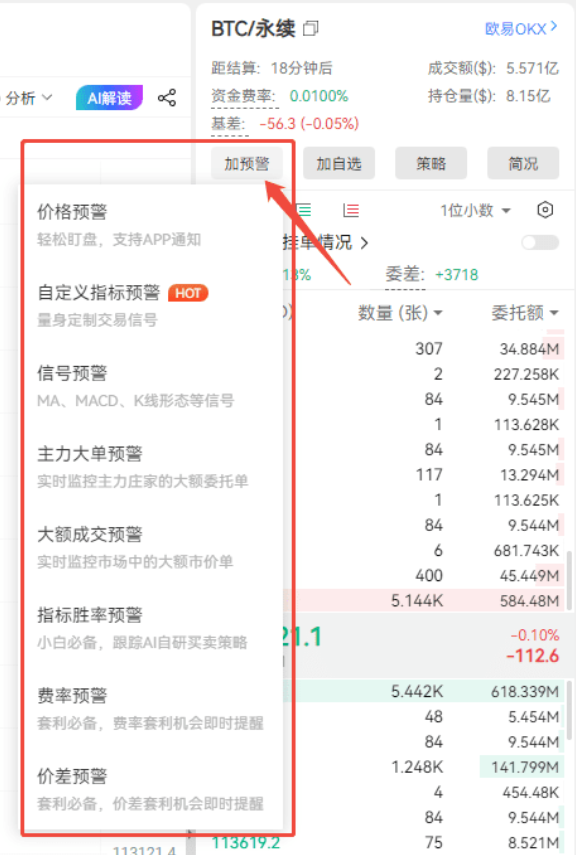
The information here is easy to understand, mainly providing introductions to the cryptocurrencies. You can use features like "Add Alert," for example, to set price alerts that will pop up when there are changes; "Add to Favorites" allows you to save for easy access next time.
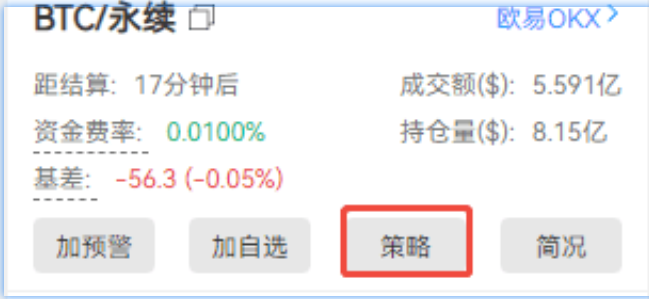
Clicking "Strategy" will redirect you to the strategy interface, where you can select suitable investment strategies.
The summary and the right column will display the cryptocurrency's history, news, capital flow, etc. Some investors use this information for decision-making, so feel free to check it out if you're interested.
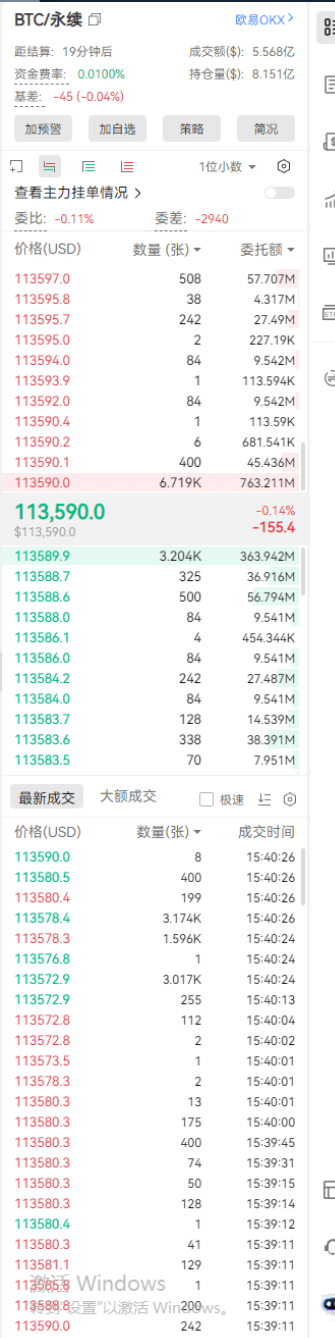
Finally, let’s look at this long string of numbers, which can be difficult to understand — the major orders.
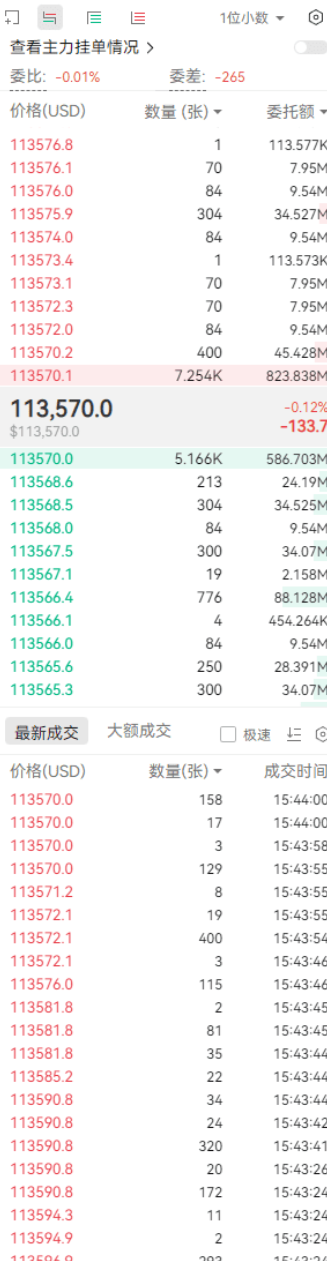
In simple terms, these are large buy and sell orders placed by big players or institutions, which have a significant impact on market liquidity and price fluctuations. Here, you will also find the order ratio and order difference.
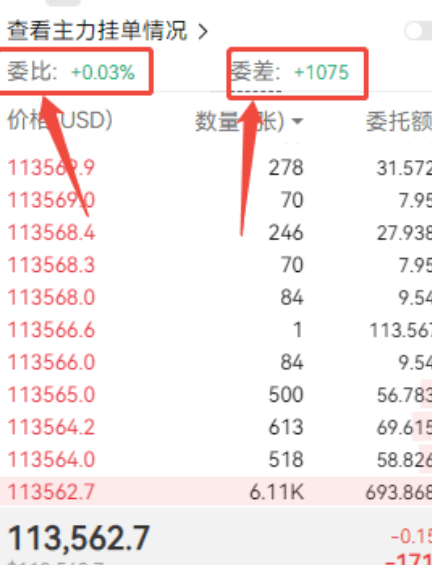
The order ratio is the ratio of buy orders to sell orders over a certain period, measuring the strength of the buy and sell orders; the order difference is the absolute difference in buy and sell orders, and the price difference between the highest buy price and the lowest sell price (liquidity spread). All of these are reference information for judging buy and sell actions. Those who have been in the A-shares market should be familiar with this, haha!
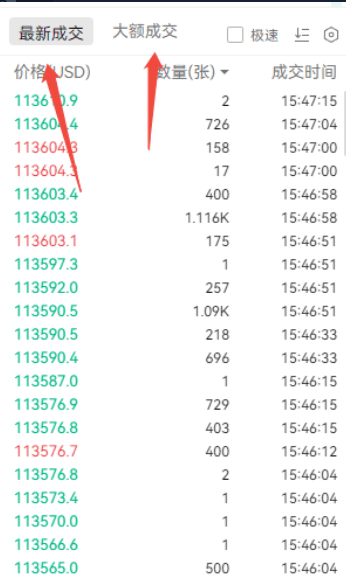
The latest transactions and large transactions below are easy to understand; the upper part shows pending orders, while the lower part shows actual transactions, both of which can serve as investment references.
Alright, that concludes the introduction to the K-line chart page!
Remember to tune in to AiCoin's live streams every Monday, Wednesday, and Thursday. You can find the group chat on the PC version and enter directly. We will occasionally invite industry experts to share insights, so don’t miss out!
This article only represents the author's personal views and does not reflect the stance or views of this platform. This article is for information sharing only and does not constitute any investment advice to anyone.
免责声明:本文章仅代表作者个人观点,不代表本平台的立场和观点。本文章仅供信息分享,不构成对任何人的任何投资建议。用户与作者之间的任何争议,与本平台无关。如网页中刊载的文章或图片涉及侵权,请提供相关的权利证明和身份证明发送邮件到support@aicoin.com,本平台相关工作人员将会进行核查。