
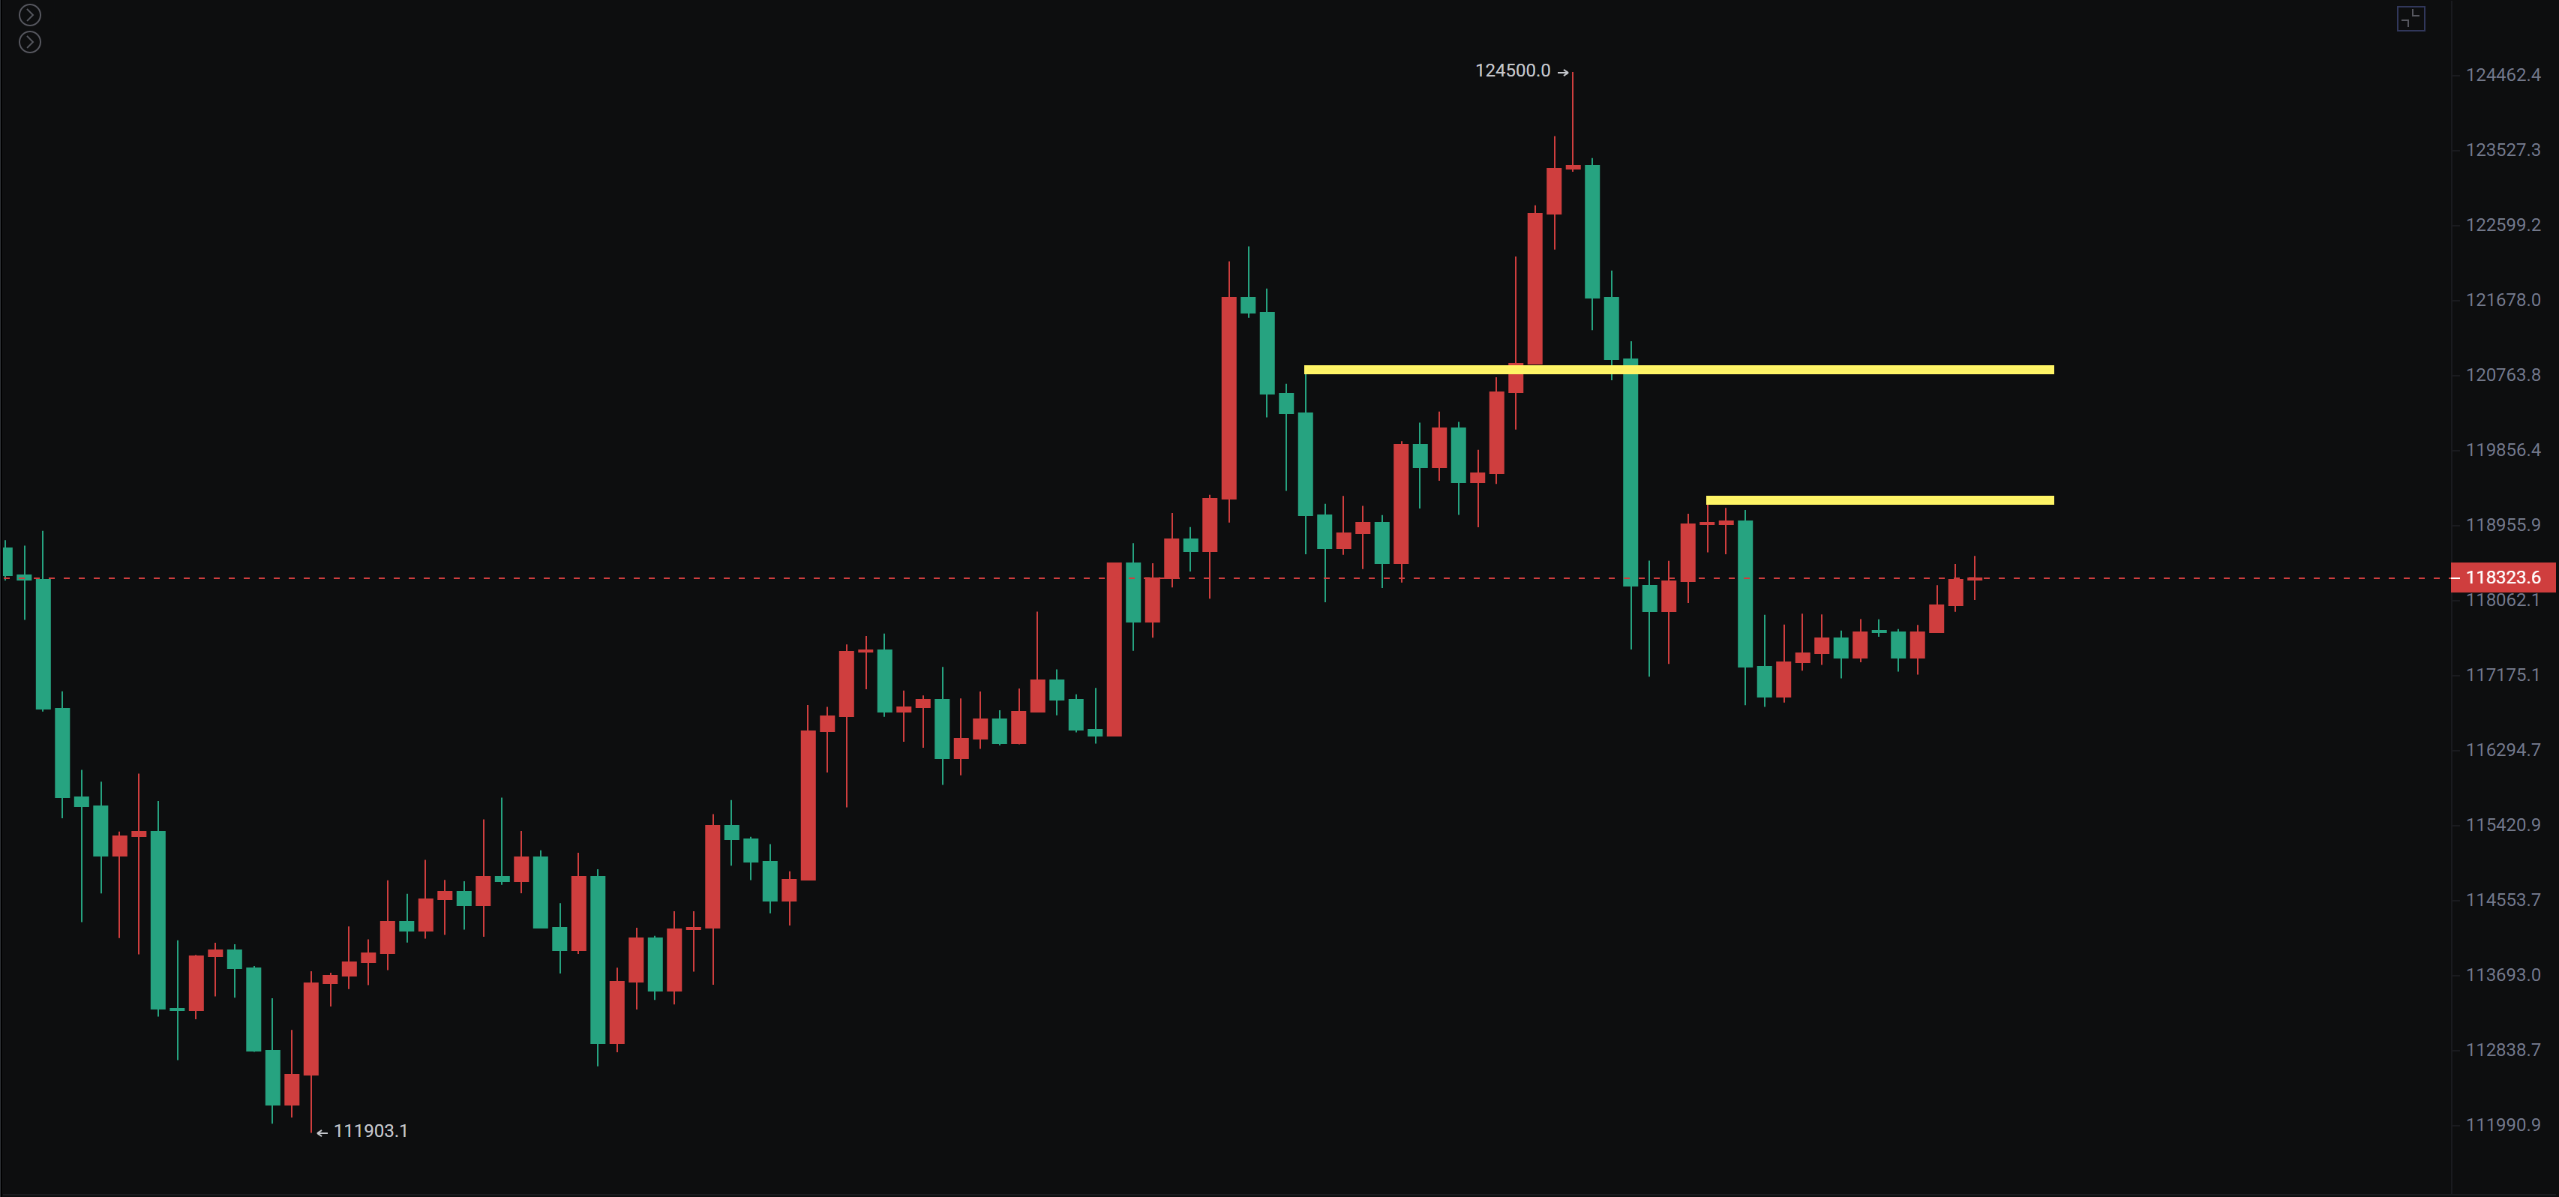
After Bitcoin reached a historical high, it has pulled back. Currently, there are two opinions in the market: one is that it will soon plummet, and the other is that it will continue to rise. Many friends have asked me how to view the market trend. From my perspective, if it does not break below 116,000, there is still a possibility of oscillating upwards, which could be a washout. However, if it breaks below 116,000 and cannot recover, the adjustment period will be prolonged.
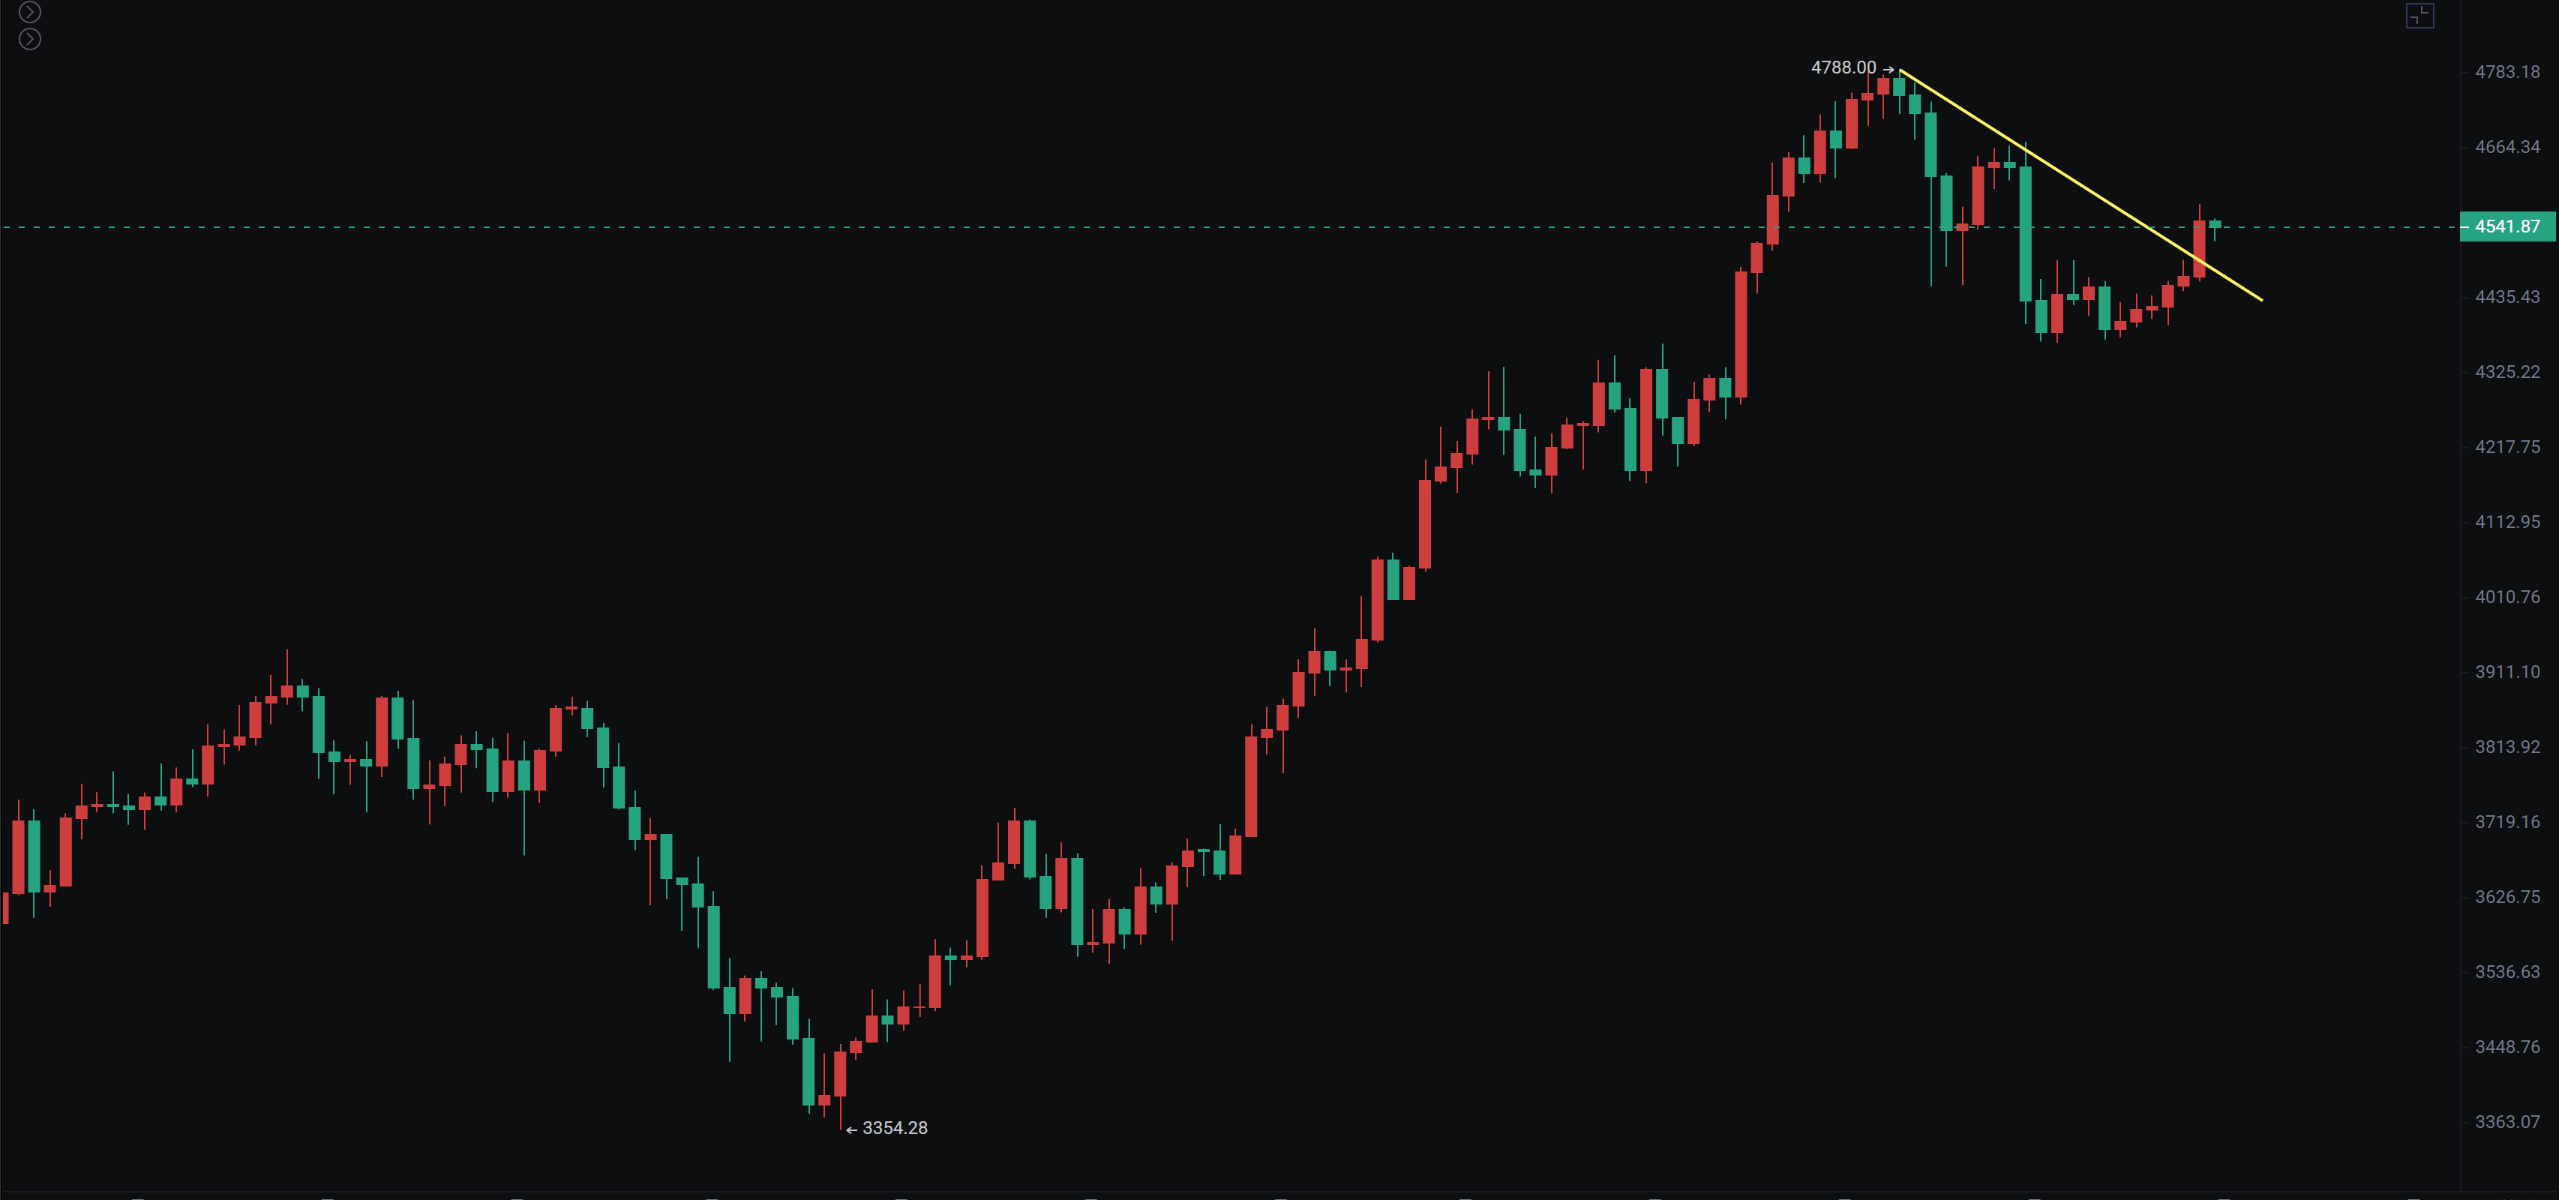
Ethereum is currently pulling back near its historical high, which is very normal. I previously reminded that a pullback would be faced between 4,500 and 4,800. Today, it continued to rebound upwards, so we need to pay attention to whether Ethereum will experience a second peak. If it cannot break through, the probability of a pullback will increase. However, if it breaks the high, we need to focus on whether Bitcoin can drive this trend without falling back.
Bitcoin
I have analyzed the overall structure of Bitcoin very clearly in my video; those interested can take a look. From the perspective of the long-term monthly chart, Bitcoin is actually performing very healthily. Of course, some short-term indicators do indicate a need for a pullback, but we should still prioritize the structural trend. The monthly MACD histogram is still above the zero line, with the fast and slow lines moving upwards. The weekly and daily MACD show divergence, so we first need to see if the rebound can hold above 121,000. If it cannot, the probability of a pullback will increase.
The daily line is still above the 20-day moving average, which provides support. Therefore, the first support level is the 20-day moving average, and the second is 116,000. Only a drop below 112,000 would pose a systemic risk of a significant drop, which still needs to be observed for now.
Support: 112,000 to 116,000
Resistance: 121,000 to 125,000
Ethereum
Ethereum is currently oscillating around 4,500 after pulling back from the previous bull market peak. We first need to see if this rebound can break the new high. If it cannot, we need to reduce our positions. Both the weekly and monthly charts for Ethereum are bullish, so there is still a demand for a rebound even at the daily level or smaller levels. The ETH/BTC exchange rate has already increased by 1.23 times. I previously mentioned that if the rebound is strong, there is a chance to touch the weekly MA120, which is also close to the M-top resistance.
If Bitcoin does not experience a systemic decline, Ethereum's drop will not be too large, with support at 4,160 to 4,330. Only a drop back to 4,100 would pose systemic risk.
Support: 4,160 to 4,330
Resistance: 4,788 to 4,868
Many altcoins have basically recovered from their declines, such as LINK, BNB, ADA…
If you like my views, please like, comment, and share. Let's navigate through the bull and bear markets together!!!
This article is time-sensitive and for reference only; it is updated in real-time.
Focusing on K-line technical research, sharing global investment opportunities. Official account: BTC Trading Prince Fusu

免责声明:本文章仅代表作者个人观点,不代表本平台的立场和观点。本文章仅供信息分享,不构成对任何人的任何投资建议。用户与作者之间的任何争议,与本平台无关。如网页中刊载的文章或图片涉及侵权,请提供相关的权利证明和身份证明发送邮件到support@aicoin.com,本平台相关工作人员将会进行核查。


