Analyst Chen Shu: Is the bullish trend ending and starting to weaken on August 16? Midday analysis and strategy for Bitcoin and Ethereum
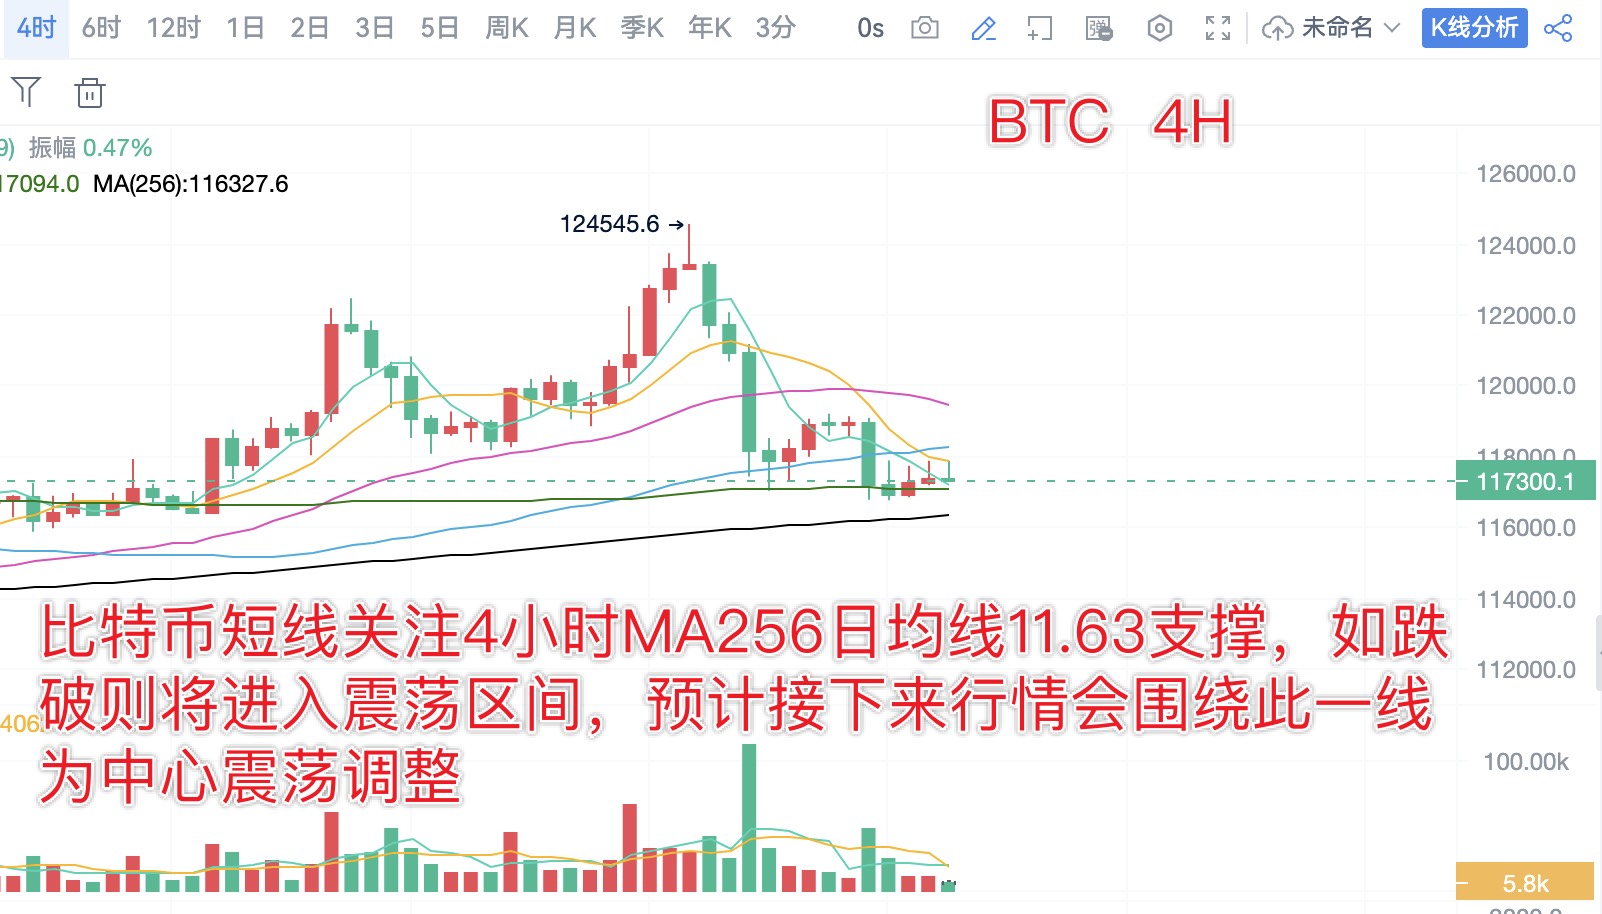
From the daily chart of Bitcoin, it once again closed with a small bearish candle yesterday, with the price touching the support level mentioned in the article at 11.75. If the pullback continues, the next support level to look at is the MA60 daily moving average at 11.35. On the 4-hour chart, it is about to drop to the MA256 daily moving average at 11.63. In the short term, pay attention to the support level at this line. From a trend perspective, the weekly closing candle currently shows a green candle with an upper shadow, indicating that the short-term bullish trend is likely over, and a period of consolidation and adjustment is needed. For the second half of the month, it is recommended to treat it as a consolidation phase.
From the daily chart of Ethereum, it once again closed with a green candle yesterday, breaking below the MA5 daily moving average. The support below is at the MA10 daily moving average at 4340. Looking at the weekly chart, it currently shows a long upper shadow. If the price cannot close above 4500, it is highly likely to enter a phase of consolidation and adjustment next week. In the short term, pay attention to the support level at 4200, and the resistance level to watch is 4520.
Midday trading strategy (writing time: 14:30):
BTC: The fluctuations on Saturday are not large, treat it as a range, with a range of 11.68-11.8 for high selling and low buying.
ETH: Treat it as a range of 4380-4520 for high selling and low buying.
The daily analysis strategy has a very high win rate! Analysis is not easy, so I hope everyone can give a free follow, bookmark, like, and comment. Thank you all, and feel free to leave comments below; I will reply to each one.

免责声明:本文章仅代表作者个人观点,不代表本平台的立场和观点。本文章仅供信息分享,不构成对任何人的任何投资建议。用户与作者之间的任何争议,与本平台无关。如网页中刊载的文章或图片涉及侵权,请提供相关的权利证明和身份证明发送邮件到support@aicoin.com,本平台相关工作人员将会进行核查。


