Written by: White55, Mars Finance
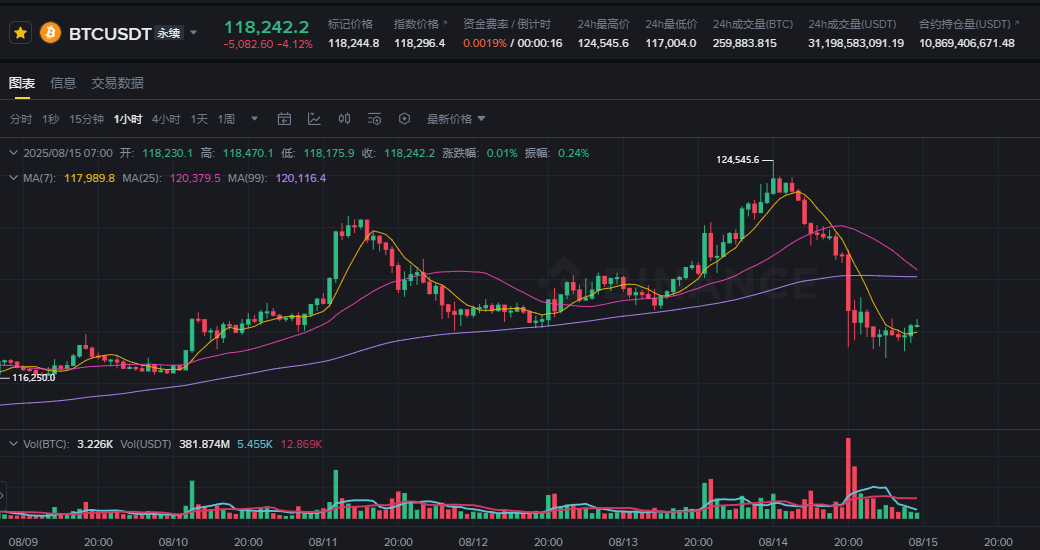
The Bitcoin market experienced a shocking scene on August 15. Just hours after reaching a historic high of $124,500, the Bitcoin price suddenly turned downward, rapidly breaking below the key support level of $117,500, with a daily decline of 4.24%, hitting a low of $117,000. This drop of up to $7,000 was like a bucket of cold water, extinguishing the market's recently ignited fervor.
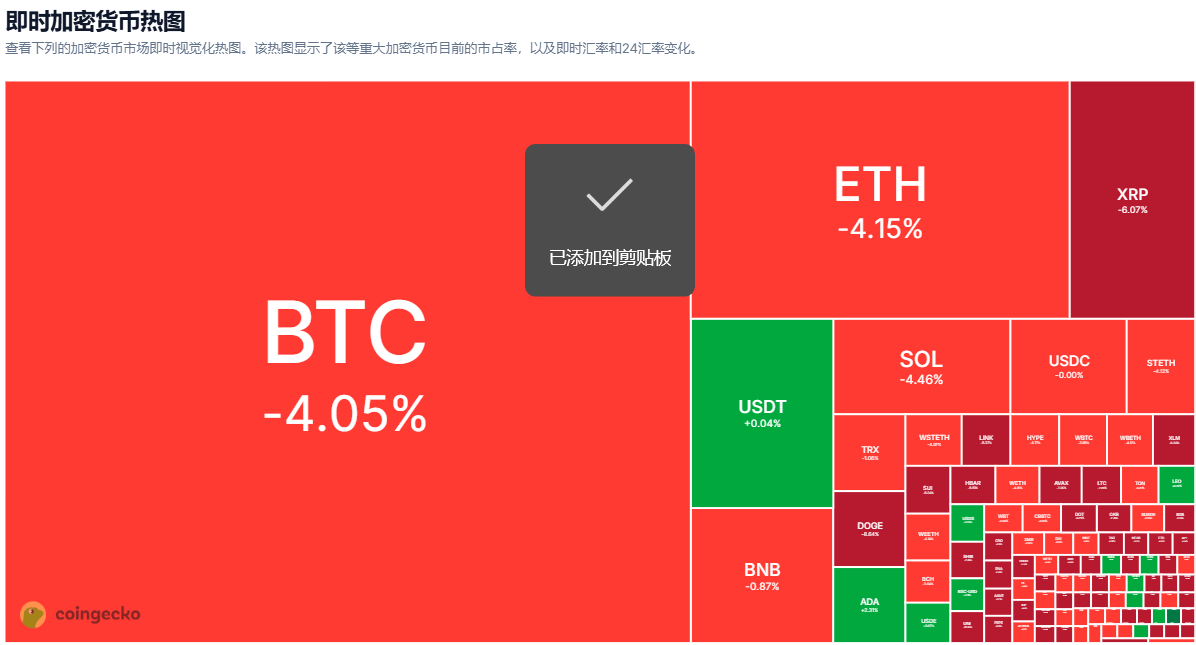
This flash crash was not an isolated incident. The total market capitalization of the crypto market evaporated by 3.9% within 24 hours, falling to $4.09 trillion. Ethereum followed Bitcoin's decline, dropping below the $4,500 mark, currently reported at $4,568.
The situation was even worse for altcoins, with Ethereum ecosystem tokens like REZ, SSV, and ORDI generally plummeting over 15%, leading to a complete rout.
The Return of the Inflation Ghost: A Fatal Reversal in Macroeconomic Data

The unexpected turnaround in U.S. inflation data became the direct trigger for this round of declines. The Producer Price Index (PPI) for July, released on August 14, surged by 3.3% year-on-year, far exceeding market expectations of 2.5% and the previous value of 2.3%, marking the largest monthly increase since June 2022. This starkly contrasted with the "moderate" CPI data released three days earlier — at that time, the overall CPI for July fell to 2.9%, and the core CPI had declined for four consecutive months to 3.2%, leading the market to anticipate a rate cut by the Federal Reserve.
Deep Anxiety Over Inflation Stickiness
Traders' intense reaction to the PPI data stems from its leading indicators for corporate costs and consumer prices. Higher producer prices will eventually be passed on to consumers, forcing companies to raise prices to maintain profit margins, creating an inflationary spiral. This signal quickly altered interest rate expectations: the CME FedWatch tool showed that while the market still anticipated a 90.5% chance of a rate cut in September, the probability of rates falling below 3.75% by January 2026 had dropped from 67% a week ago to 61%. The likelihood of the Federal Reserve delaying easing policies instantly drained the upward momentum of risk assets.
Warning Signals of Divergence Between Stocks and Cryptos
Ironically, the traditional stock market rebounded quickly after digesting the PPI data, with the S&P 500 index hitting record closing highs for three consecutive days, while Bitcoin found itself trapped in a vortex of selling. This phenomenon of divergence among risk assets reveals the fragility of the cryptocurrency market — when liquidity expectations undergo subtle changes, crypto assets often become the first targets for liquidation.
Failed Policy Expectations: The National Bitcoin Reserve Dream Shattered
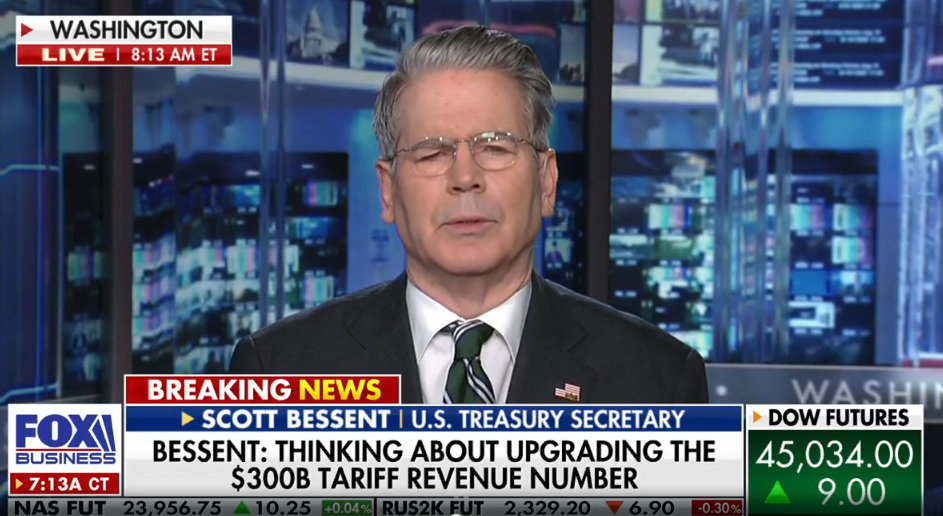 _Interview with Scott Benset. Source: _Foxbusiness.com
While the Bitcoin community was still dreaming of the U.S. government incorporating it into its strategic reserves, Treasury Secretary Scott Benset poured cold water on that hope. In an interview with Fox Business News, he clearly stated, "The government has no plans to expand its Bitcoin strategic reserves," and categorically denied the possibility of reallocating the gains from the revaluation of government bonds into Bitcoin.
The Disappointment of Trump's Executive Order Expectations
This statement created a significant gap with market expectations. An executive order signed by Trump in March had explicitly mentioned a "budget-neutral strategy for purchasing more Bitcoin," igniting institutional investors' imaginations about sovereign funds entering the market. Benset's remarks not only shattered this expectation but also exposed the discrepancies at the policy execution level. When the narrative of "digital gold" encounters a lack of sovereign credit backing, speculative funds quickly retreat, becoming an inevitable choice.
The Domino Effect of Regulatory Headwinds
The negative policy sentiment created a domino effect. Although the U.S. SEC withdrew lawsuits against some crypto projects, key legislation like the "GENIUS Act" is still progressing, and the ambiguity of the regulatory framework remains a Damocles' sword hanging overhead. Additionally, discussions in countries like Germany and Japan regarding sovereign Bitcoin reserves are still on paper, leaving institutional funds in a regulatory vacuum hesitant to enter the market in large numbers.
Technical Collapse: The Emergence of a Double Top and Leverage Slaughter
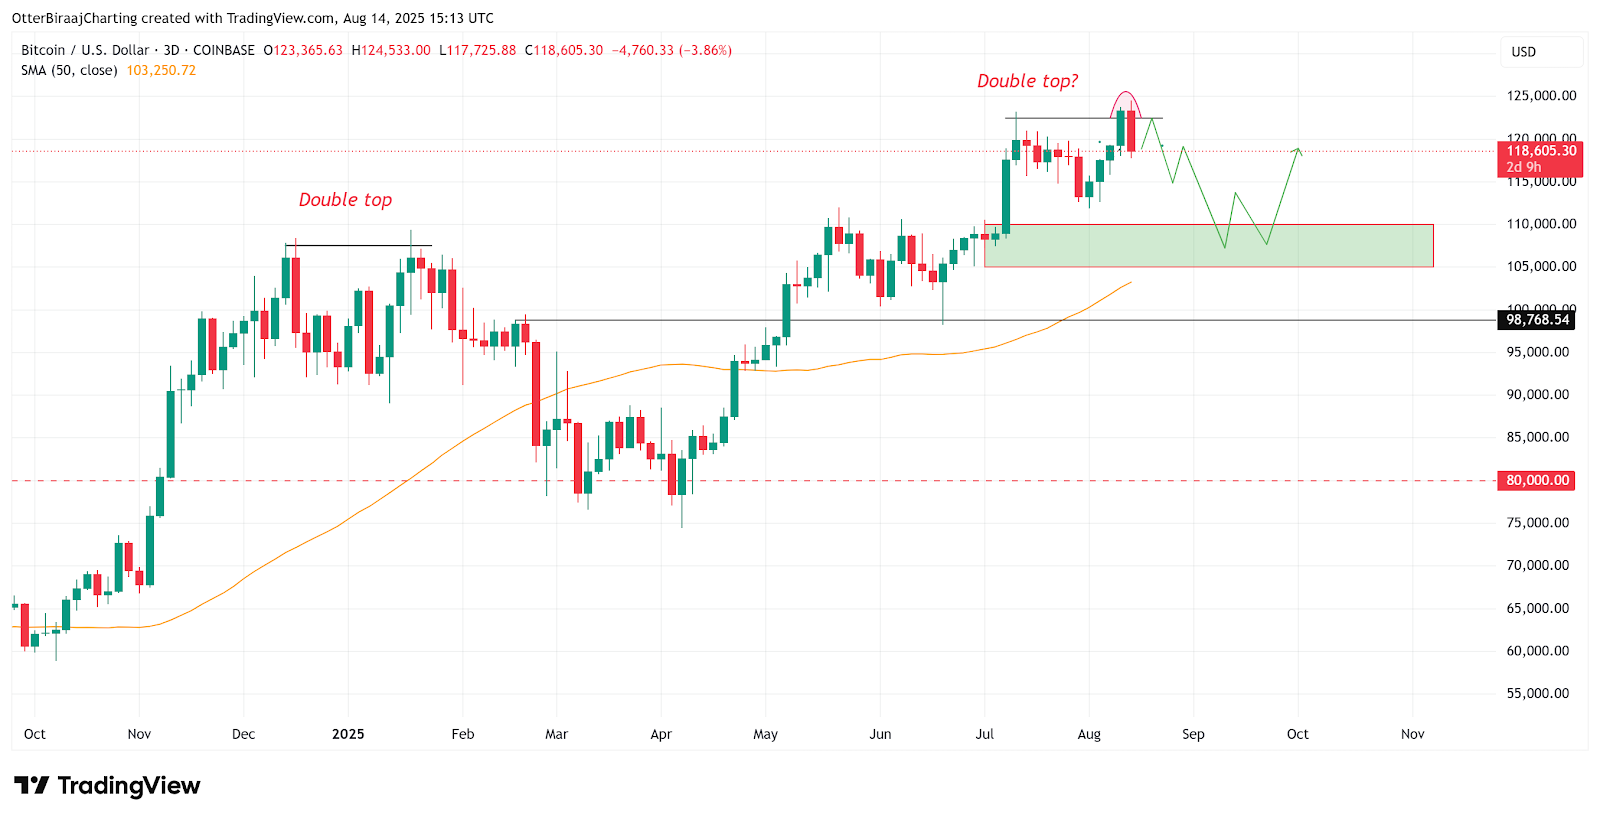 Three-day chart of Bitcoin. Source: TradingView
Under the cover of macroeconomic headwinds, Bitcoin's technical structure had already concealed dangers. When the price broke through $123,000 to reach a historic high, the Relative Strength Index (RSI) showed a bearish divergence, indicating a depletion of upward momentum. A more severe signal came from the three-day chart — Bitcoin formed a clear double top pattern, a structure that had previously triggered a 35% crash in January 2025.
Psychological Game at Key Support Levels
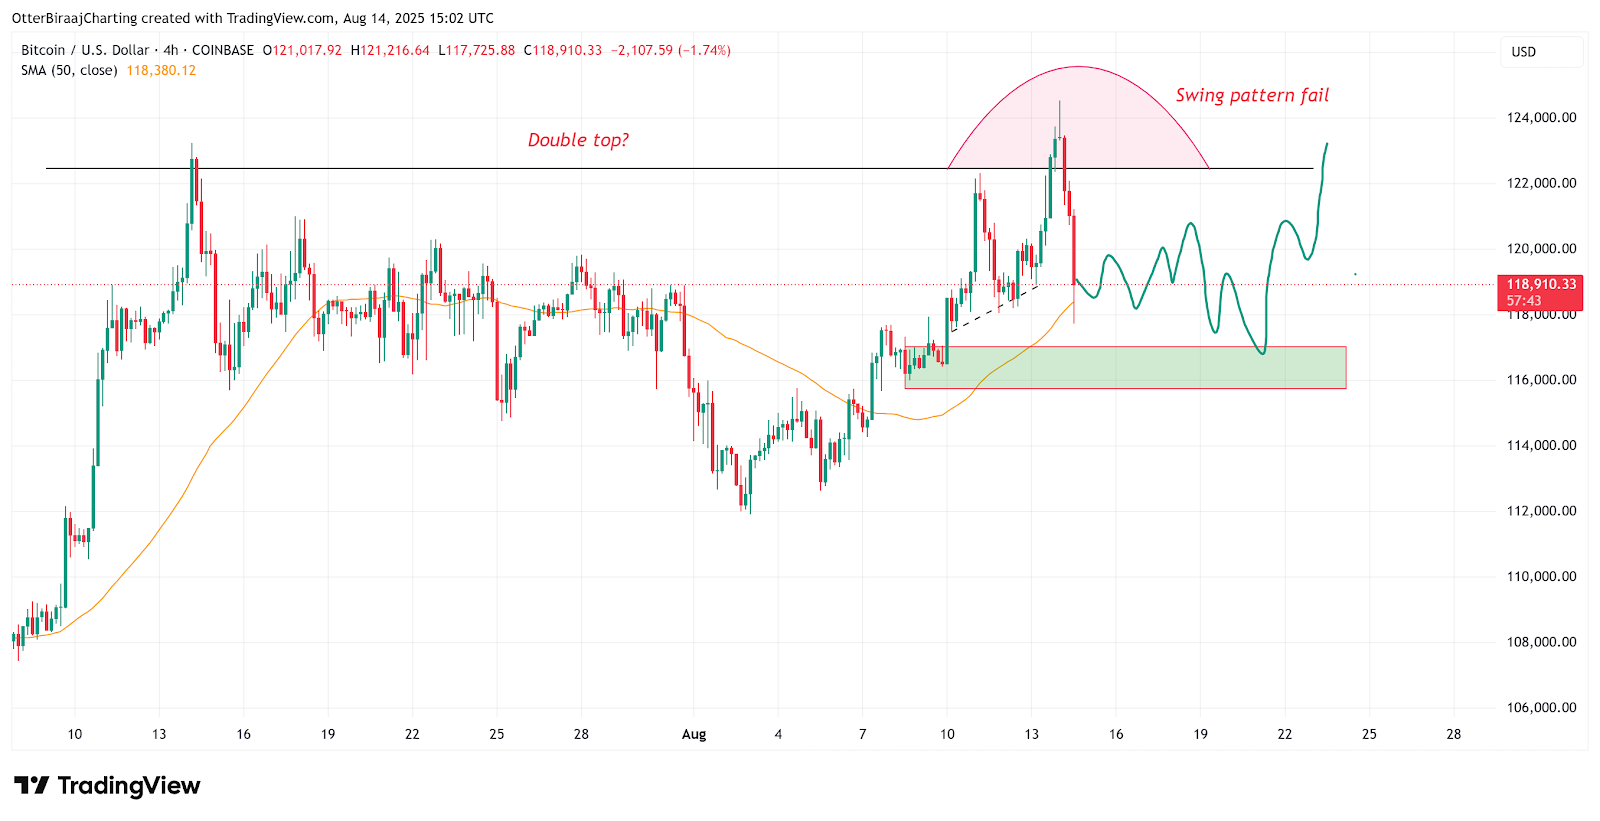 Four-hour chart of Bitcoin. Source: Cointelegraph
The market structure played out a life-and-death game at the $117,500 level. This key internal liquidity area, closely monitored by technical traders, would trigger a chain reaction of programmatic sell orders if breached. The appearance of a swing failure pattern on the four-hour chart indicates that the market is entering a phase of high volatility and oscillation. Currently, $112,000 has become the dividing line between bulls and bears; if effectively broken, it could lead to a deep correction towards the $105,000-$110,000 range.
The Death Spiral of Leverage Liquidation

The most severe impact during the crash was on leveraged long positions. When Bitcoin fell below $117,500, long positions worth up to $880 million were forcibly liquidated within 24 hours, resulting in a "long squeeze" tragedy. This passive selling, dominated by futures contracts, further amplified the declines in the spot market, turning the correction into a mini-crash.
The Calm Paradox in the Derivatives Market
_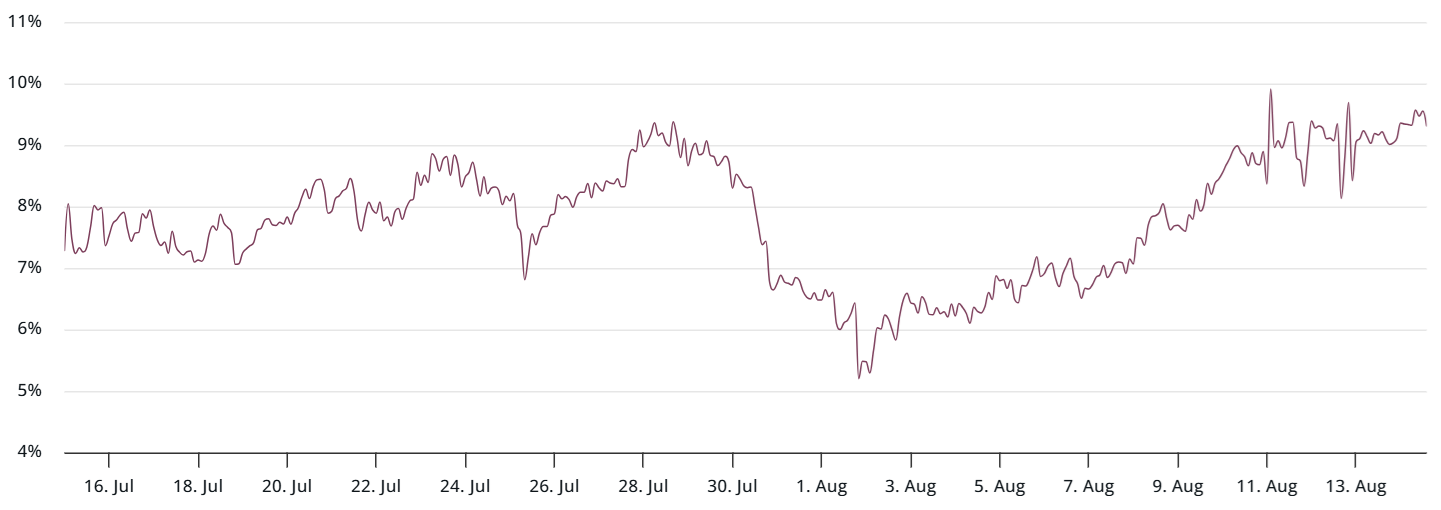 BTC 3-month futures annualized premium. Source: _laevitas.ch
In stark contrast to the panic in the spot and futures markets, professional derivatives traders displayed remarkable calm. The annualized premium for Bitcoin futures remained stable at 9%, holding within a neutral range of 5%-10%. This indicator proves that the historic high was not driven by excessive leverage, and professional funds still hold a cautiously optimistic view of the medium-term trend.
The Confidence Code in the Options Market
_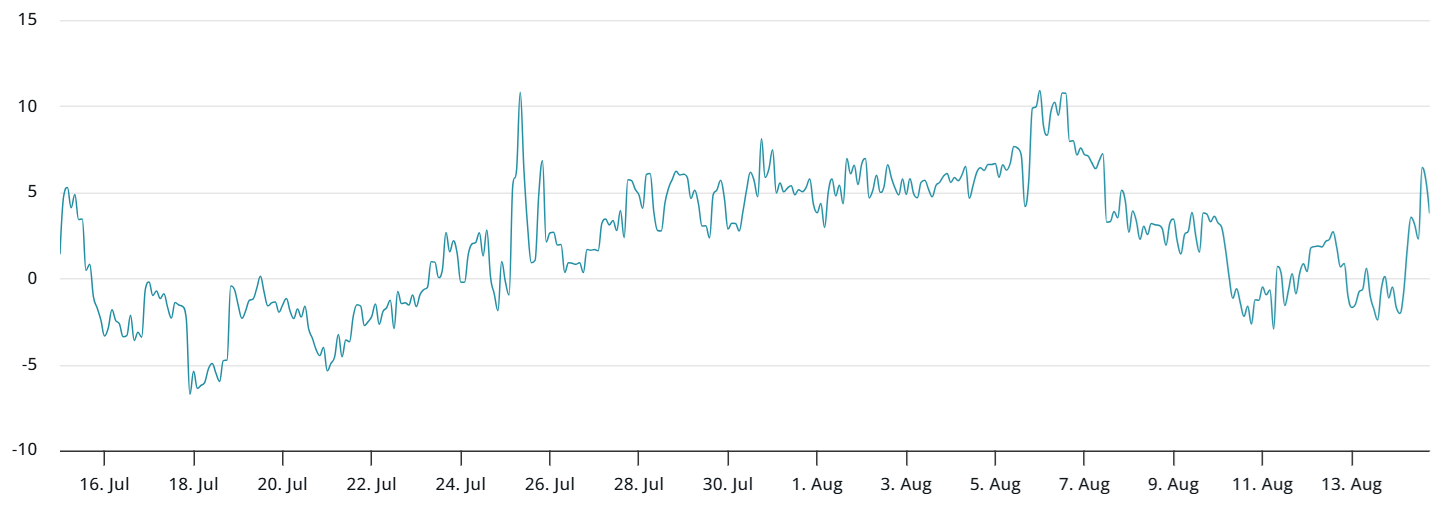 Deribit Bitcoin 30-day options Delta skew (put-call). Source: _laevitas.ch
The true confidence indicator comes from the options market. Despite the price's violent fluctuations, the Delta skew of Bitcoin's 30-day options was only 3%, far below the 6% bearish threshold. This means institutional investors have not massively purchased put options to hedge risks, and the core market sentiment remains neutral to strong. This divergence in sentiment between professional investors and retail traders reveals the differing judgments of market participants regarding the nature of the crash — professional traders view it as a healthy adjustment, while retail investors are caught in panic selling.
Whales' Contrarian Moves
On-chain data reveals the movements of smart money. Whale addresses holding over 1,000 BTC accumulated 18,000 Bitcoins during the crash, with costs concentrated in the $118,000 - $120,000 range. These "smart money" contrarian positions lay the groundwork for a market rebound.
In-Depth Analysis of Structural Contradictions
This round of Bitcoin's correction exposed deep structural contradictions in its market. When the Federal Reserve's meeting minutes signaled a rate cut and the S&P 500 index hit a historic high, Bitcoin weakened independently, revealing that its risk asset attributes still dominate. Despite being endowed with the "digital gold" halo, Bitcoin often behaves more like a substitute for tech stocks, highly correlated with traditional risk assets during actual market fluctuations.
The Lagging Effect of Liquidity Transmission
There is a high correlation of 0.94 between global M2 money supply growth and Bitcoin prices, but liquidity transmission takes time. As the Federal Reserve reduces quantitative tightening and market liquidity expectations improve, Bitcoin's sensitivity to policy has decreased, responding more directly to changes in real interest rates. This change in the monetary transmission mechanism makes Bitcoin more susceptible to short-term emotional shocks during policy windows.
Hedging Demand in Emerging Markets
A noteworthy regional change has emerged in the Latin American market. Trump's tariff policies have triggered capital flight from emerging markets like Brazil and Mexico, leading to a 40% surge in Bitcoin trading volume in these regions. When local fiat currencies face depreciation pressure, Bitcoin's role as a currency escape tool becomes prominent, providing invisible support for prices.
This flash crash exposed Bitcoin's vulnerability as an emerging asset — when inflation data reverses, policy expectations fail, and technical conditions deteriorate, creating a triple resonance, even robust derivatives indicators struggle to withstand the spread of panic. However, whales quietly acted at this moment, absorbing chips at costs between $105,000 and $108,000, planting the seeds for the next market cycle.
Market attention is now focused on the $112,000 key support level, which not only serves as a dividing line between bulls and bears but will also test whether Bitcoin can maintain the narrative logic of "digital gold." As the Federal Reserve's rate cut window in September approaches, along with the implementation of regulatory frameworks like the U.S. "GENIUS Act," this crash triggered by the inflation ghost may ultimately become Bitcoin's harsh rite of passage toward maturing as a financial asset.
免责声明:本文章仅代表作者个人观点,不代表本平台的立场和观点。本文章仅供信息分享,不构成对任何人的任何投资建议。用户与作者之间的任何争议,与本平台无关。如网页中刊载的文章或图片涉及侵权,请提供相关的权利证明和身份证明发送邮件到support@aicoin.com,本平台相关工作人员将会进行核查。


