Master Discusses Hot Topics:
To be honest, if you saw my macro analysis from last week yesterday, you shouldn't have been scared by Friday's market movements. I've mentioned multiple times that the medium to long-term bullish logic is still solid; the short-term is just a minor risk shock.
Additionally, tonight's U.S. July services PMI data will almost directly determine whether the market continues to speculate on a recession or takes a breather.
As long as it’s not significantly below expectations, there shouldn't be much of a problem. There’s also the ISM non-manufacturing index coming up, which will directly indicate how much recession expectation there is, and next week's CPI will determine whether stagflation is a real concern.
Back to the market, Ethereum exceeded expectations and bounced to 3735 this morning, but has now pulled back to the key level of 3660. Bitcoin is even weaker, with a rebound that is quite lackluster, completely dragging behind. The two key integer levels of 114K and 113K have also become important; if it really breaks below, it might just fall into a pit again.
With Bitcoin being so timid, I believe it could be a signal that U.S. stocks are nearing a peak. Yesterday's recovery looked decent, but market sentiment can change with a gust of wind, and everyone runs away, completely lacking confidence.
Yesterday's early high was 114950, and today it’s 115750. The highs are rising, but the range is too small, looking more like a sideways market. But this is a real rise; slow increases are what make a bull market, while a rapid surge can't hold.
To give a direct conclusion, 115.7K is the high point of the 8-hour pullback, and there’s still one last 12-hour pullback to come. If the bulls can exert some effort in the 116.2K-116.4K range, reaching 116.8K isn’t a dream, and then it will be a turning point.
I also looked at the recent contract liquidity distribution; the current price is not far from the short-seller liquidation zone. If this descending channel can break through, don’t doubt it, the bulls can make another move!
Above 120K, there’s a bunch of new short liquidity. What does that mean? In simple terms, as long as Bitcoin can reach 118K, the liquidation zone of the previous high will directly become a springboard. If it really breaks through, a lot of shorts will disappear.
The only thing currently suppressing the price is the spot market. There’s always spot selling when U.S. stocks open, and now it’s a battle between on-site funds and the dollar. However, last week’s non-farm data had quite a strong aftereffect, and the U.S. stock market is still caught up in recession sentiment, but the crypto market is doing fine.
But over in the U.S., it looks like they’re all set to trade on recession expectations. I hope this broken sentiment gets consumed quickly; otherwise, if it continues to decline and hits a new low, the entire bullish structure will be destroyed, and who would dare to play?
Now, talking about Ethereum, the 4-hour MACD is trying hard to climb above the zero line, but the momentum isn’t enough, so don’t be too aggressive in short trades. The 1-hour death cross is stable; wait for a lower position to enter. The lowest point last night was 3481, and today’s lowest is 3518, indicating that the bottom is rising, which is a signal.
This morning's 3735 was the high before the European session; if you’re entering the market now, focus on the low buy points between 3600-3646. If the rebound can push into the Fibonacci 0.618-0.66 golden pocket, 3741 is the key price level; if it can’t break through, it’s just a rebound high, but if it does, then it’s a real reversal!
Master Looks at Trends:
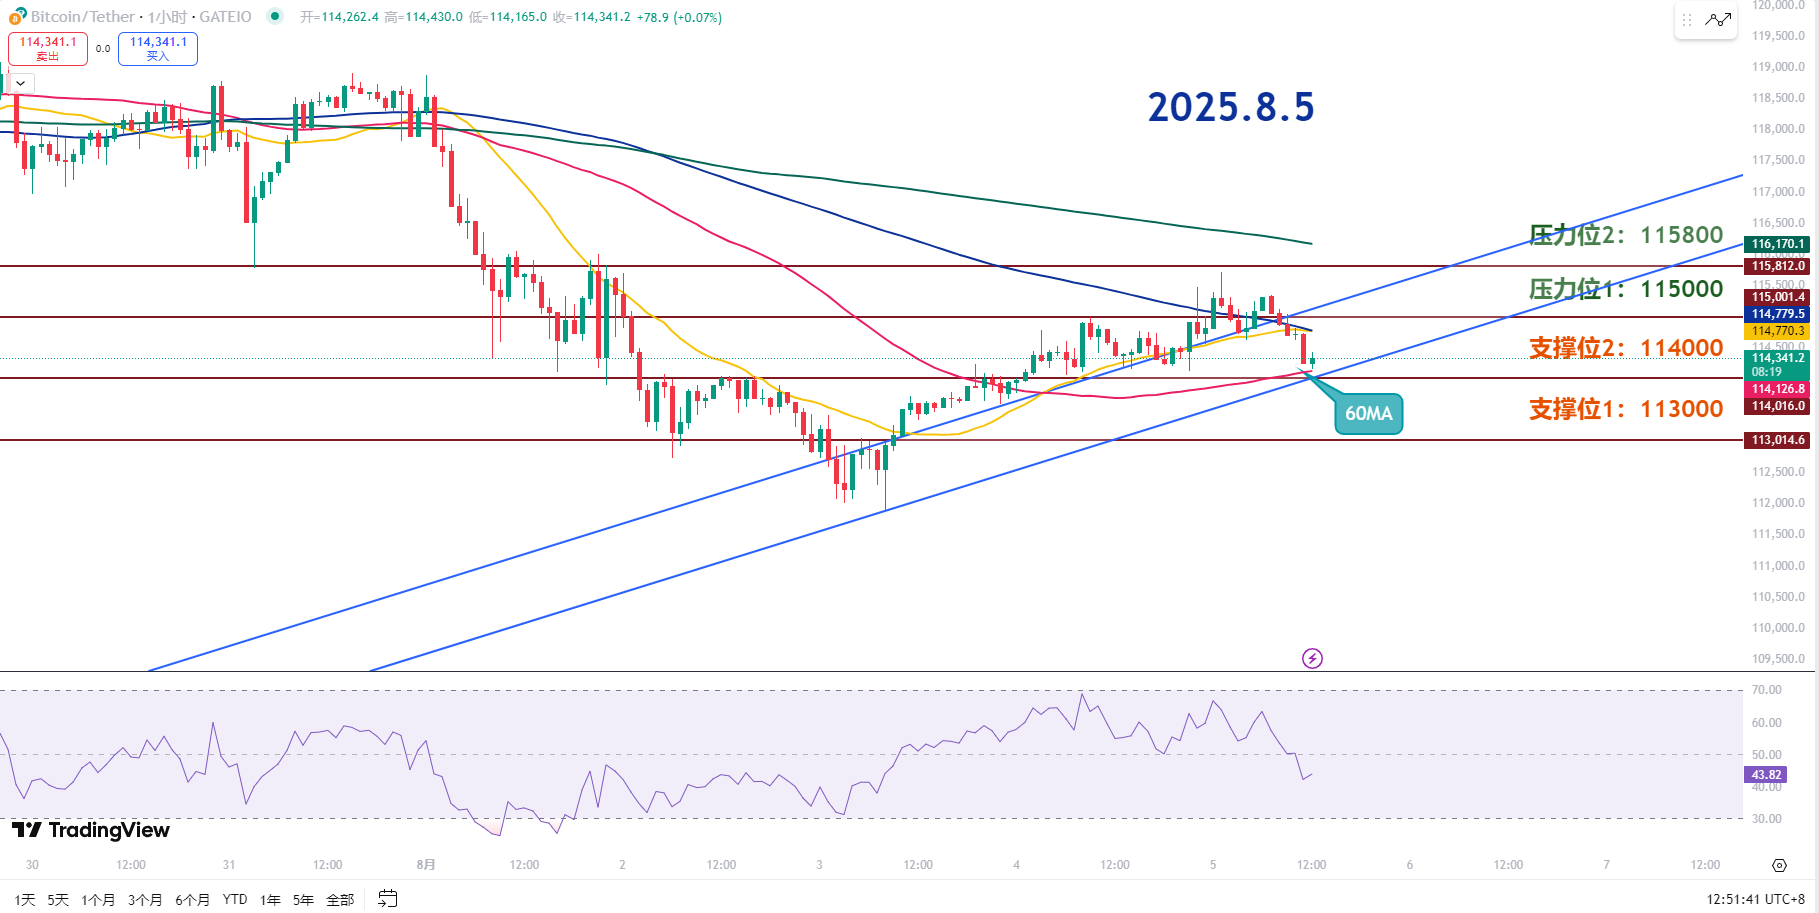
Resistance Level Reference:
Second Resistance Level: 115800
First Resistance Level: 115000
Support Level Reference:
Second Support Level: 114000
First Support Level: 113000
Since yesterday's close at 115.7K couldn’t break through, the upward trend line has also been broken, and now the price has returned to around 114K for a retest. If yesterday's low can be raised, support can continue to rise, but now it has dropped back again, and support and resistance remain the same as yesterday.
As long as it doesn’t drop below 114K again, the rebound logic can still be maintained. The trend line has been broken, increasing short-term downward risk, and the rebound can only be entered on a very short-term basis.
Currently, there isn’t enough basis to determine a bottom; selling pressure in the market is still present. Pay attention to the 1-hour 60 moving average trend, as this is the key level to expect a technical recovery rebound. If a higher low appears on a smaller timeframe, we can expect to continue testing 115K.
The first resistance at 115K is currently a strong resistance level, and there’s also pressure from the 120 moving average above. If there’s a rebound here, it’s advisable to exit short-term positions, as the short-term remains in a sideways oscillation pattern.
Only by breaking through the second resistance at 115.8K can we confirm the end of the adjustment. Until it breaks through, it’s still an adjustment market.
The first support at 114K is the position that was held yesterday and is also the previous high point of the breakout. If we want to maintain the rebound, this level must be held. If it breaks, it will trigger selling pressure. If 114K is lost, a short-term sharp drop will occur.
8.5 Master’s Band Strategy:
Long Entry Reference: Accumulate in the 113000-114000 range, Target: 115000-115800
Short Entry Reference: Not currently applicable
If you truly want to learn something from a blogger, you need to keep following them, rather than making hasty conclusions after just a few market observations. This market is filled with performers; today they screenshot long positions, and tomorrow they summarize short positions, making it seem like they "always catch the top and bottom," but in reality, it’s all hindsight. A truly worthy blogger will have trading logic that is consistent, coherent, and withstands scrutiny, rather than jumping in only when the market moves. Don’t be blinded by flashy data and out-of-context screenshots; long-term observation and deep understanding are necessary to discern who is a thinker and who is a dreamer!
This article is exclusively planned and published by Master Chen (WeChat public account: Coin God Master Chen). For more real-time investment strategies, solutions, spot trading, short, medium, and long-term contract trading techniques, operational skills, and knowledge about candlesticks, you can join Master Chen for learning and communication. A free experience group for fans has been opened, along with community live broadcasts and other quality experience projects!

Friendly Reminder: This article is only written by Master Chen on the official account (as shown above), and any other advertisements at the end of the article or in the comments are unrelated to the author!! Please be cautious in distinguishing authenticity, thank you for reading.
免责声明:本文章仅代表作者个人观点,不代表本平台的立场和观点。本文章仅供信息分享,不构成对任何人的任何投资建议。用户与作者之间的任何争议,与本平台无关。如网页中刊载的文章或图片涉及侵权,请提供相关的权利证明和身份证明发送邮件到support@aicoin.com,本平台相关工作人员将会进行核查。


