I. Core Principles of MACD
MACD is known as the "King of Indicators" in the investment market and has always been one of the most valued indicators. On many well-known market platforms like AICoin, MACD has been the default display indicator. It is a trend-following technical indicator based on moving averages, primarily measuring market momentum changes by utilizing the differences between short-term and long-term moving averages, while further smoothing the data to eliminate noise and identify trend signals. MACD can accommodate both market trends and oscillating conditions, making it a very important and widely used tool in technical analysis.
- Components: Basic Structure of MACD
The MACD indicator consists of the following three parts, each conveying different information:
● DIF (Fast Line): DIF is the difference between the short-term EMA and the long-term EMA, directly reflecting changes in market momentum. When DIF rises, market momentum strengthens; when it falls, market momentum weakens. DIF is the core calculation line of MACD.
● DEA (Slow Line): DEA further smooths the DIF (usually the 9-day EMA of DIF), filtering out some market volatility interference, making trend signals more intuitive and clear.
● Histogram: The histogram represents the difference between DIF and DEA, visually displaying the strength of market momentum changes. An increase in the histogram indicates strengthening momentum, while a decrease indicates weakening momentum.
- Basic Principles: How MACD Works
MACD is based on the dynamic relationship between short-term EMA (such as 12-day) and long-term EMA (such as 26-day), gradually smoothing and quantifying changes in market momentum, mainly reflected in the following three aspects:
● Zero Axis and Bull-Bear Transition: The fluctuations of DIF and DEA around the zero axis act as a boundary between bulls and bears. Crossing the zero axis usually signifies an important reversal in market trends, marking the alternation of bullish and bearish forces.
● Cross Signals: When the fast line DIF crosses above the slow line DEA, it indicates that market momentum is beginning to strengthen, signaling a buy; conversely, when the fast line crosses below the slow line, it indicates weakening market momentum, signaling a sell.
● Histogram Changes: The growth and shrinkage of the histogram reflect changes in market momentum strength, helping traders quickly assess whether the trend is continuing or weakening.
- Characteristic Advantages: Applicability of MACD
As a tool for tracking market trends and measuring momentum, MACD has the following characteristics:
● Trend Sensitivity: The interaction between DIF and DEA is suitable for capturing important reversals in trending markets, such as trend beginnings, endings, or accelerations.
● Applicability in Oscillating Markets: The MACD histogram can dynamically reflect increases or decreases in market momentum, aiding in identifying false breakouts or trend reversals in range-bound oscillating markets.
● Signal Intuitiveness: Through the zero axis, crossover points, and changes in the histogram, MACD can visually convey market momentum, providing references for trading decisions.
- Application Scenarios: Practical Uses of MACD
MACD is widely used in various trading scenarios, providing traders with clear judgments and entry/exit criteria:
● Trend Tracking: The cross of MACD's fast and slow lines and zero axis crossings are commonly used to identify buy and sell signals in trending markets. For example, buy when DIF crosses above DEA, and sell when it crosses below DEA.
● Trend Strength Measurement: The size of the histogram indicates the strength of the trend's momentum; when the histogram expands with rising prices, momentum is strong; when it shrinks with falling prices, momentum weakens.
● Divergence Signal Identification: When market prices diverge from the MACD indicator trend (e.g., prices make new highs but MACD does not), it usually indicates a potential trend reversal.
- Technical Logic: Characteristics of MACD Construction
Compared to other technical indicators, MACD's calculation logic achieves momentum quantification and trend filtering through double smoothing:
● Eliminating Market Noise: EMA reduces the impact of short-term fluctuations by calculating closing prices, allowing traders to focus on the main market trend.
● Dual Filter for Momentum: The fast line DIF captures short-term momentum changes, while the slow line DEA further smooths the fast line, thereby improving signal accuracy.
● Applicable Across Multiple Markets: Whether in stocks, futures, forex, or cryptocurrency markets, MACD can effectively perform trend and momentum analysis.
II. DIF Crossing the Zero Axis
The crossing of the DIF line through the zero axis in the MACD indicator is an important trend signal, revealing not only changes in market momentum but also providing a clear judgment about the overall market direction. Fast line parameter: 12, slow line parameter: 26
The following points discuss different scenarios of the DIF line crossing the zero axis and their operational strategies:
- DIF Crosses Above Zero: Bullish Trend, Suggest Short to Medium-Term Long Positions
When the DIF line crosses from below to above the zero axis, it indicates that the short-term moving average (usually the fast line) has begun to exceed the long-term moving average (usually the slow line), and the market's short-term momentum is gradually strengthening. This phenomenon typically reflects that the market has officially entered a bullish environment, with price trends leaning upwards.
Market Interpretation: The crossing of DIF above the zero axis shows that bearish forces are weakening while bullish forces are strengthening, potentially beginning to form a new upward trend. This is usually accompanied by the histogram gradually shifting from negative to positive, further confirming that the market has entered an upward phase.
Operational Strategy: At this point, the trend is bullish, and it is recommended that short to medium-term traders actively seek long opportunities. They can follow up on long positions after confirming the DIF crosses above the zero axis, combining other indicators (such as candlestick patterns or support and resistance levels) to strengthen trading signals. If the market was previously in a range-bound or slightly declining phase, crossing above the zero axis is often seen as the initial signal of an upward trend.
- DIF Crosses Below Zero: Bearish Trend, Suggest Short to Medium-Term Short Positions
When the DIF line crosses from above to below the zero axis, it suggests that the short-term moving average (fast line) has fallen below the long-term moving average (slow line), and the market's short-term momentum begins to weaken, with price trends often leaning downwards. This usually indicates that the market has overall entered a bearish dominant period, with further declines likely to occur.
Market Interpretation: The crossing of DIF below the zero axis is an important signal of the market transitioning from a bullish environment to a bearish one, indicating that selling pressure is continuously increasing. The histogram will gradually change from positive to negative, reinforcing the market's downward trend. This signal is generally more suitable for capturing market reversals in short to medium-term trading.
Operational Strategy: For the scenario where DIF crosses below the zero axis, it is recommended that short to medium-term traders adopt a neutral to bearish strategy and conduct short positions as appropriate. Of course, in extreme cases, if the histogram shows rapid expansion and market momentum is very strong, traders can increase their short positions accordingly. For traders with a conservative trend approach, they may consider reducing long positions or waiting for further trend confirmation.
- Zero Axis as a Trend Boundary: Assessing Market Environment
The zero axis, as an important reference point for the DIF line, can be seen as the boundary of the overall market trend. When the DIF is above the zero axis, the market is generally in a bullish environment; when the DIF is below the zero axis, the market tends to be bearish.
Trend Interpretation: The zero axis has a significant emotional boundary effect. When prices operate above the zero axis, it usually indicates that overall market sentiment is bullish, while when prices fall below the zero axis, it indicates that bearish sentiment dominates the market. The zero axis is both a point of contention between short-term and long-term moving averages and a key point for market direction changes.
Operational Guidance: For traders seeking stability, they can adjust their positions based on the position of the DIF. For example, when the DIF has been running above the zero axis for an extended period, they should focus on holding or increasing long positions; conversely, when the DIF remains below the zero axis, they may consider adjusting their positions to accommodate potential downside risks. Additionally, confirming the strength of momentum near the zero axis through histogram changes is highly beneficial.
- DIF Repeatedly Crossing the Zero Axis: Operational Strategy in Oscillating Markets
In some oscillating markets, the DIF may repeatedly cross the zero axis, alternating up and down. This situation does not necessarily indicate a significant trend reversal but may rather reflect the market's volatility characteristics when lacking a clear direction.
Market Interpretation: The repeated crossing of the DIF line through the zero axis typically reflects that the market is in a range-bound oscillation phase, where both bullish and bearish forces are significant but have not formed a long-term trend. The histogram may show alternating peaks and troughs with relatively narrow amplitudes.
Operational Strategy: In response to oscillating markets, when traders notice the DIF line frequently crossing the zero axis, they should reduce trend-based unilateral operations and adopt flexible range trading strategies (such as shorting at high points and going long at low points). At the same time, it is crucial to pay attention to whether the changes in the histogram during zero axis crossings exhibit continuity to assess whether there is momentum supporting a trend breakout.
III. Effectiveness of DIF Crossing the Zero Axis Signal
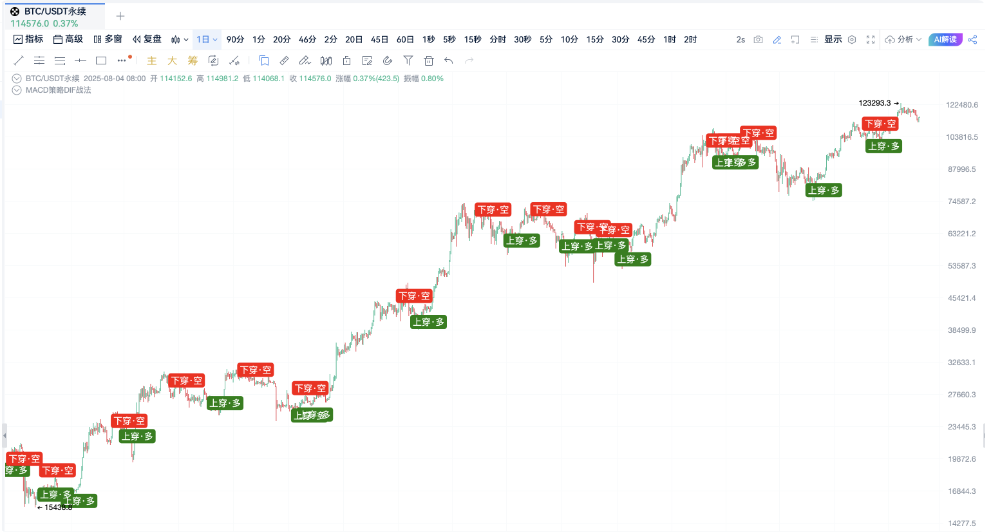
Chart OKX-BTCUSDT Perpetual Contract Daily Cycle
Signal Description:
Green Background: Crosses Above Zero Axis · Bullish Trend
Red Background: Crosses Below Zero Axis · Bearish Trend
IV. Using DIF Crossing the Zero Axis Indicator to Select Coins
Function Location: Custom Indicators/Backtesting/Live Trading - Indicator Coin Selection
Coin Selection Criteria:
Market Cap: Top 100, 24H Trading Volume: >= 100 million, Coin Selection Cycle: 4H
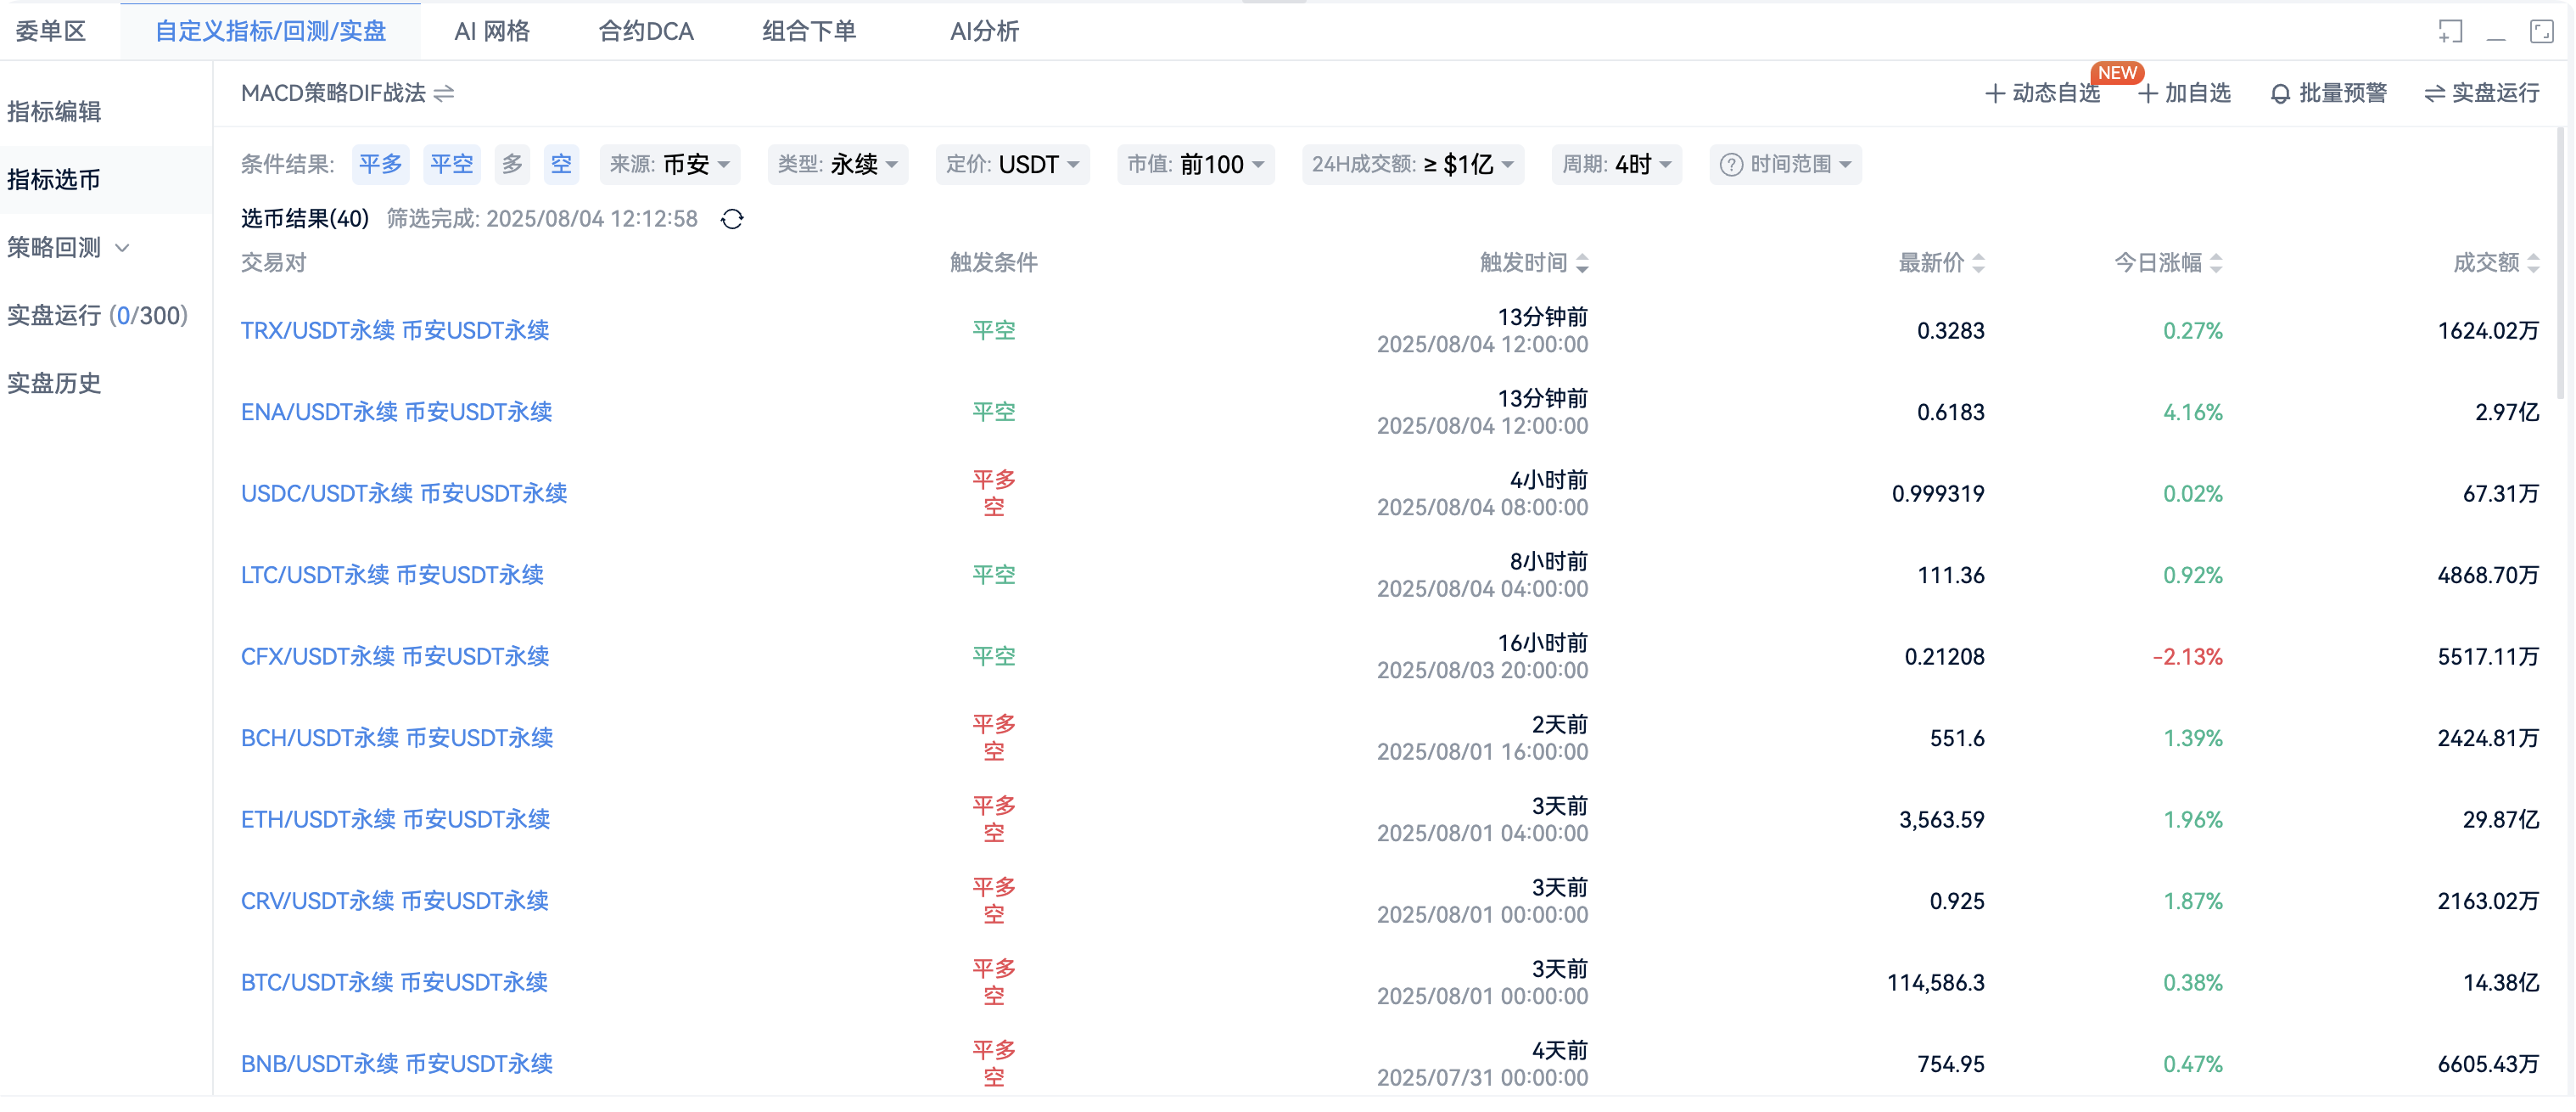
Coin Selection Result Evaluation: The selected coins' trends are consistent with the direction indicated by the signals.
Example:
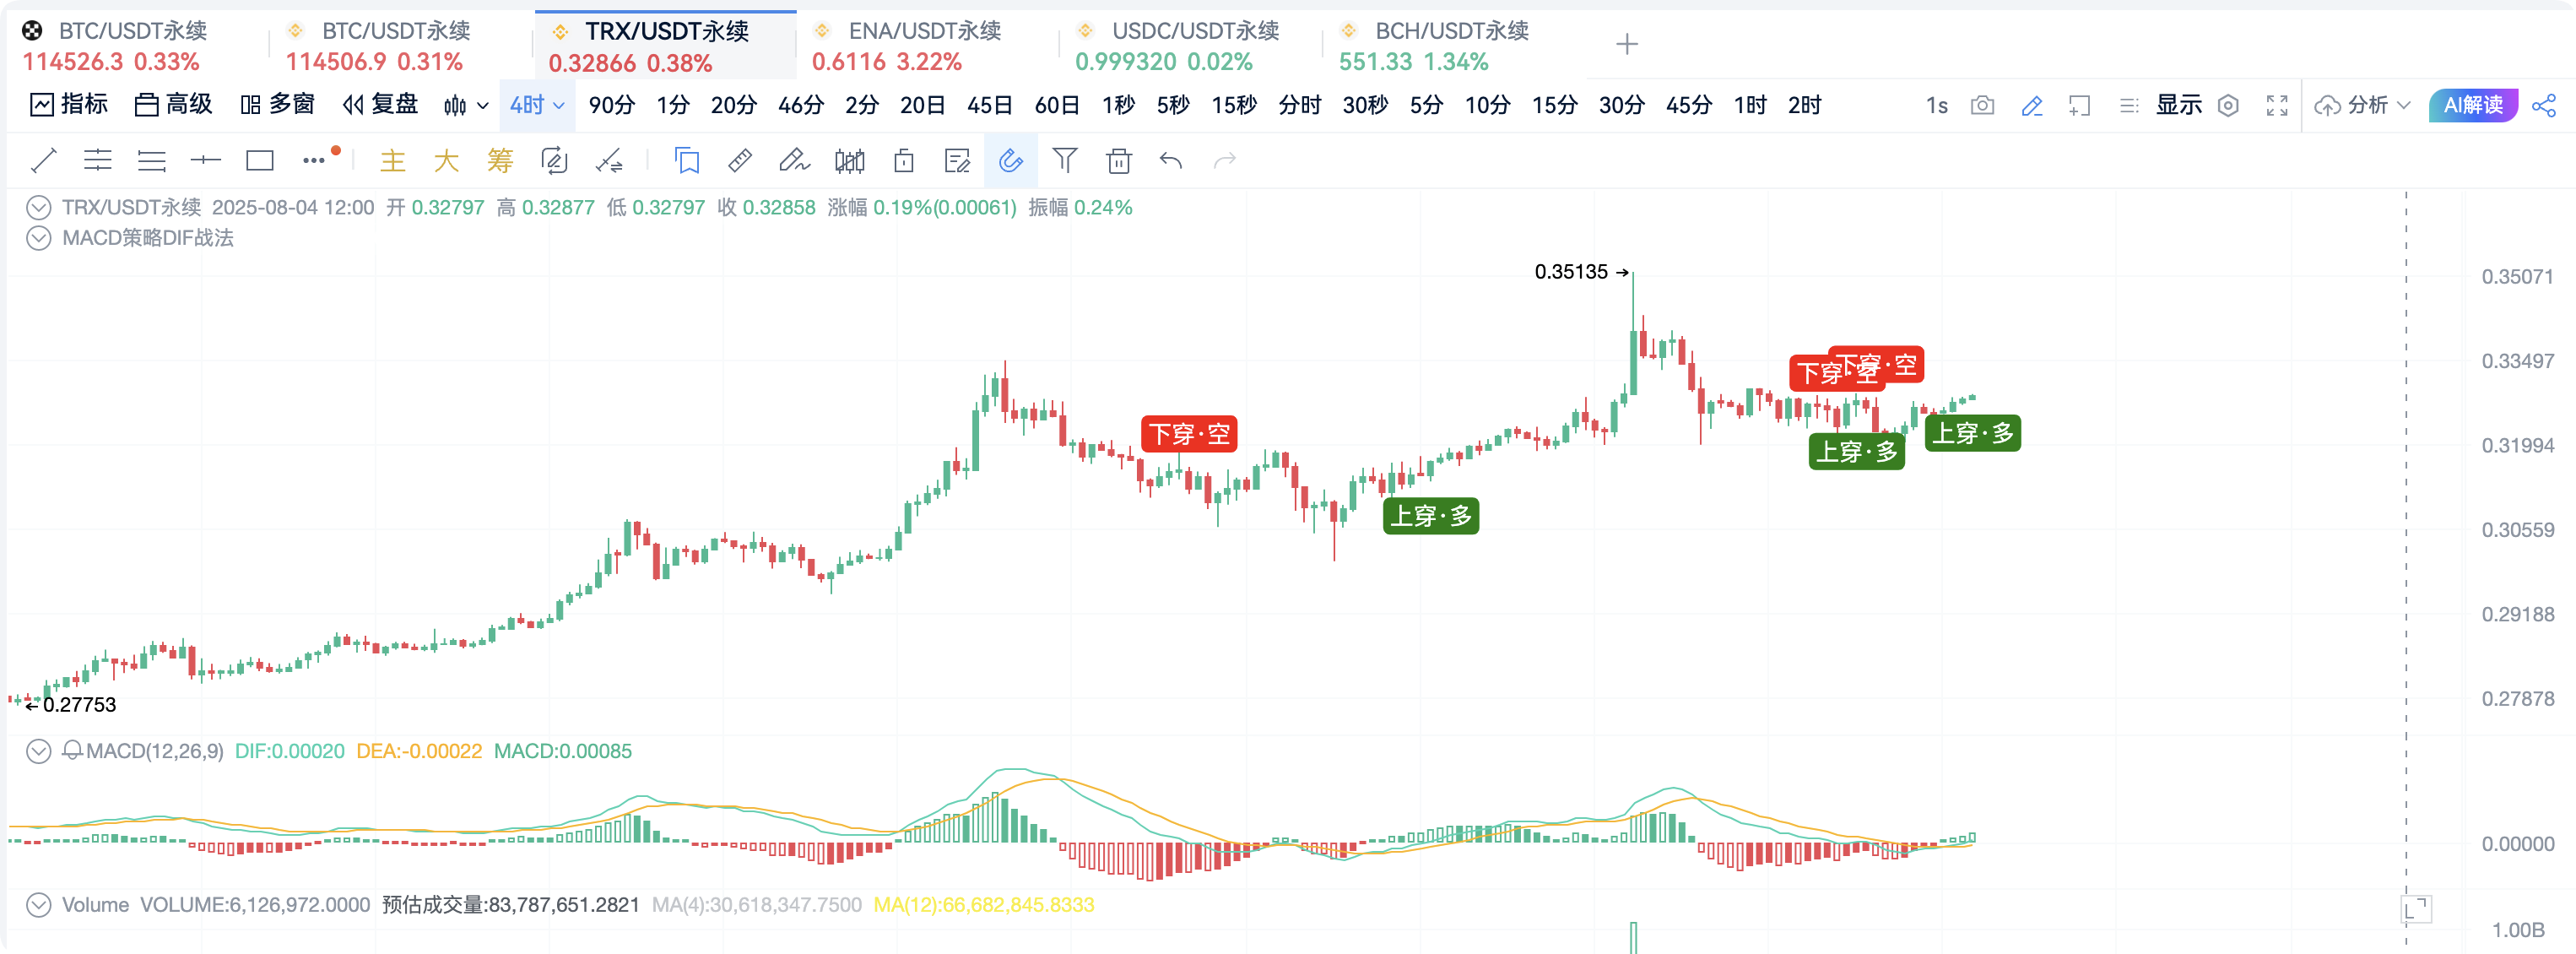
(TRX: Formed a "Cross Above · Long" signal in the 4-hour cycle, followed by an upward trend)
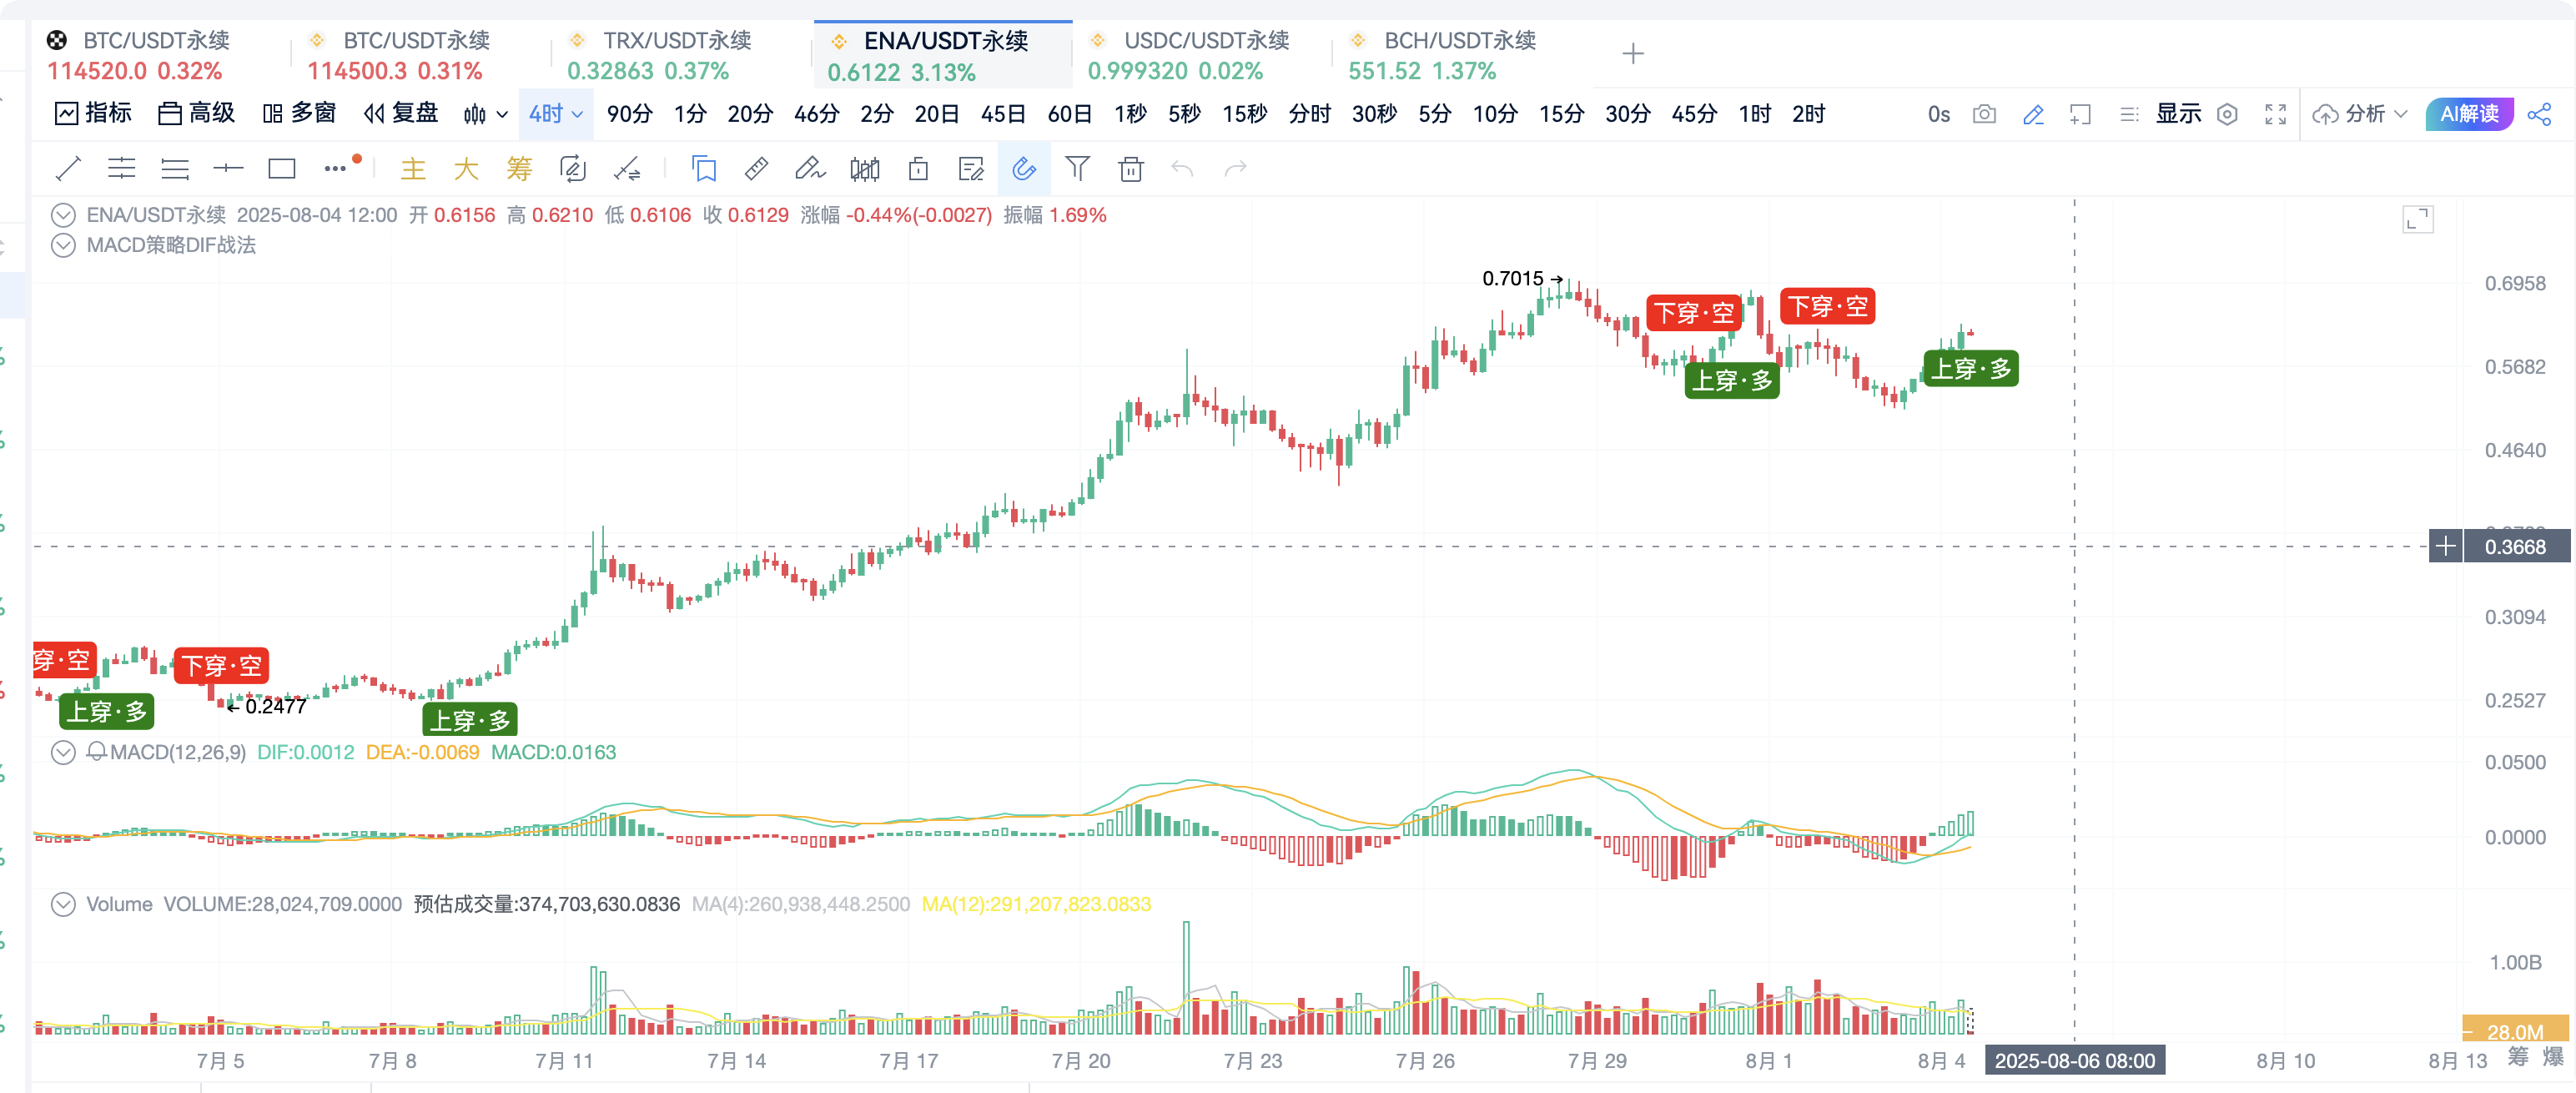
(ENA: Formed a "Cross Above · Long" signal in the 4-hour cycle, followed by an upward trend)
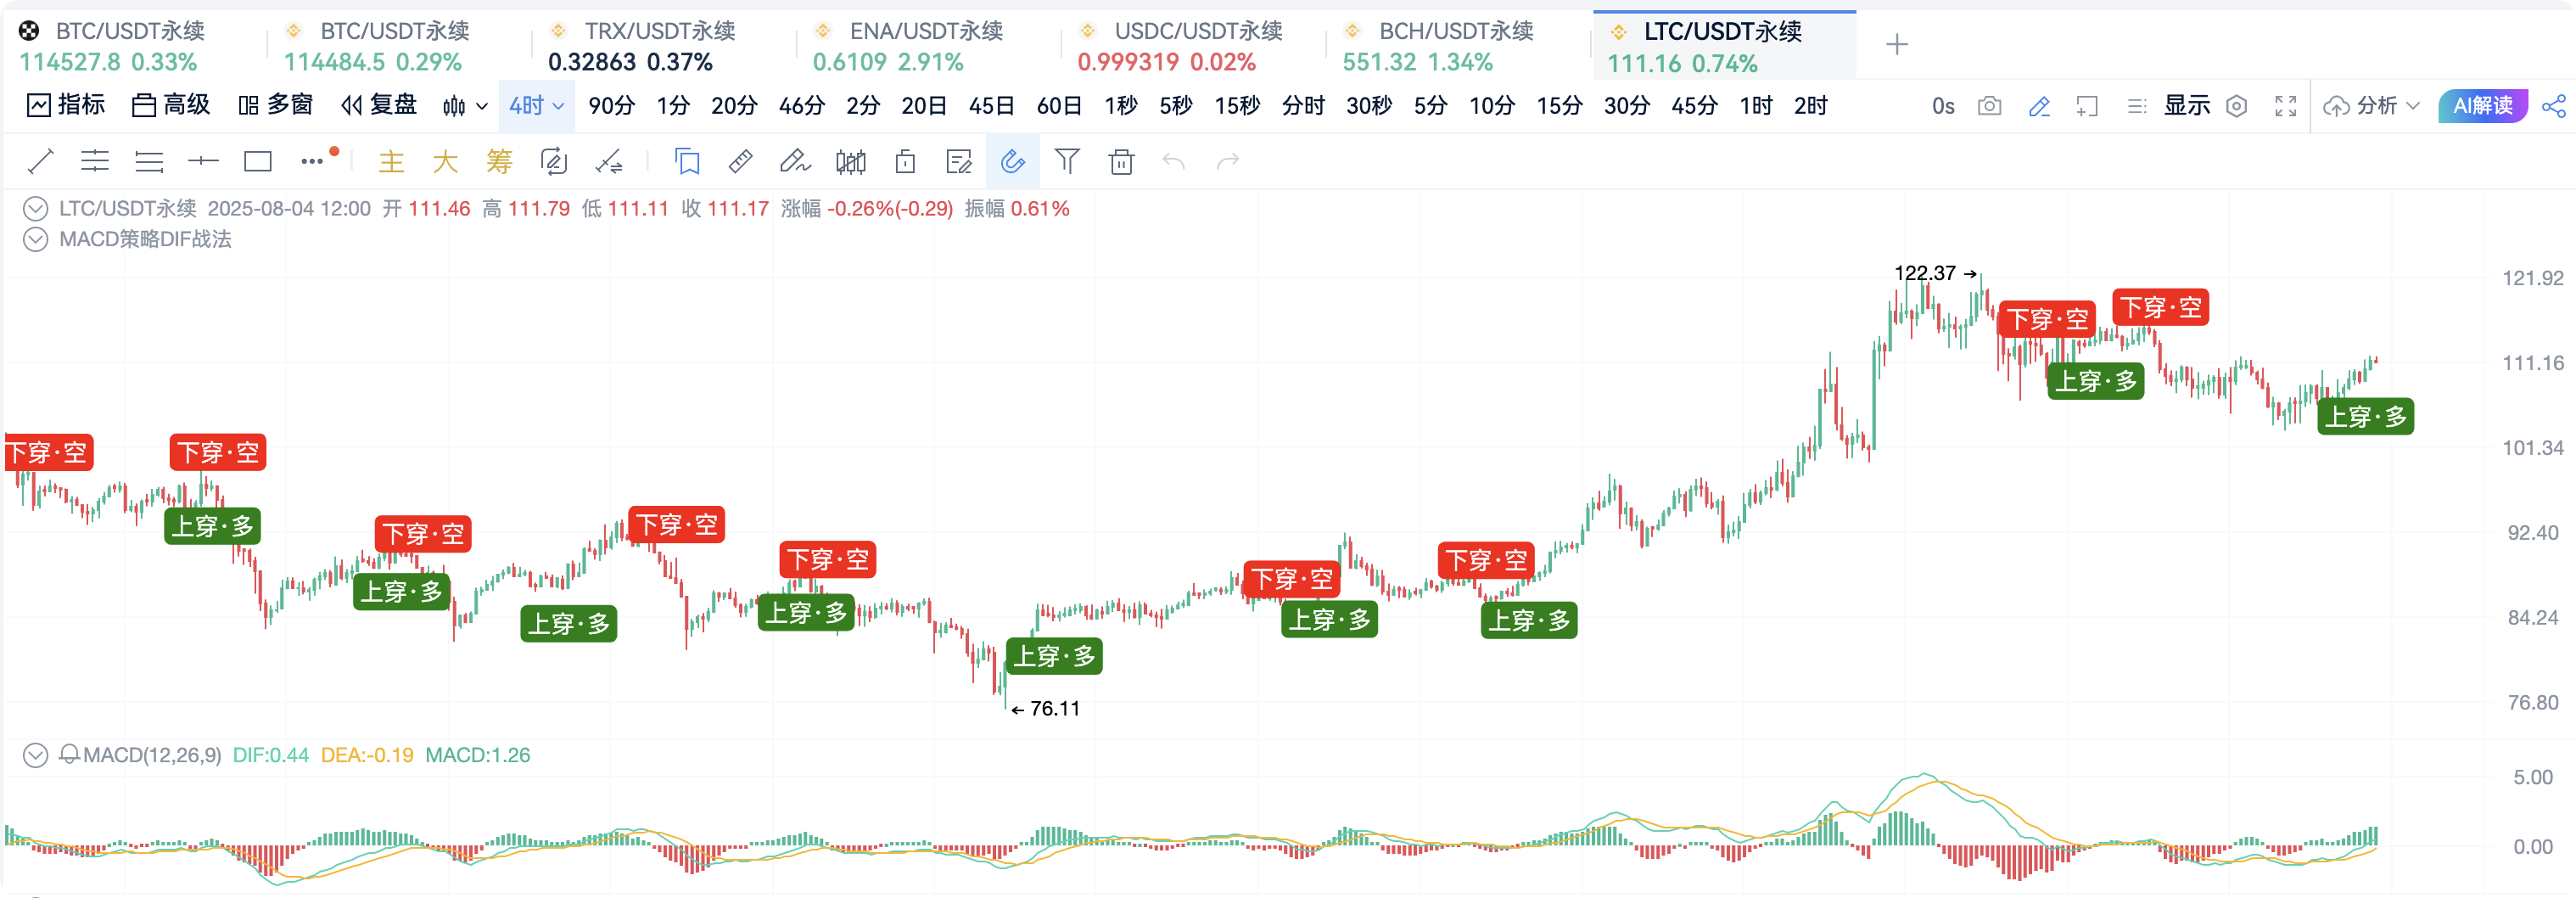
(LTC: Formed a "Cross Above · Long" signal in the 4-hour cycle, followed by an upward trend)
V. Indicator Source Code
// @version=2
// Calculate MACD indicator (dif, dea, macd), parameters are (12,26,9)
[dif, dea, macd] = macd(close, 12, 26, 9, 'EMA', 'EMA');
// Define the condition for DIF crossing above the zero axis: dif changes from negative to positive
dif_cross_above_zero = crossup(dif, 0);
// Define the condition for DIF crossing below the zero axis: dif changes from positive to negative
dif_cross_below_zero = crossdown(dif, 0);
long_entry = dif_cross_above_zero
shortentry = difcrossbelowzero
// Trading Logic
exitLongPercent(short_entry, id = 'Close Long', price='market', percent=100)
exitShortPercent(long_entry, id = 'Close Short', price='market', percent=100)
enterLongAmount(long_entry, price="market", amount=1, id='Long');
enterShortAmount(short_entry, price="market", amount=1, id='Short');
// Plotting Logic
plotText(long_entry, title='Cross Above · Long', text='Cross Above · Long', refSeries=low, bgColor='green', color='white', fontSize=14, placement='bottom', display=true)
plotText(short_entry, title='Cross Below · Short', text='Cross Below · Short', refSeries=high, bgColor='red', color='white', fontSize=14, placement='top', display=true)
// Alert Logic
alertcondition(long_entry, title='Long Signal', direction='buy');
alertcondition(short_entry, title='Short Signal', direction='sell');
VI. Conclusion
MACD is known as the "King of Technical Indicators" because it can eliminate the chaos of raw candlesticks while maintaining the stability of the EMA, effectively addressing the lagging nature of the EMA through difference calculations. MACD combines stability and agility, accurately identifying trend directions and momentum changes, making it suitable for trending markets and providing reliable trading signals in oscillating markets. It is widely regarded as the most comprehensive and practical indicator in technical analysis.
In practice, the DIF zero-axis crossing signal of MACD further enhances its operability, allowing traders to clearly identify entry and exit points and promptly respond to market changes. Bullish signals (DIF crossing above the zero axis) indicate a bullish market, suitable for initiating buying opportunities; while bearish signals (DIF crossing below the zero axis) suggest that the market may enter a retracement or downward phase, providing clear defensive strategies for market participants.
Advanced traders often combine MACD with other indicators to form a multidimensional analytical framework. For example, using RSI (Relative Strength Index) to capture overbought and oversold signals, or combining it with Bollinger Bands to assess the extent of price deviation from the mean, can further optimize trading strategies and enhance accuracy. This collaborative approach of multiple indicators highlights the importance of MACD as a core analytical tool.
In summary, MACD is not merely a trend-following tool; it serves as a deep interpreter of market sentiment, providing traders with a comprehensive perspective from price momentum to trend strength. In the increasingly complex financial markets, MACD, with its unique mathematical logic and wide applicability, is widely regarded as one of the most comprehensive classic indicators in technical analysis. It not only helps traders establish a reliable trading framework but also serves as an important guide for understanding market trends.
免责声明:本文章仅代表作者个人观点,不代表本平台的立场和观点。本文章仅供信息分享,不构成对任何人的任何投资建议。用户与作者之间的任何争议,与本平台无关。如网页中刊载的文章或图片涉及侵权,请提供相关的权利证明和身份证明发送邮件到support@aicoin.com,本平台相关工作人员将会进行核查。


