
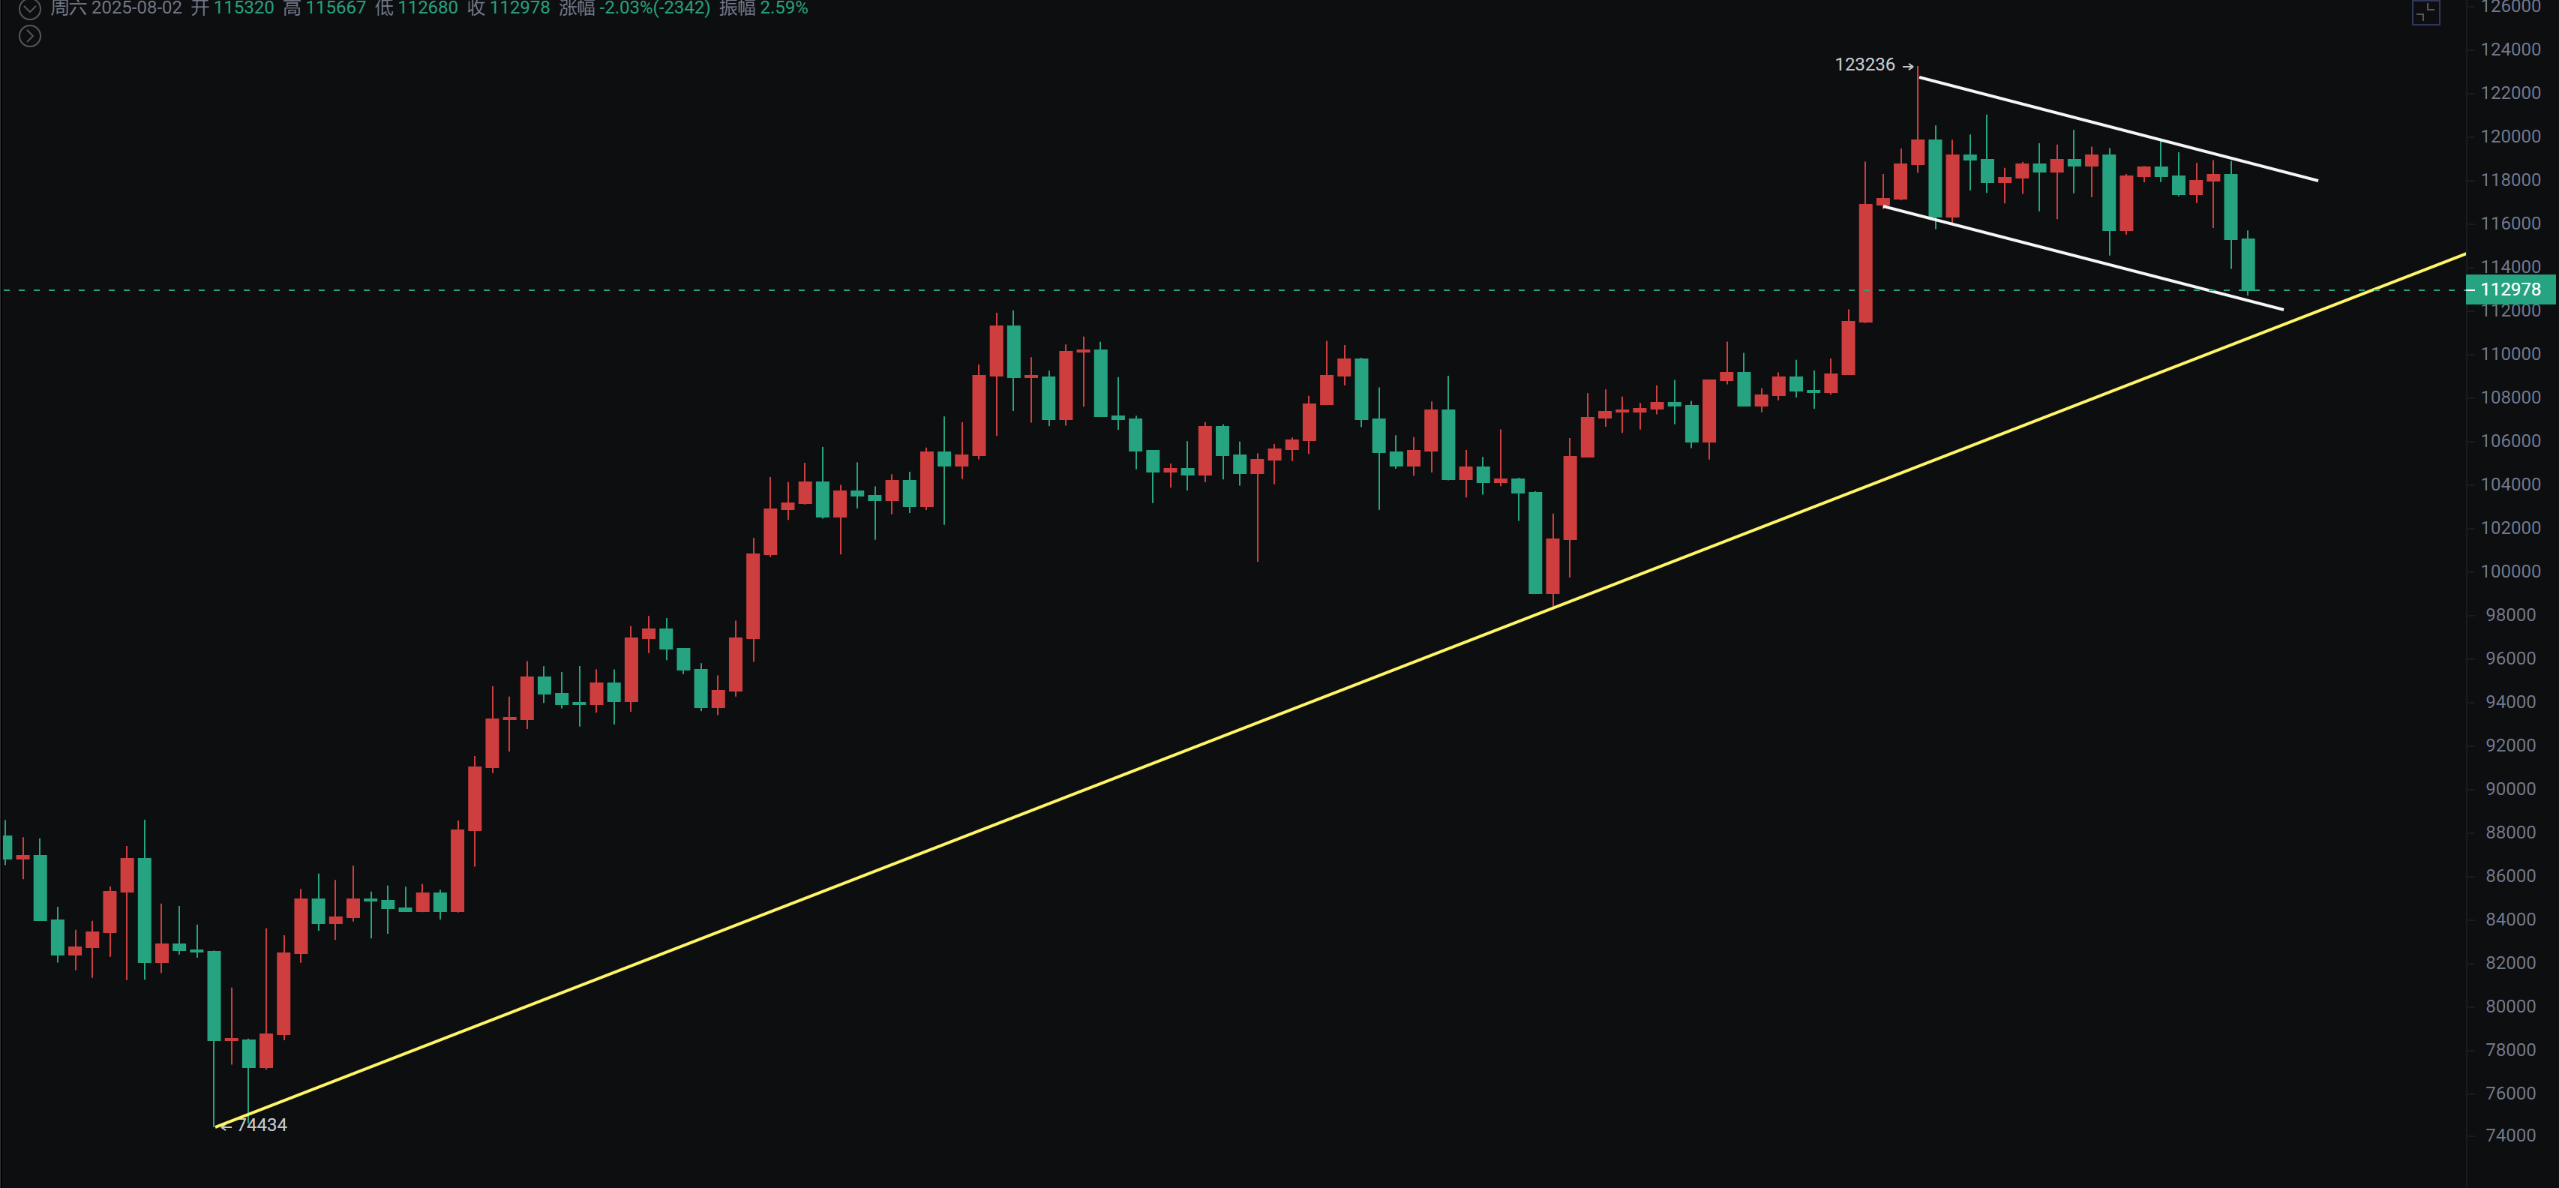
Bitcoin's monthly opening has seen a decline, with the current price dropping below 115,700 and 114,700, hitting a low of 112,660. Currently, the overall rebound strength appears weak, and the daily chart is retesting previous high support. Attention should be paid to the support range of 110,800 to 112,000, which also aligns with the support of the daily upward trend line. The daily Bollinger Bands have elongated the entire adjustment cycle, and we must guard against a true drop below 112,000.
Affected by the falsified non-farm payroll data, U.S. stocks experienced a sharp decline after nearly three months of continuous growth, breaking historical highs. The current pullback is temporarily viewed as a test of previous high support, and it is crucial that this support does not break again. The previous high support is critical in determining whether the bat pattern at 1.13 will form a reversal.
Bitcoin
Bitcoin has seen two consecutive days of decline, with over 800 million flowing out of ETFs yesterday, marking the second-largest single-day outflow since the introduction of ETFs. The daily chart shows the MACD zero axis crossover of the fast and slow lines, with an accelerating outflow situation. It has broken below the 20-day platform support, and short-term attention should be on the resistance levels of 114,000 and 116,000.
The daily chart has not broken below the Fibonacci 0.236 support near 111,700. Therefore, the previously mentioned support at 112,000 cannot be broken by a large bearish candle. If it does break, it would indicate a false breakout in a larger cycle.
Support: 110,800—112,000
Resistance: 114,000—116,000
Ethereum
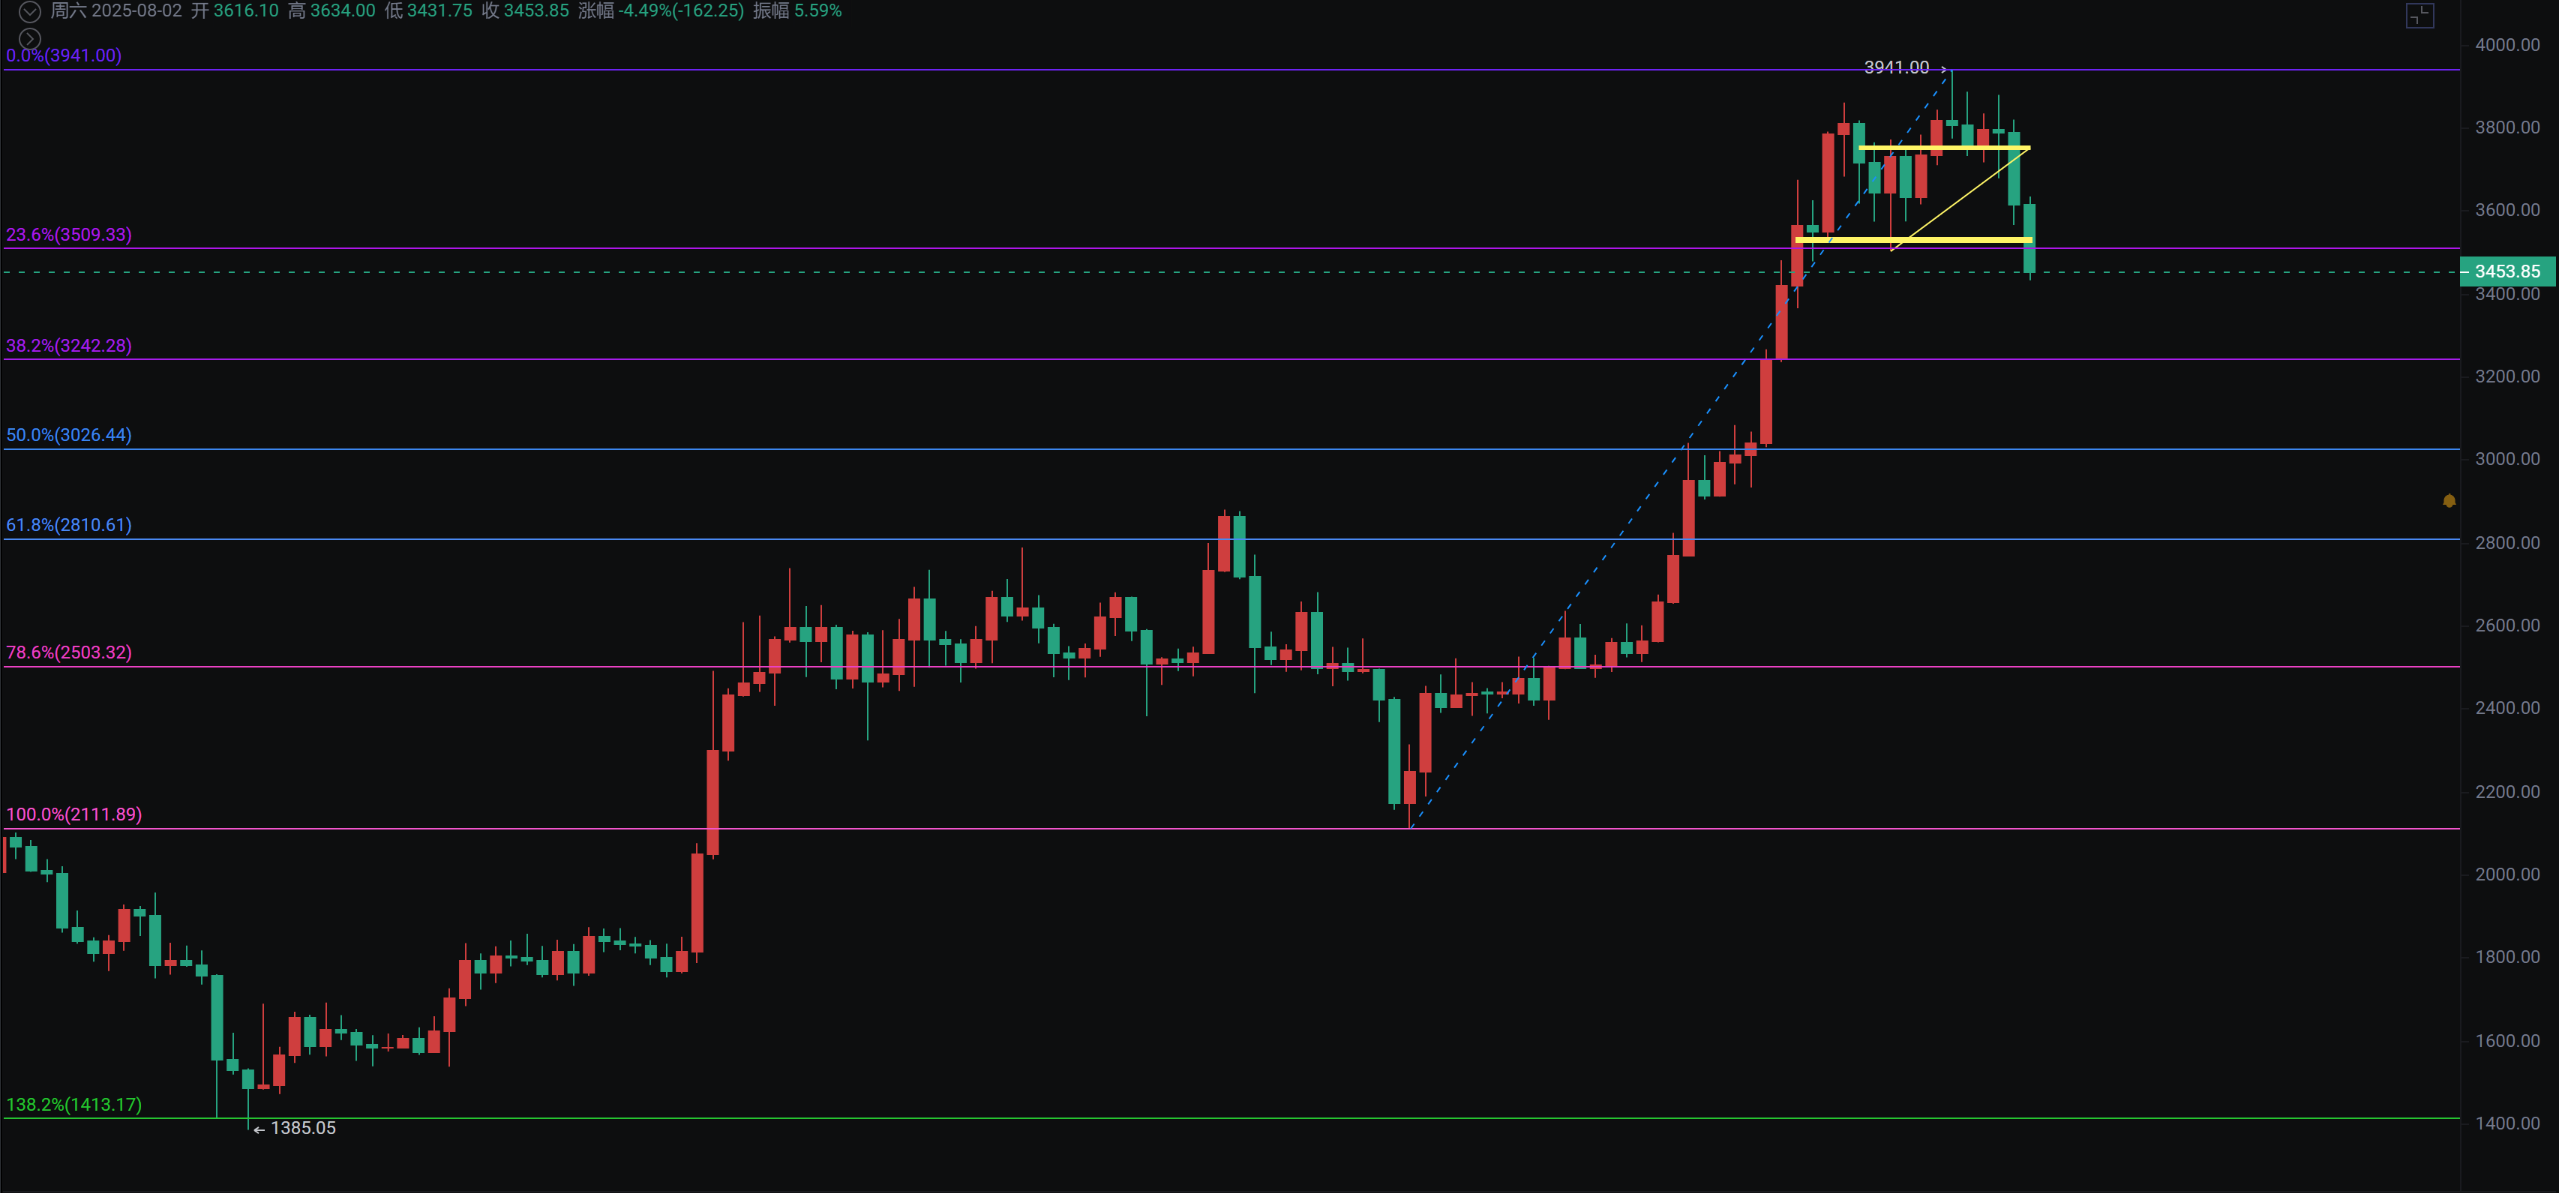
Ethereum has also seen two consecutive days of decline, dropping nearly ten points. Previously, it was noted that there was an ascending triangle pattern, and two support levels at 3,767 and 3,500 should not be broken. However, it has now reached a low of 3,429.
Both support levels have been broken, and the 20-day moving average has also been breached, with Fibonacci breaking below 0.236. The next support levels are 3,350 and 3,250, and from a larger cycle perspective, it is difficult to break through due to the pressure from the weekly triangle convergence.
Support: 3,050—3,250—3,350
Resistance: 3,535—3,650—3,750
If you like my views, please like, comment, and share. Let's navigate through the bull and bear markets together!!!
The article is time-sensitive and for reference only, with real-time updates.
Focusing on K-line technical research, sharing global investment opportunities. Public account: BTC Trading Prince Fusu

免责声明:本文章仅代表作者个人观点,不代表本平台的立场和观点。本文章仅供信息分享,不构成对任何人的任何投资建议。用户与作者之间的任何争议,与本平台无关。如网页中刊载的文章或图片涉及侵权,请提供相关的权利证明和身份证明发送邮件到support@aicoin.com,本平台相关工作人员将会进行核查。


