Original Title: "Stablecoin Project Ethena Strong Growth, Fed's Hawkish Stance Triggers Market Caution | Frontier Lab Crypto Market Weekly Report"
Original Source: Frontier Lab
Market Overview
Market Situation
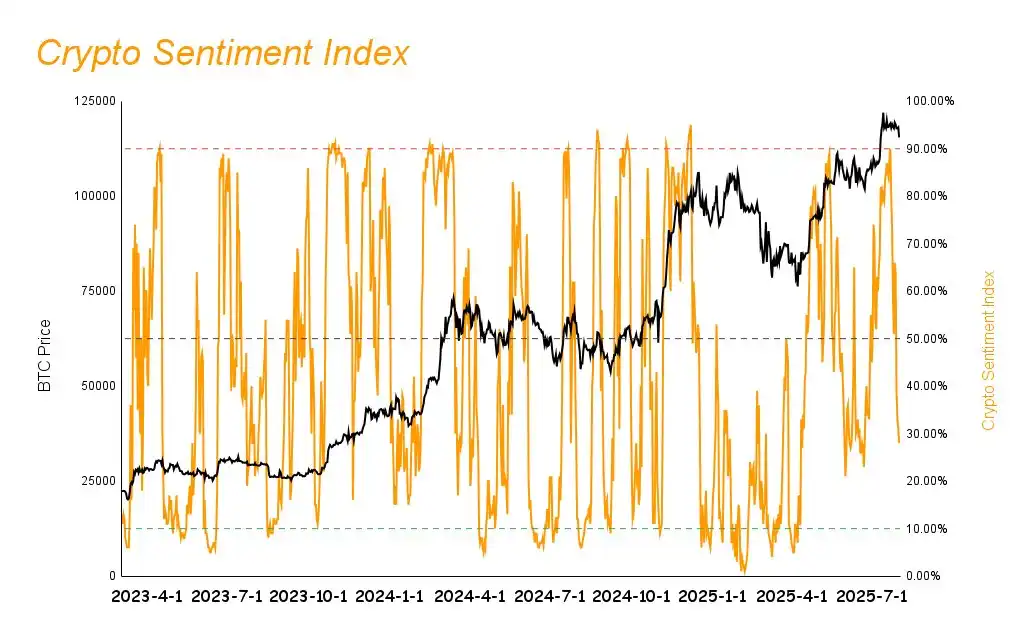
This week, the cryptocurrency market showed a downward trend. BTC experienced a decline, while ETH showed relative strength with a fluctuating upward trend. Most altcoins followed BTC's downward trend. The market sentiment index dropped significantly from last week's 59% to 27.81%, entering a bearish zone overall.
Stablecoin Market Dynamics
The total market capitalization of stablecoins continued to grow, but the growth rate has significantly weakened, showing a trend of USDT growth and USDC decline:
· USDT: Market capitalization reached $163.8 billion, with a week-on-week growth of 0.74%, continuing to maintain a high-speed upward trend. Although the weekly inflow of funds decreased compared to last week, it still remained above $1 billion, indicating a decline in the intensity of capital inflow this week.
· USDC: Market capitalization was $64 billion, with a week-on-week decline of 1.68%, ending a three-week upward trend and beginning to show a significant downward trend, with a decline of $1.1 billion.
This phenomenon is worth investors' attention: the continuous weekly growth of over $1 billion in USDT over the past five weeks indicates that institutional funds, primarily from non-U.S. users, are still increasing their entry; while the significant decline in USDC reflects that U.S. investors have ended their recent FOMO sentiment and are taking risk-averse actions due to recent unfavorable macro data. This signal needs to be continuously monitored.
Market Driving Factors Analysis
· Strong Economic Data Impact: Wednesday's ADP employment numbers and GDP data exceeded expectations, showing that the U.S. economy remains strong, which is unfavorable for the Fed's interest rate cut decisions.
· Fed's Hawkish Stance: Powell's hawkish remarks after the interest rate meeting led to a drop in market expectations for a rate cut in September to 50%, with expectations for an October rate cut abandoned.
· Persistent Inflation: The core PCE price index for June remained at 2.58%, higher than the expected 2.7%, showing no signs of decline, further affecting rate cut expectations.
· Earnings Reports Below Expectations: Coinbase's Q2 earnings report released after Thursday's market close did not meet market expectations, leading to a decline in the crypto market.
· Institutional Demand Support: ETH whales and listed companies continue to purchase ETH, stabilizing market prices and sentiment to some extent.
International Trade and Political Factors
· Easing Trade Relations: The U.S. and China reached a decision to continue delaying tariffs for 90 days, and a tariff agreement was reached with the EU, positively impacting market sentiment.
Key Events Prediction for Next Week
· Lack of Macro Data: There will be no important macro data released next week, and the market focus will shift to institutional purchasing strength.
· Institutional Purchasing Strength: Continuous attention is needed on the purchasing situation of BTC and ETH by listed companies and ETFs; a decrease in purchasing strength may lead to market corrections.
Investment Strategy Recommendations
· Maintain Caution: In the current market environment, investors should remain cautious.
· Guard Against "Black Swans": Be prepared to respond to potential risk events.
· Monitor Institutional Movements: Closely track large institutions' purchasing behavior of BTC and ETH as an important indicator of market direction.
Market Outlook
In the context of the Fed's hawkish stance and persistent inflation, the crypto market may continue to maintain a fluctuating trend in the short term. The Fed's cautious attitude towards the interest rate cut timetable will be a core factor influencing the market in the coming months, especially as the probability of a September rate cut has dropped from certainty to 50%, which has significantly suppressed market risk appetite. However, Coinbase's earnings report dealt a severe blow to the market. The flow of institutional funds will become a key support for market stability. Currently, the continuous purchasing behavior of ETH whales and listed companies provides some buffer for the market, but if this trend weakens, it may trigger a larger-scale correction. Particularly, with the technical indicators already showing a demand for adjustment, a decrease in institutional buying may accelerate downward pressure.
The easing of international trade relations is one of the few positive factors currently. The delay of U.S.-China trade tariffs and progress in U.S.-EU tariff agreements help improve the global economic outlook, indirectly supporting risk assets. However, whether this positive factor can offset the negative impact of the Fed's hawkish stance remains to be seen.
Overall, the market may enter a consolidation period, waiting for clearer monetary policy signals. Investors should be prepared for medium- to long-term holdings while maintaining sufficient liquidity to cope with potential volatility. In the absence of significant catalysts, the market may need more time to digest previous gains and build momentum for the next phase of the market.
Next Week's Prediction Targets
Bearish Targets: ATA, MOVE
ATA: Privacy Track Marginalized Project Faces Dual Challenges of Unlocking Selling Pressure and Fundamentals
· Project Fundamentals and Positioning
Automata Network is a decentralized platform focused on providing privacy protection and cross-chain integration in the blockchain and Web3 space. Through its decentralized middleware protocol, it provides infrastructure for building Web3 applications, particularly emphasizing privacy and security. It aims to address key issues such as privacy, security, and interoperability in blockchain.
· Industry Ecology and Market Position Continues to Weaken
Marginalization of Privacy Track Market Positioning: The privacy track that Automata Network is in is a niche area in the crypto market, long positioned at the market's edge, failing to gain mainstream market attention and capital injection.
· Insufficient Ecological Integration: Although privacy technology has its application value in the Web3 field, Automata Network has failed to effectively integrate with mainstream public chains and DeFi ecosystems, limiting its application scenarios and user base.
· Fundamental Data Severely Deteriorating
On-chain activity is nearly stagnant: On-chain data shows that the number of on-chain attestations generated by the Automata Network project is only 20 per day, a core indicator that directly reflects platform usage, indicating that there are almost no active users on-chain.
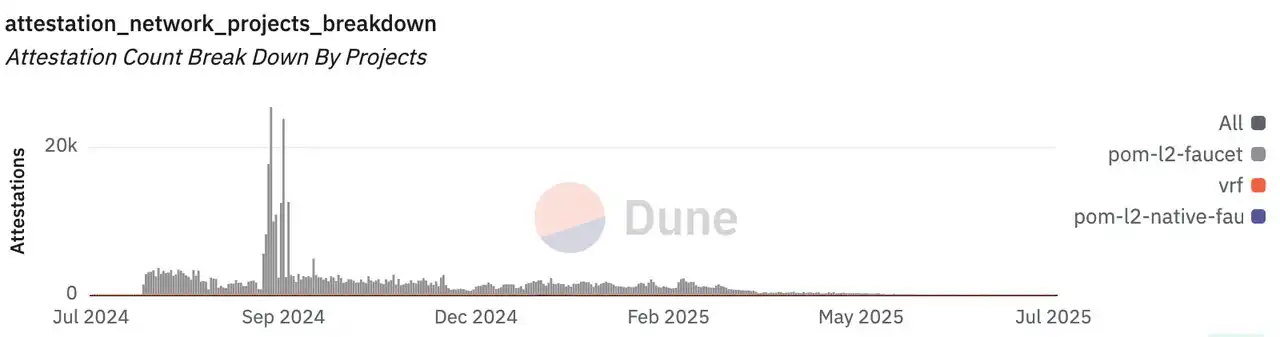
Number of on-chain attestations generated by Automata Network (Data Source: https://dune.com/automata_network/attestation-dashboard)
· Capital Inflow Extremely Shrinking: On-chain ETH deposit data shows that Automata Network has less than 1 ETH of daily deposit inflow, reflecting that investor confidence in the project has dropped to a freezing point.
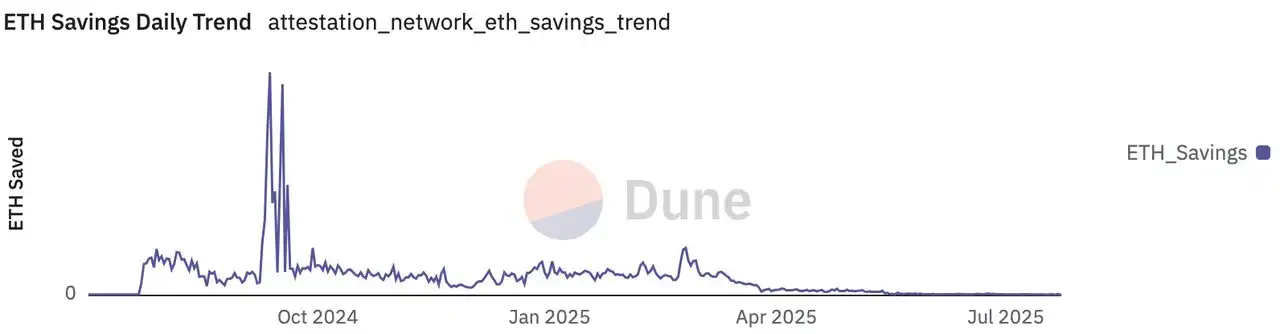
Daily deposit numbers for Automata Network (Data Source: https://dune.com/automata_network/attestation-dashboard)
· Low Usage Rate of Cross-Chain Applications: Among all supported chains, Automata Network's cross-chain integration function has only 68 transactions per day, indicating that the project's actual application value and user base have nearly disappeared within the entire crypto ecosystem.
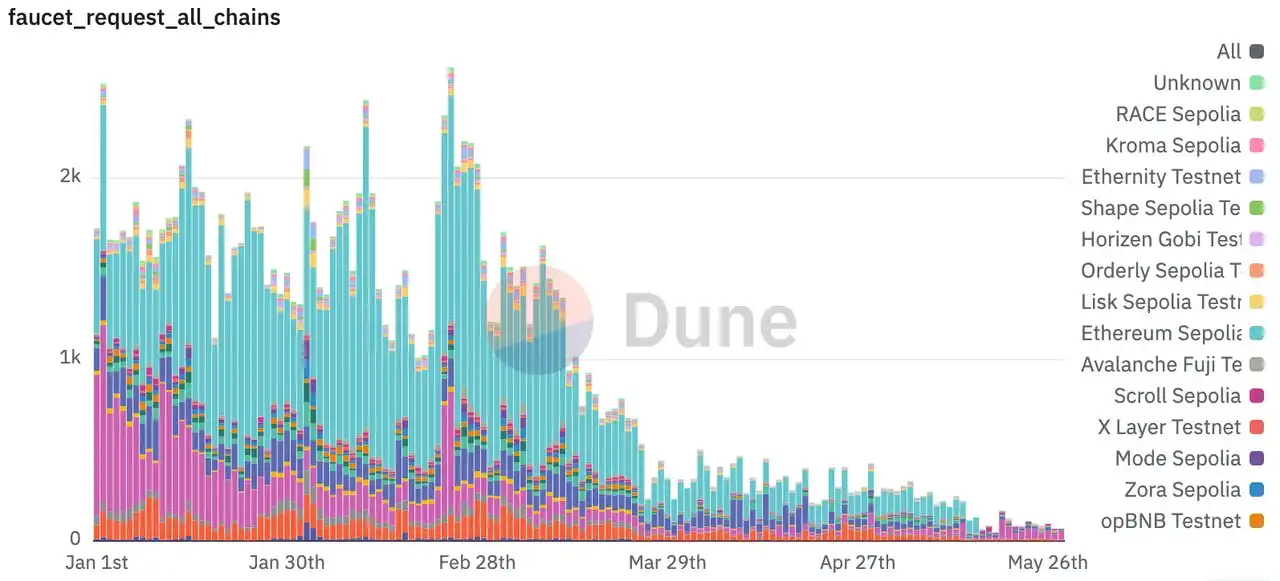
Daily cross-chain data for Automata Network (Data Source: https://dune.com/automata_network/attestation-dashboard)
· Token Unlocking Risk Assessment
- Unfavorable Scale and Timing of Unlocking: On August 6, 25.22 million ATA tokens will be unlocked, accounting for 2.52% of the total locked amount, at a critical moment when the project's fundamentals continue to deteriorate.
- Severe Insufficient Market Absorption Capacity: The daily trading volume of ATA tokens is only about $700,000, and the market liquidity is clearly insufficient to effectively absorb the upcoming unlocked token volume, which will create significant selling pressure.
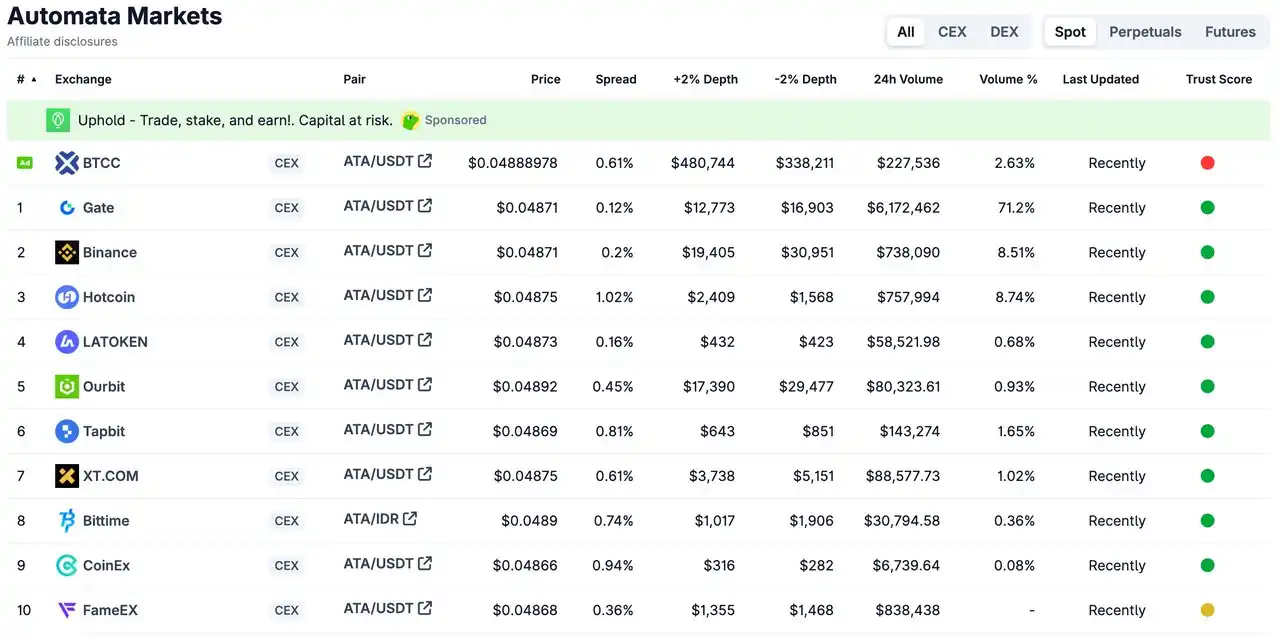
Daily trading volume of ATA tokens (Data Source: https://www.coingecko.com/en/coins/automata)
- Strong Selling Motivation of Unlocking Parties: According to the analysis of the linear unlocking plan, this unlocking mainly involves investment institutions and the project team. Given that the project is currently in a clear downward cycle, these holders have a strong motivation to cash out and are likely to choose to sell and exit.
- Weak Liquidity Depth: Relatively small daily trading volume reflects insufficient market depth, unable to effectively buffer the price impact brought by token unlocking.
Summary
The Automata Network project faces multiple systemic risks: at the market level, the overall attractiveness of the privacy track is limited, and the project has failed to establish a leading position in this niche; at the business level, on-chain activity is nearly stagnant, user activity is extremely low, and capital inflow is minimal; at the capital level, the upcoming unlocking of 25.22 million ATA tokens on August 6 will create significant selling pressure in a market with an average daily trading volume of only $700,000, and the unlocking parties are investment institutions and teams with strong cash-out motivations. The combination of multiple negative factors poses continuous downward pressure on the price of ATA tokens, making it difficult to reverse the downward trend in the short term.
MOVE: Move Language L2 Project Faces Dual Crisis of Fundamental Collapse and Unlocking Selling Pressure
· Project Fundamentals and Positioning
Movement is an Ethereum L2 based on the Move programming language, aiming to bring the security and performance of the Move language to various blockchain ecosystems, including Ethereum. It enhances Ethereum's network by building an L2 solution to improve transaction speed and efficiency while addressing issues such as scalability, interoperability, and security vulnerabilities.
· Deteriorating Market Environment
- Value Proposition of L2 Track Questioned: Over the past year, the L2 track has been criticized by the market, seen as not only failing to bring the expected prosperity to Ethereum but also leading to fragmentation of the Ethereum ecosystem, with Movement, as a project in this track, also negatively affected.
- Overall Lack of Wealth Effect in the Track: L2 ecosystem projects have failed to generate significant wealth effects in recent market cycles, leading to reduced investor interest, and Movement has not gained sufficient market attention and capital injection.
- Unfavorable Market Competition Landscape: In the crowded L2 track, Movement has failed to establish a clear differentiation advantage. Under the pressure from leading L2 projects like Arbitrum and Optimism, its market share continues to shrink, and the momentum for ecological development is insufficient.
· Fundamental Data Severely Deteriorating
- TVL Plummets: Movement's TVL has significantly dropped from a historical high of $166 million to $81.5 million, a decline of 50.91%, clearly reflecting that users are massively withdrawing from the Movement ecosystem.
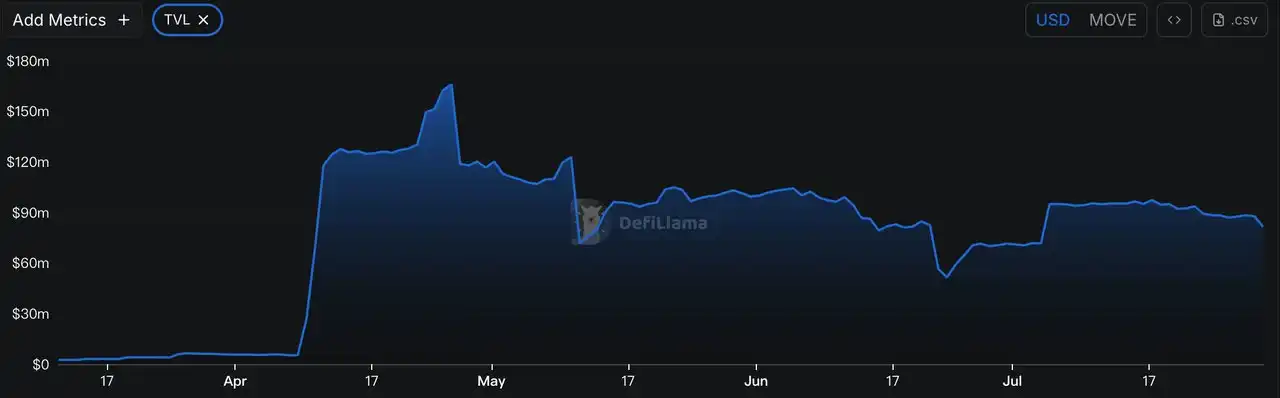
Movement's TVL (Data Source: https://defillama.com/chain/movement?currency=USD&stablecoinsMcap=false&tvl=true&chainFees=false&groupBy=daily&chainRevenue=false&dexsVolume=false&appRevenue=false)
- Continuous Shrinkage of Stablecoin Market Capitalization: The on-chain stablecoin market capitalization has decreased from $34.98 million to $30.8 million in the past month, a drop of 11.95%, indicating that funds are continuously flowing out of the Movement ecosystem, and market confidence is steadily weakening.
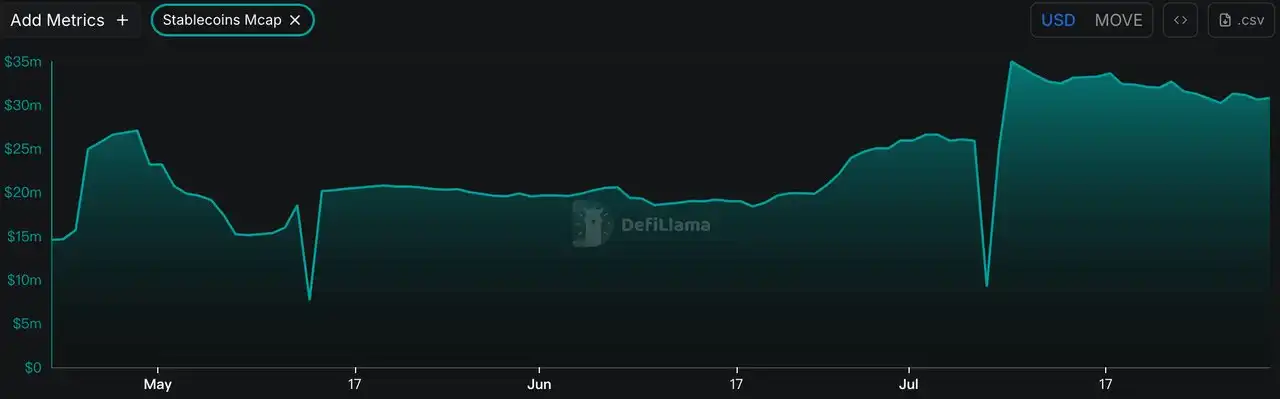
Movement's On-Chain Stablecoin Market Capitalization (Data Source: https://defillama.com/chain/movement?currency=USD&stablecoinsMcap=true&tvl=false&chainFees=false&groupBy=daily&chainRevenue=false&dexsVolume=false&appRevenue=false)
On-Chain Activity Nearly Stagnant: On-chain fee data shows that Movement's daily transaction fees are only between $10-20, at an extremely low level, directly reflecting that there is very little on-chain activity for Movement.
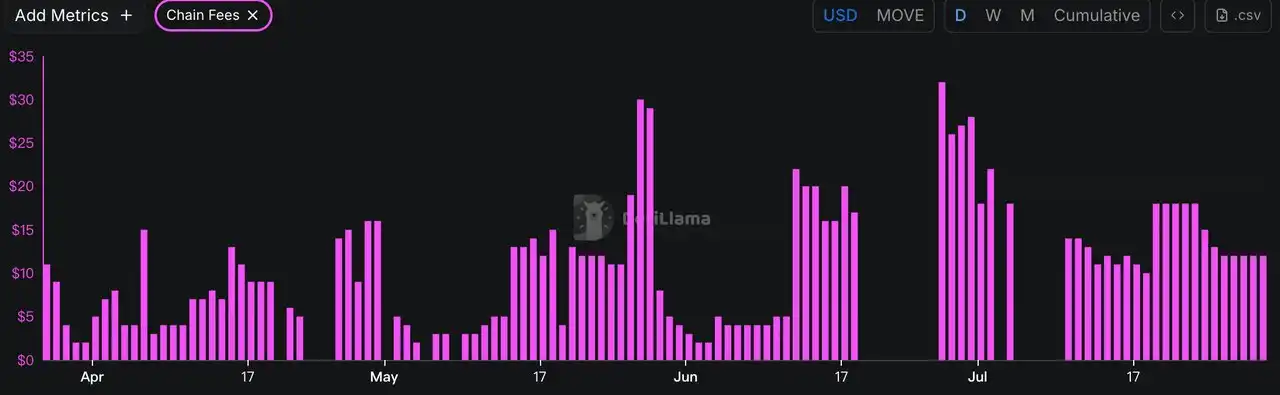
Movement's Daily Fees Revenue (Data Source: https://defillama.com/chain/movement?currency=USD&stablecoinsMcap=true&tvl=false&chainFees=false&groupBy=daily&chainRevenue=false&dexsVolume=false&appRevenue=false)
- Continuous Decline in DEX Trading Volume: On-chain DEX trading volume shows a continuous downward trend, currently only maintaining at $4.66 million/day, indicating that on-chain trading activity is continuously declining.
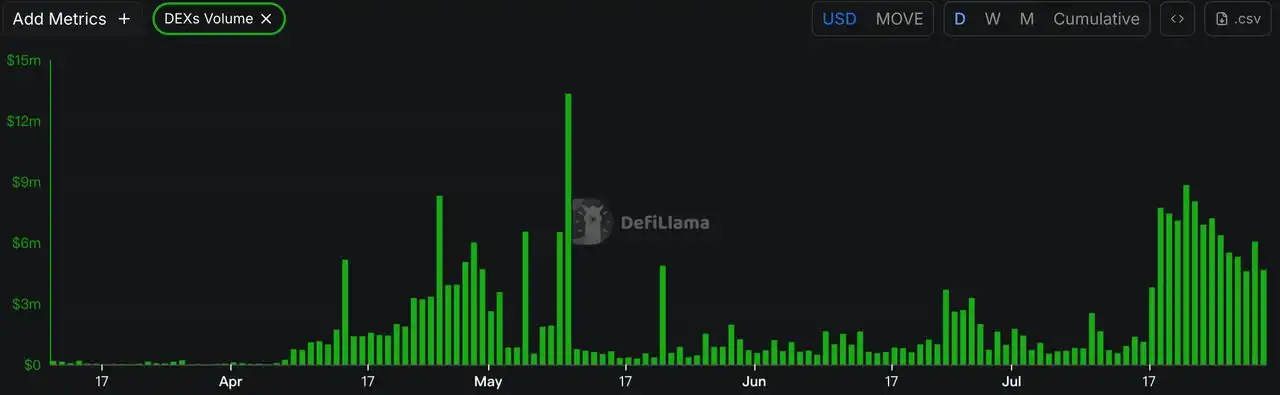
Movement's On-Chain DEX Trading Volume (Data Source: https://defillama.com/chain/movement?currency=USD&stablecoinsMcap=true&tvl=false&chainFees=false&groupBy=daily&chainRevenue=false&dexsVolume=false&appRevenue=false)
- Extremely Low Revenue from Ecological Projects: The total daily revenue of all application projects on the Movement chain is only about $2,000 and continues to decline, indicating that the ecosystem is on the brink of recession.
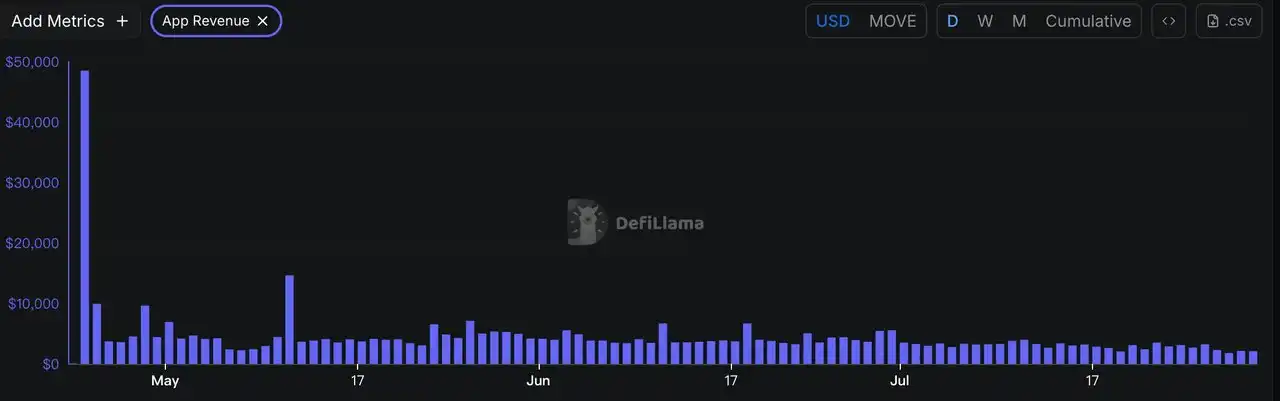
Daily Revenue of All Application Projects on Movement (Data Source: https://defillama.com/chain/movement?currency=USD&stablecoinsMcap=true&tvl=false&chainFees=false&groupBy=daily&chainRevenue=false&dexsVolume=false&appRevenue=false)
- Complete Stagnation of New Users: On-chain data shows that there have been no new users entering Movement recently, indicating that market interest in the project has dropped to freezing point, and user growth has completely stagnated.
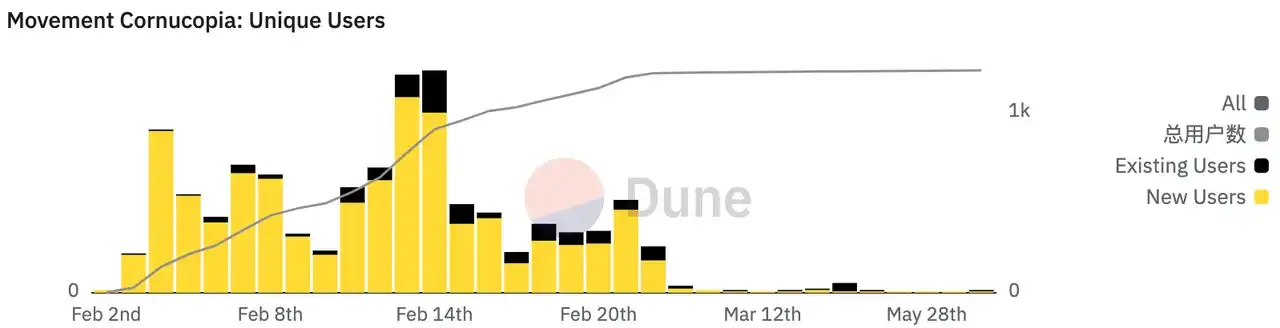
New Users on Movement (Data Source: https://dune.com/ethenelabs/movement-cornucopia)
· Token Unlocking Risk Assessment
- Unfavorable Scale and Timing of Unlocking: On August 8, 50 million MOVE tokens will be unlocked, accounting for 1.5% of the total locked amount, at a critical moment when the project's fundamentals continue to deteriorate.
- Severe Insufficient Market Absorption Capacity: The daily trading volume of MOVE tokens is only about $2.9 million, and the market liquidity is clearly insufficient to effectively absorb the upcoming unlocked token volume, which will create significant selling pressure.
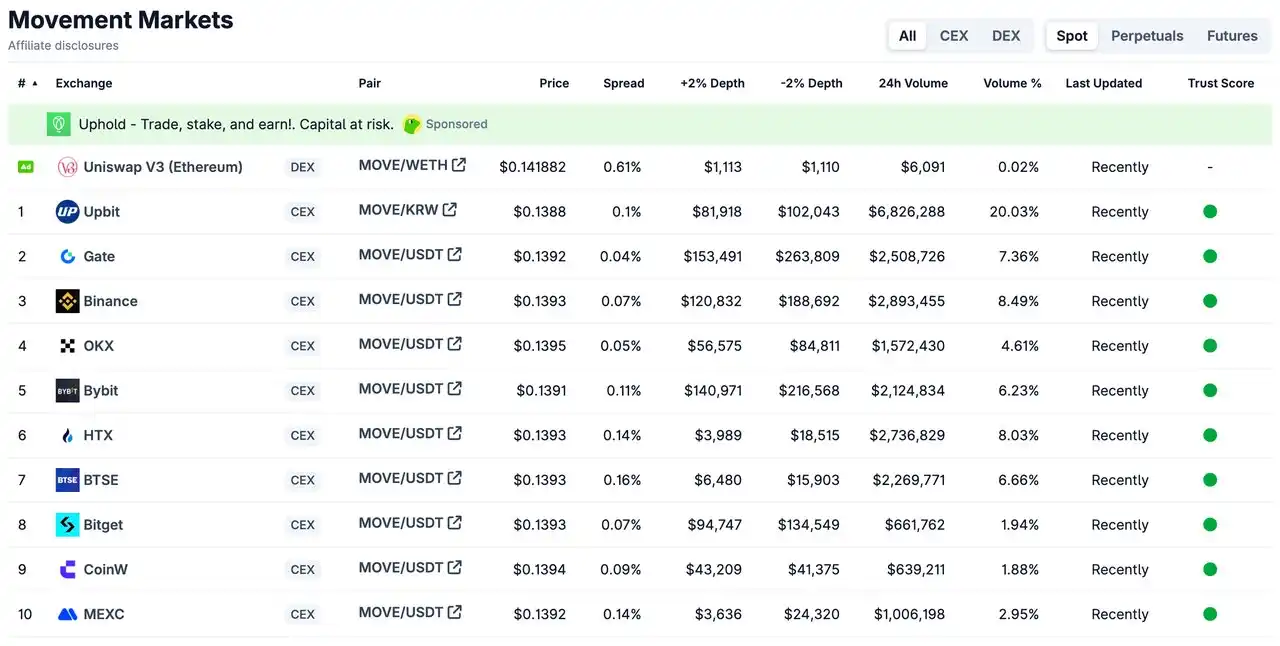
Daily Trading Volume of MOVE Tokens (Data Source: https://www.coingecko.com/en/coins/movement)
· Strong Selling Motivation of Unlocking Parties: According to the analysis of the linear unlocking plan, this unlocking mainly involves investment institutions and the project team. Given that the project is currently in a clear downward cycle, these holders have a strong motivation to cash out and are likely to choose to sell and exit.
· Weak Liquidity Depth: Relatively small daily trading volume reflects insufficient market depth, unable to effectively buffer the price impact brought by token unlocking.
Summary
The Movement project faces multiple systemic risks: at the market level, the overall L2 track is questioned, failing to bring the expected value to Ethereum, and lacking a wealth effect; at the business level, TVL has plummeted by 50.91%, stablecoin market capitalization has shrunk by 11.95%, on-chain fees are only $10-20/day, DEX trading volume continues to decline, ecosystem revenue is only $2,000/day, and new users have completely stagnated; at the capital level, the upcoming unlocking of 50 million MOVE tokens on August 8 will create significant selling pressure in a market with an average daily trading volume of only $2.9 million, and the unlocking parties are investment institutions and teams with strong cash-out motivations. The combination of multiple negative factors poses continuous downward pressure on the price of MOVE tokens, making it difficult to reverse the downward trend in the short term.
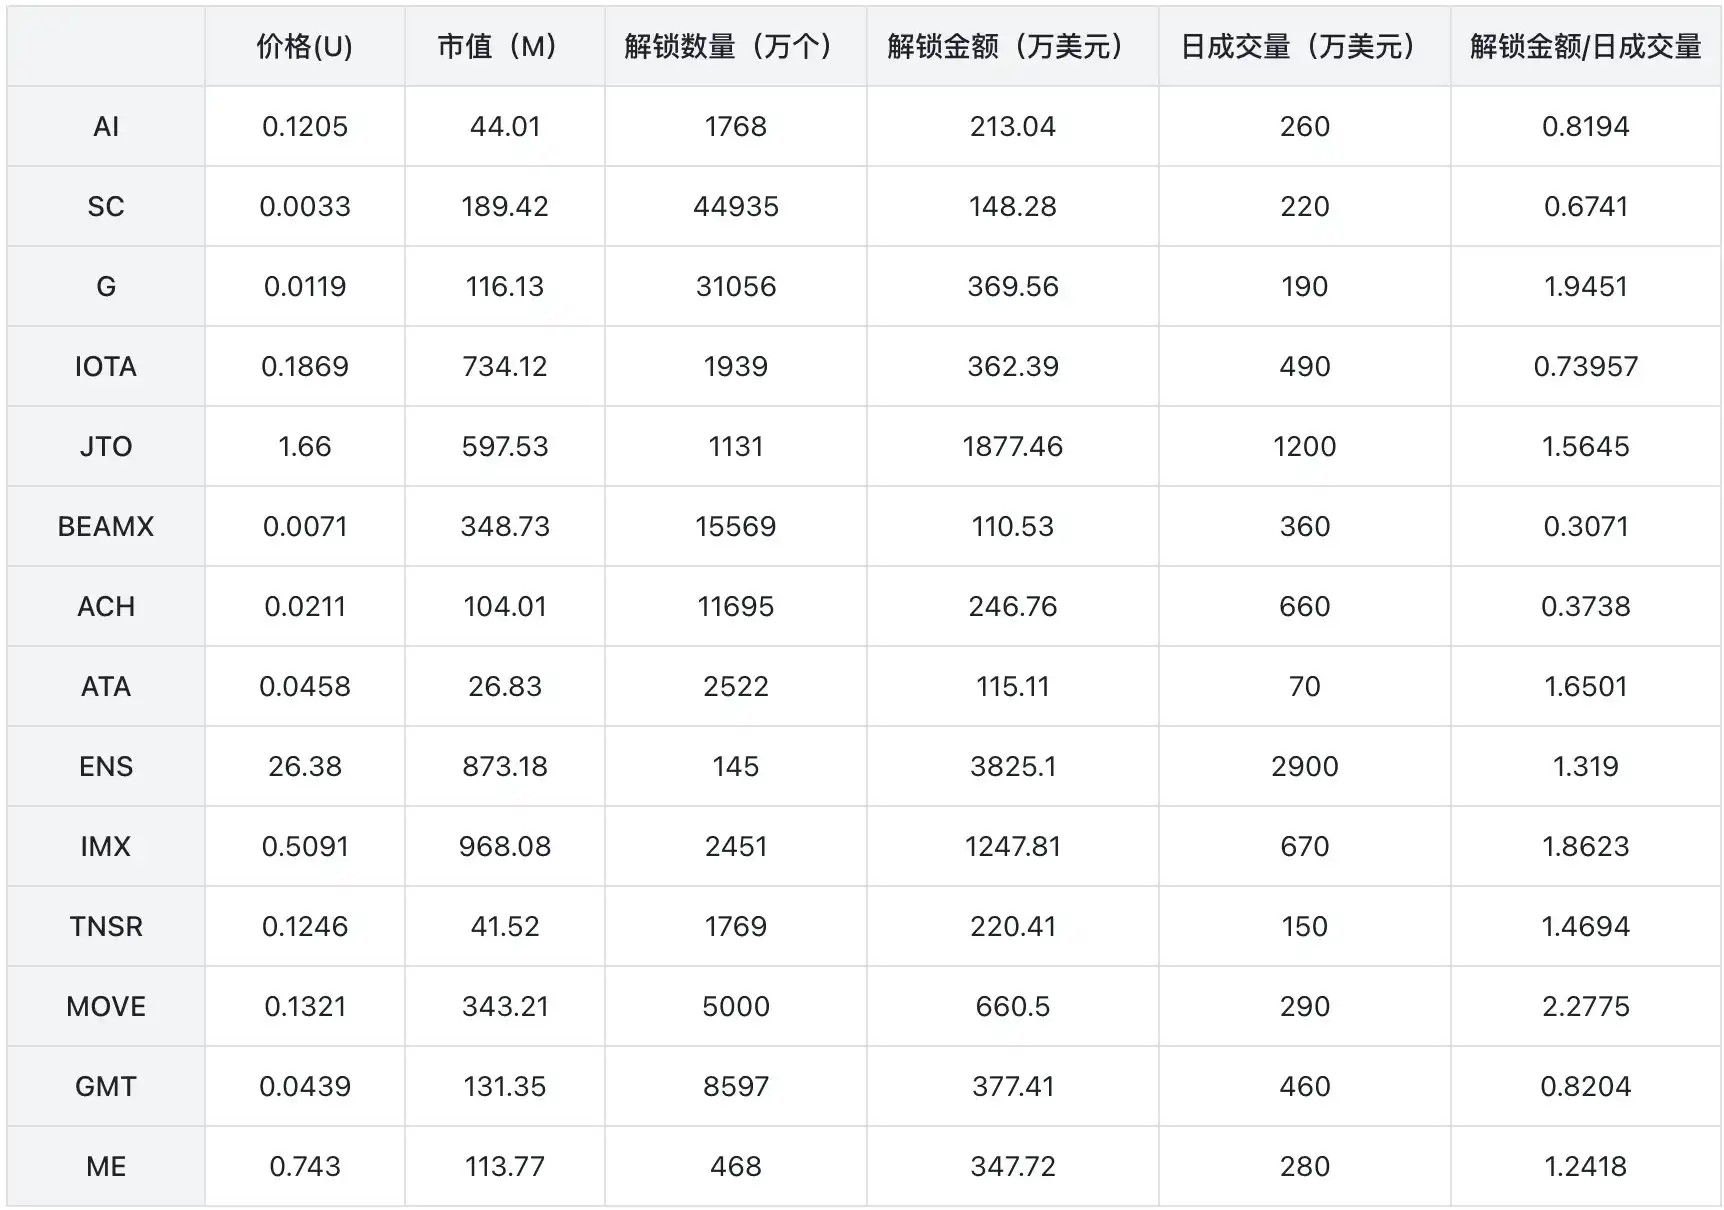
Next Week's Token Unlocking Table (Amounts Over $1 Million)
Market Sentiment Index Analysis
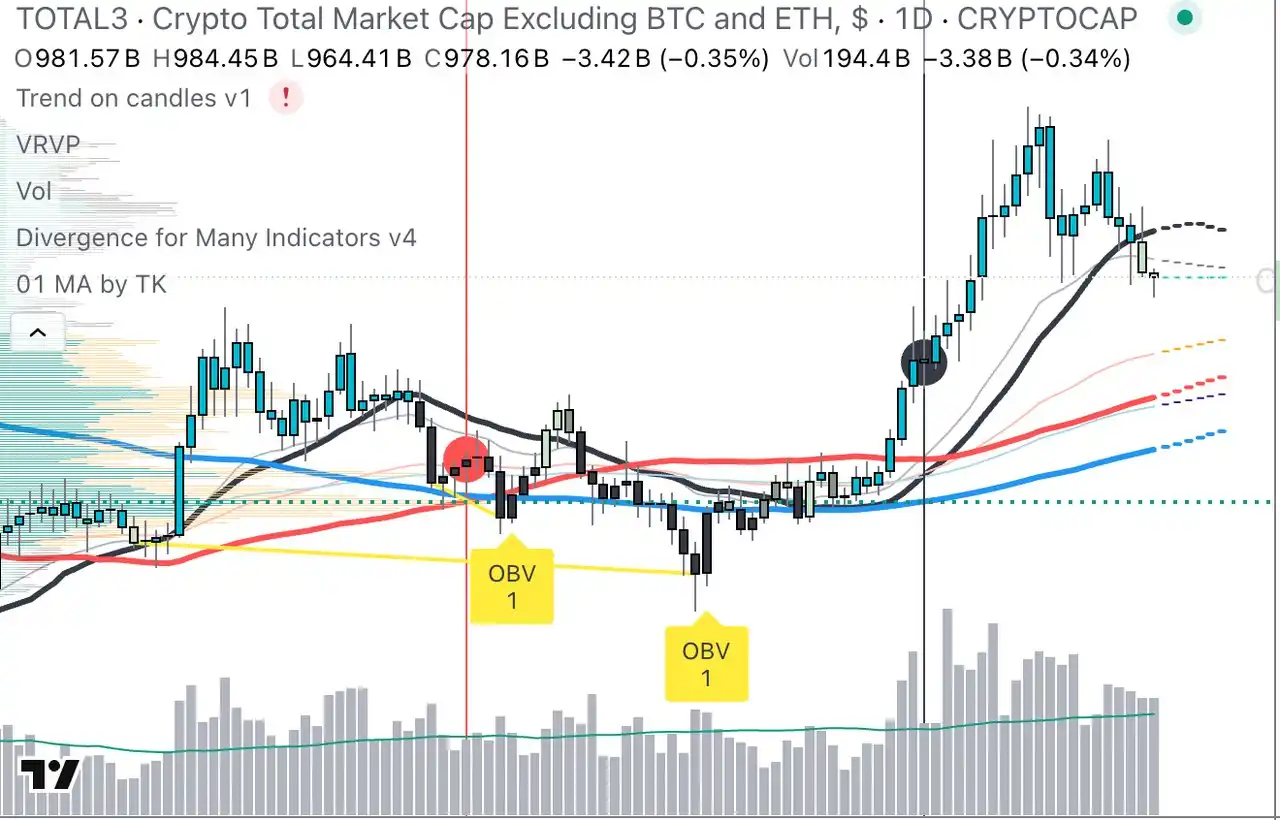
TOTAL3 Data (Data Source: https://www.tradingview.com/chart/xUGZrDd8/?symbol=CRYPTOCAP%3ATOTAL3)
The market sentiment index dropped from 87% to 59%. BTC fell by 2.72% this week, ETH rose by 1.36%, and TOTAL3 fell by 2.21% this week, with altcoins overall entering a bearish zone.
This Week's Hot Projects
Ethena Ecosystem Analysis: USDe Market Share Expansion and Robust Growth in the Stablecoin Sector
Recently, with the passage of the U.S. "GENIUS Act," there has been a surge in discussions about stablecoin projects in the market. Attention has shifted towards stablecoin projects, and while the overall market is in a fluctuating range with most altcoins in a downward trend, Ethena has shown strong growth, performing significantly better than other altcoins and attracting widespread market attention.
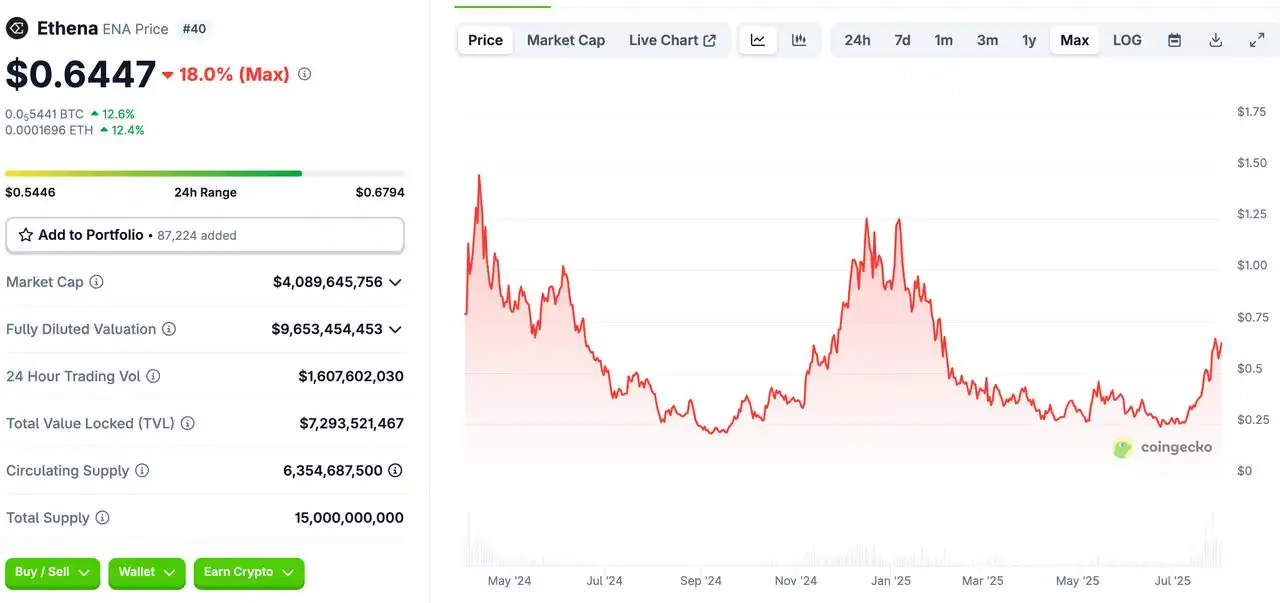
Recent Performance of ENA Tokens (Data Source: https://www.coingecko.com/en/coins/ethena)
On-Chain Data Analysis
TVL
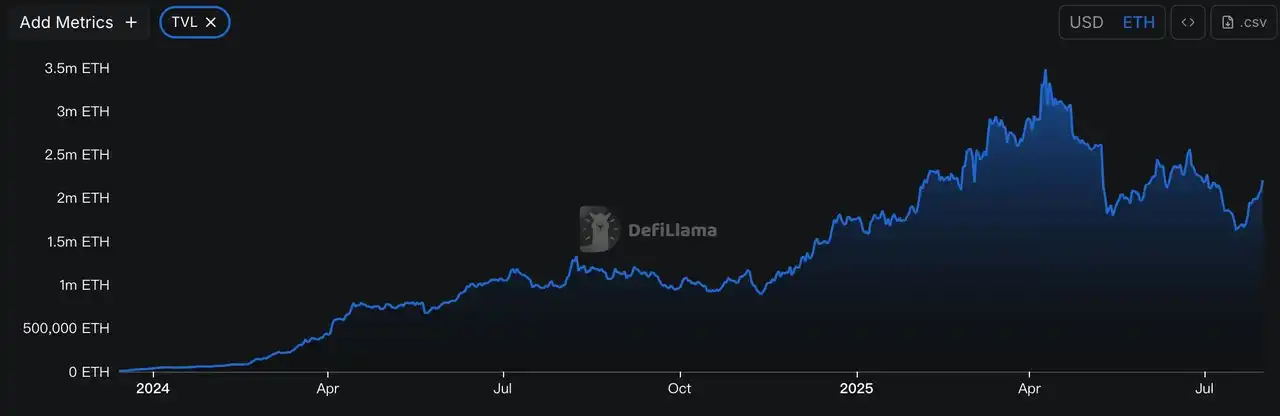
Ethena's TVL (Data Source: https://defillama.com/protocol/ethena?tvl=true)
Due to the recent rapid increase in ETH prices, we use ETH as the unit of measurement. It can be seen that Ethena's TVL has recently experienced a rapid rise, increasing from a short-term low of 1.65 million ETH to 2.19 million ETH, a growth of 30.91%. In dollar terms, it has surpassed $8 billion, reaching a historical high, demonstrating the project's strong appeal.
Fees
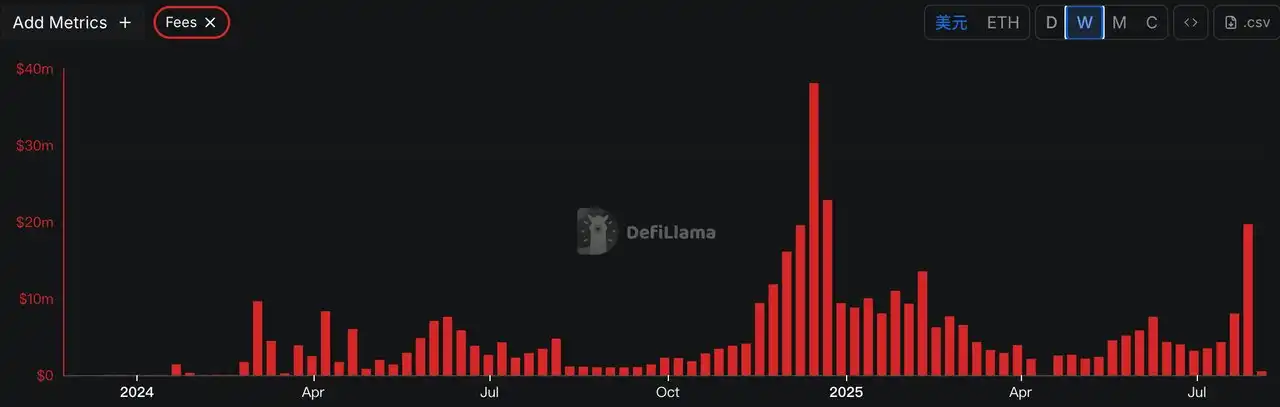
Ethena's Fees (Data Source: https://defillama.com/protocol/ethena?tvl=false&fees=true&groupBy=weekly)
From the above chart, it can be seen that Ethena's Fees have been increasing week by week, especially in recent weeks where the growth has been significant, reaching a recent high of $19.68 million. This data indicates that the user base of Ethena is continuously expanding, and platform activity is steadily increasing.
On-Chain Capital Flow
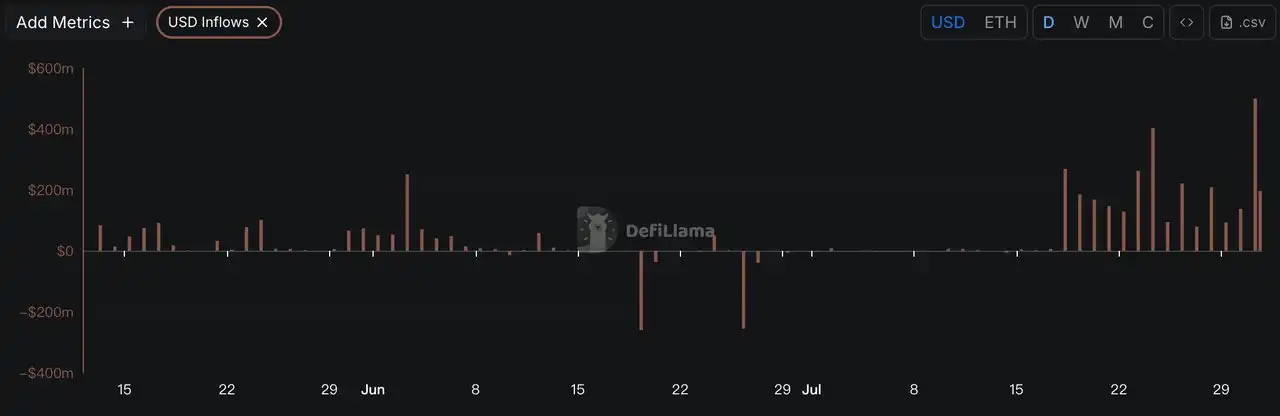
Ethena's On-Chain Capital Flow (Data Source: https://defillama.com/protocol/ethena?tvl=false&usdInflows=true)
From the above chart, it can be observed that Ethena's on-chain capital has recently maintained a large-scale inflow, averaging over $300 million daily, indicating that market confidence in USDe is continuously strengthening, and investors are optimistic about its prospects.
USDe Supply
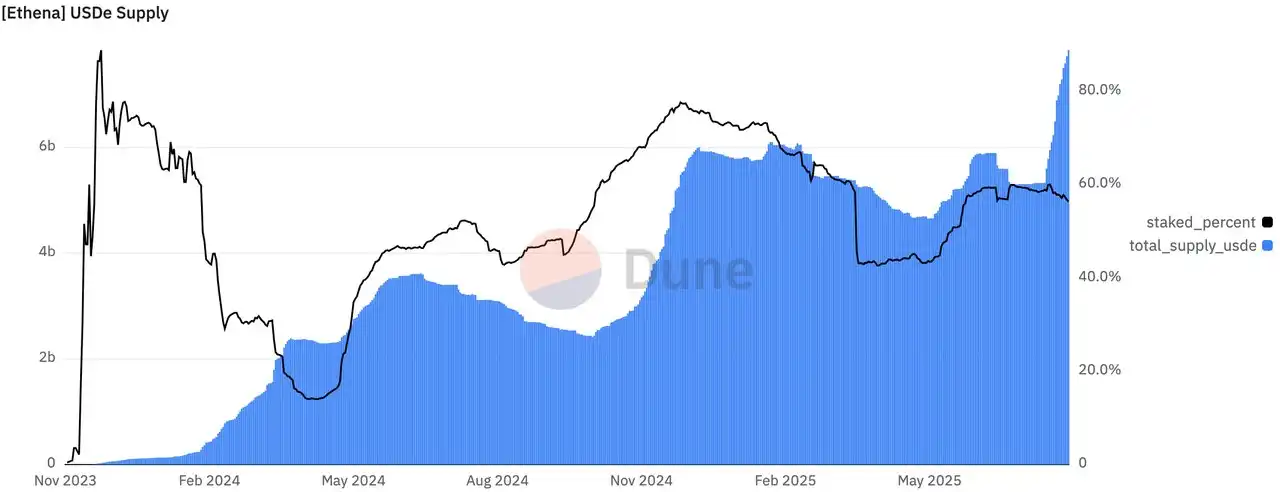
USDe Supply (Data Source: https://dune.com/hashed_official/ethena)
From the above chart, it can be seen that the supply of USDe has suddenly surged recently, reaching a scale of $7.839 billion, creating a historical high, with a growth of 47.93% in the past month, reflecting a significant increase in market demand for USDe.
Comparison of Major Decentralized Stablecoins
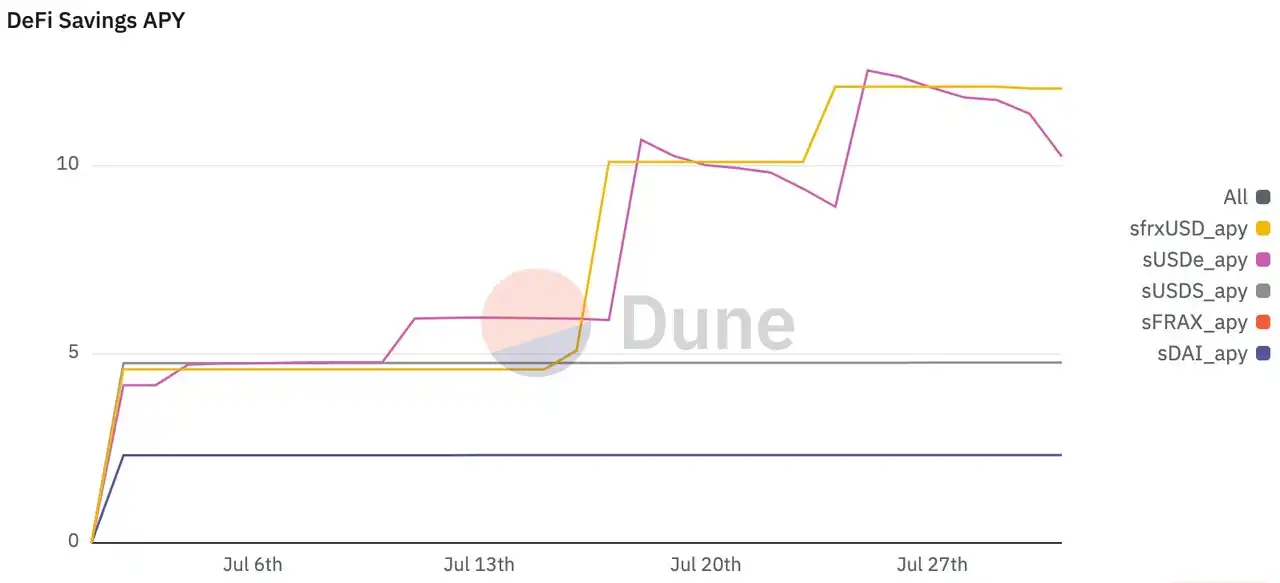
Comparison of Major Decentralized Stablecoins (Data Source: https://dune.com/stablescarab/defi-savings-rate)
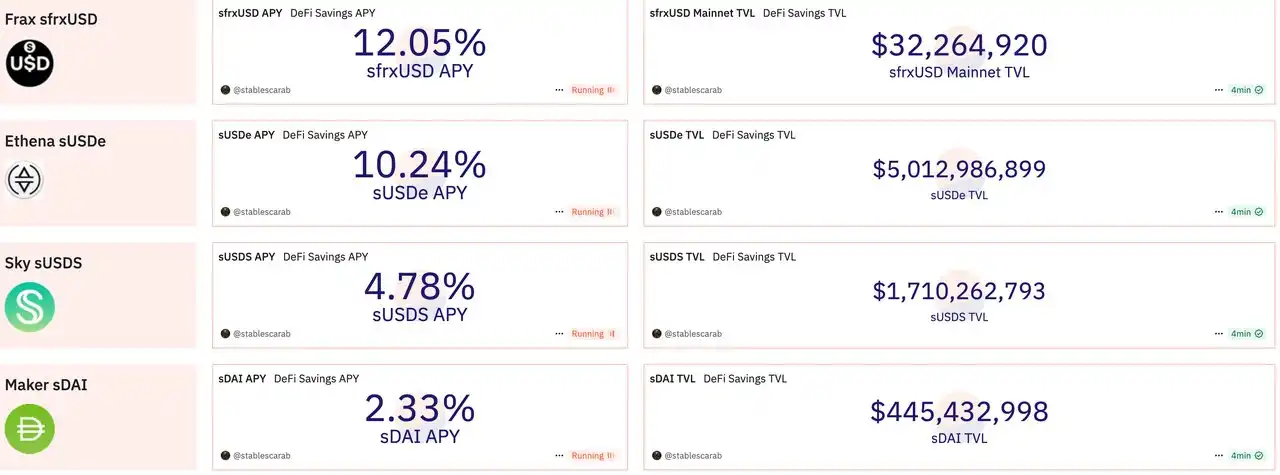
Comparison of Major Decentralized Stablecoins (Data Source: https://dune.com/stablescarab/defi-savings-rate)
From the data in the above charts, it can be seen that the APY of sUSDe has decreased to 10.24% recently, but its APY still remains among the top in terms of returns for major decentralized stablecoin projects, and its scale is the largest among all mainstream decentralized stablecoins, reaching $5.012 billion.
Proportion of sUSDe
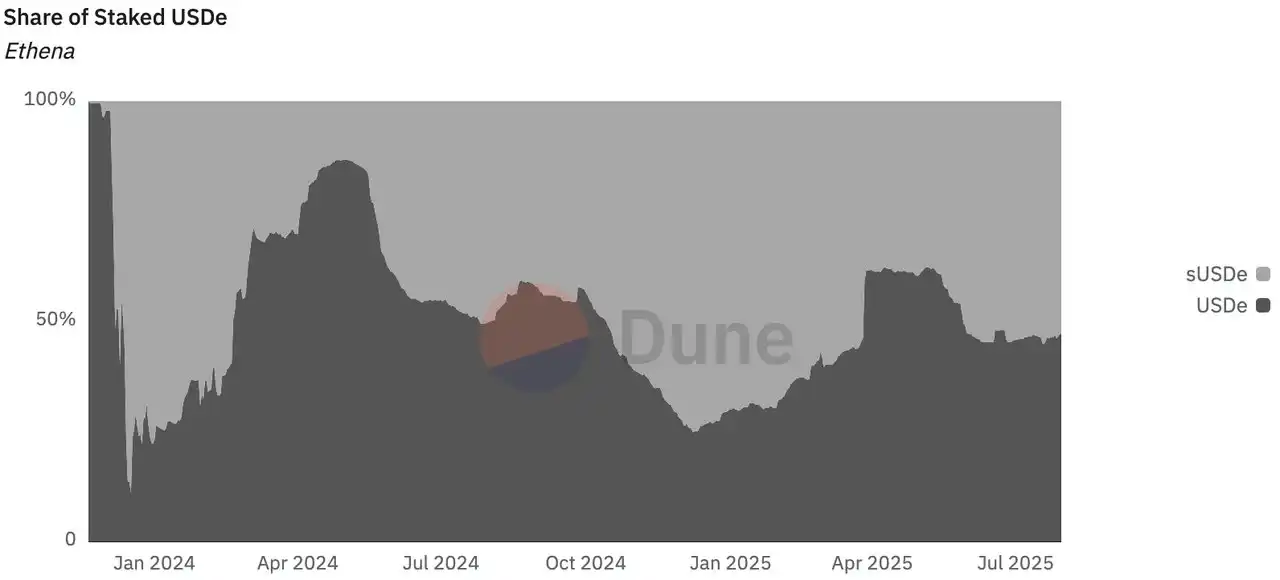
Proportion of sUSDe (Data Source: https://dune.com/hildobby/ethena)
From the above chart, it can be seen that the proportion of sUSDe has exceeded that of USDe, accounting for 53.4%. This indicates that most users use USDe primarily to earn stablecoin yields, and the actual number of users using USDe for on-chain transactions is not the majority.
USDe Trading Volume and Number of Buyers
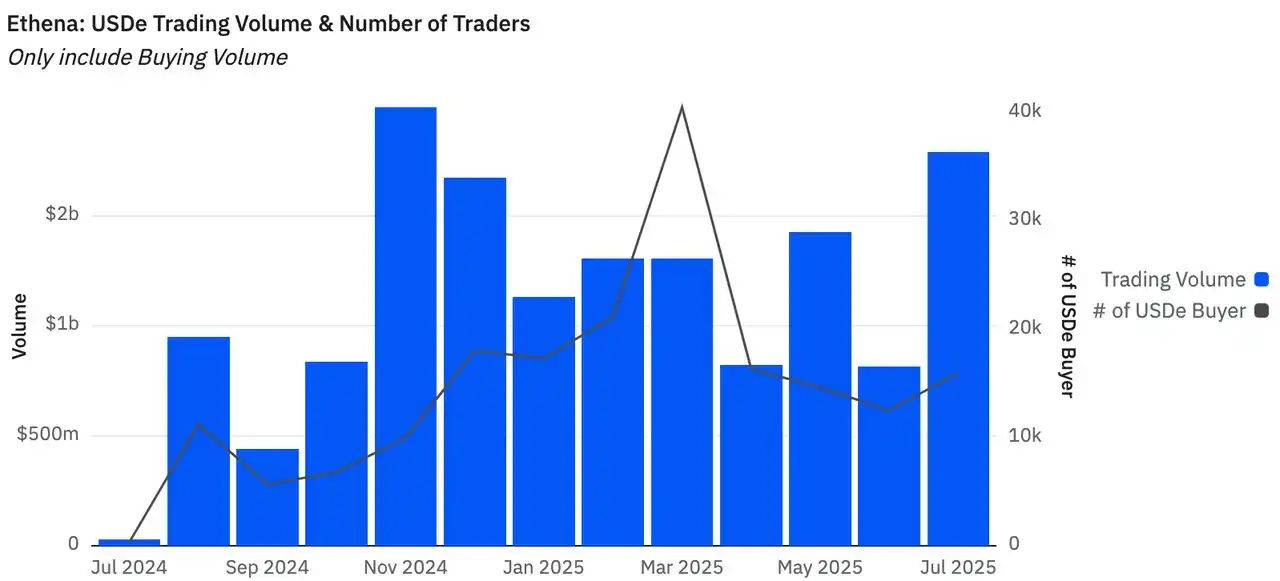
USDe Trading Volume and Number of Buyers (Data Source: https://dune.com/entropy_advisors/ethena-usde)
From the above chart, it can be seen that the trading volume of USDe has significantly increased in the past month, reaching a scale of $1.79 billion, second only to November 2024, and the number of purchasing users has also shown a significant increase, reaching 16,016 people, indicating that new funds and users are continuously entering.
Volatility of USDe
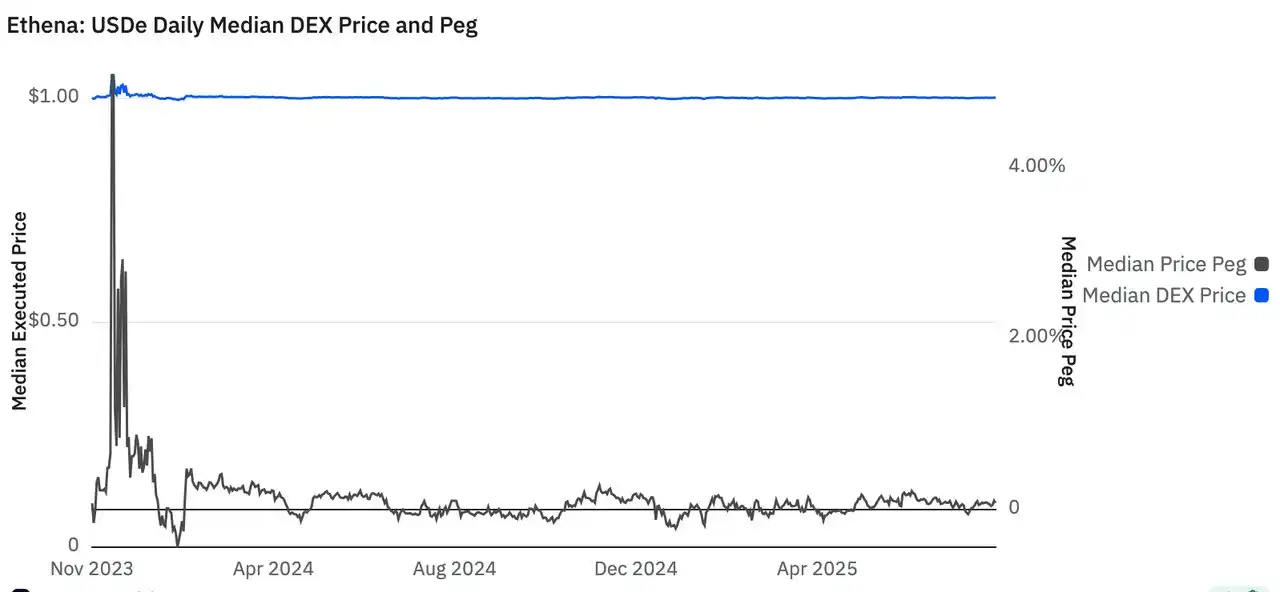
Volatility of USDe (Data Source: https://dune.com/entropy_advisors/ethena-usde)
From the chart, we can see that the volatility of USDe has remained very stable, with no significant decoupling occurring, demonstrating excellent stability, which is one of the core competitive advantages of stablecoin projects.
Summary
Ethena and its stablecoin USDe are demonstrating outstanding performance and strong growth potential in the current cryptocurrency market. Against the backdrop of favorable policies from the U.S. "GENIUS Act," Ethena has successfully seized the opportunity of increasing market demand for stablecoins, achieving comprehensive improvements in TVL, trading volume, and user numbers. The $8 billion TVL scale, $7.839 billion supply, and continuous large-scale capital inflows together form the foundation for Ethena's robust development. The fact that sUSDe accounts for over 53% reflects users' recognition of its yield model, while the leading APY of 10.24% continues to attract yield-oriented investors. At the same time, USDe's excellent price stability has earned it market trust, becoming its core competitive advantage.
As the importance of stablecoins in the crypto ecosystem continues to rise, Ethena is expected to continue expanding its market share and consolidating its leading position in the decentralized stablecoin field. However, the project must also be wary of potential risk factors such as changes in the regulatory environment and intensified market competition, continuously optimizing products and services to maintain long-term sustainable development.
Overall Market Overview
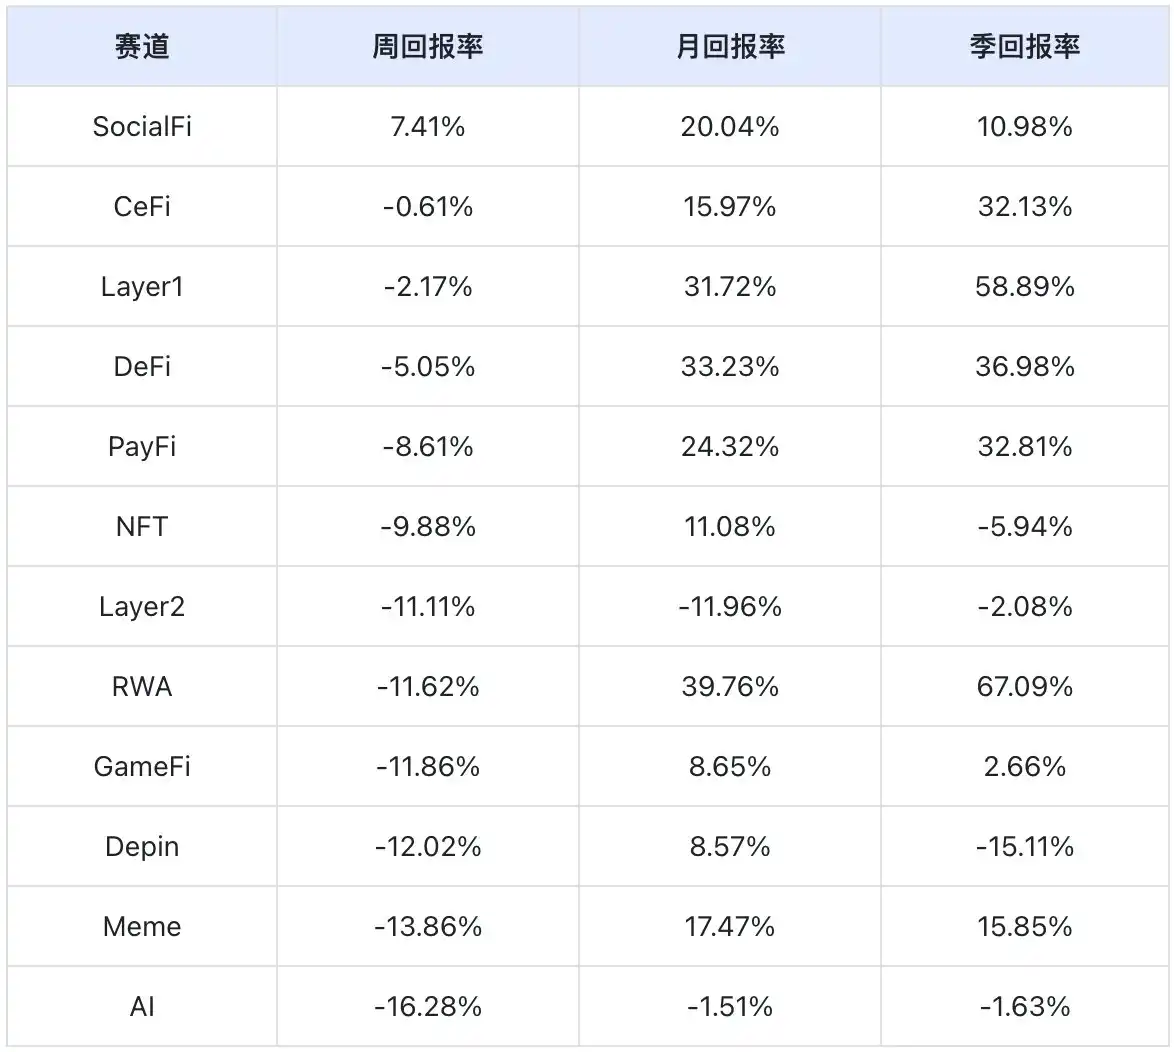
Data Source: SoSoValue
According to weekly return statistics, the SocialFi track performed the best, while the AI track performed the worst.
· SocialFi Track: In the SocialFi track, TON and CHZ account for a large proportion, totaling 96.05%. This week, their price changes were 11.83% and -7.96%, respectively. Since TON occupies a significant share of 91.93% in the SocialFi track, its rise has driven SocialFi's performance to be better than other tracks, making it the best-performing track.
· AI Track: In the AI track, TAO, RENDER, WLD, and FET account for a large proportion, totaling 75.61%. This week, their price changes were -15.16%, -9.36%, -12.78%, and -7.63%, respectively. It can be seen that the projects with a larger share performed worse than those in other tracks, making the AI track the worst performer.
Next Week's Major Crypto Events
· Monday (August 4): Solana Mobile's second phone, Seeker, begins shipping.
· Tuesday (August 5): 2025 Blockchain Science Conference.
· Thursday (August 7): U.S. initial jobless claims for the week ending August 2.
Summary
This week, the cryptocurrency market showed a downward trend, with ETH fluctuating, while Bitcoin and most altcoins exhibited a downward trend. The market sentiment index dropped from 59% to 27.81%, entering a bearish zone. The growth rate of the stablecoin market has slowed, with USDT's market capitalization reaching $163.8 billion, a weekly increase of 0.74%; USDC's market capitalization at $64 billion, a weekly decrease of 1.68%, ending a three-week upward trend. The market is influenced by multiple factors: U.S. employment and GDP data exceeded expectations, Fed Chair Powell's hawkish remarks reduced the expectation of a rate cut in September to 50%, and the core PCE price index remained at 2.58% with no downward trend, while Coinbase's earnings report fell short of expectations, leading to an overall market decline. On the positive side, the U.S. and China reached a temporary 90-day tariff decision, and a tariff agreement was reached with the EU; ETH whales and listed companies continued to purchase, stabilizing market sentiment to some extent.
This week, the Ethena ecosystem performed particularly well, successfully seizing the opportunity of increasing market demand for stablecoins. The supply of USDe soared to $7.839 billion, creating a historical new high, with a growth of 47.93% in the past month, far exceeding other stablecoin projects. In terms of TVL, Ethena has surpassed the $8 billion scale, increasing from a recent low of 1.65 million ETH to 2.19 million ETH, a growth of 30.91%. On-chain capital flow shows that Ethena maintains an average daily inflow of over $300 million, reflecting the market's continued confidence in USDe. Notably, the proportion of sUSDe has reached 53.4%, exceeding that of USDe itself, indicating that most users use USDe primarily to earn stablecoin yields. Its 10.24% APY, although slightly decreased, still leads among major decentralized stablecoins. The trading volume of USDe reached $1.79 billion in recent months, with the number of purchasing users rising to 16,016, while maintaining excellent price stability without significant decoupling, solidifying its leading position in the decentralized stablecoin field.
In the short term, the crypto market may continue to fluctuate. The Fed's cautious attitude towards the rate cut timeline will be a core influencing factor. Institutional capital flow is a key support for market stability; currently, the continuous purchases by ETH whales and listed companies provide a buffer for the market, but if this trend weakens, it may trigger a larger-scale correction. The easing of international trade relations is a positive factor, but whether it can offset the negative impact of the Fed's hawkish stance remains to be seen. Investors should be prepared for medium- to long-term holdings while maintaining sufficient liquidity to cope with volatility. In the absence of significant catalysts, the market will need more time to digest previous gains and build momentum for the next phase. Overall, investors should remain cautious, guard against "black swan" events, and closely monitor institutional purchases of BTC and ETH as important indicators of market direction.
免责声明:本文章仅代表作者个人观点,不代表本平台的立场和观点。本文章仅供信息分享,不构成对任何人的任何投资建议。用户与作者之间的任何争议,与本平台无关。如网页中刊载的文章或图片涉及侵权,请提供相关的权利证明和身份证明发送邮件到support@aicoin.com,本平台相关工作人员将会进行核查。


