# I. Core Principles of Grid Strategy
Grid strategy is a simple and effective quantitative trading strategy. The core idea is to take advantage of market price fluctuations by buying low and selling high, repeatedly accumulating profits within a set range.
1. A Simple Example:
Suppose we have a fruit market stall where the price of apples fluctuates between $1 and $2 daily:
● If someone is willing to buy apples for $1.5, we sell to them;
● If the price drops to $1.2, we buy at the lower price;
● When the price rebounds to $1.7, we sell again for a profit.
Even if the overall market price is fluctuating rather than rising, we consistently earn the price difference, just like how the grid strategy operates in the cryptocurrency market.
2. Core Principle: Buy Low, Sell High, Lock in Profits from Each Fluctuation
Assuming the price of BTC in the market often fluctuates within a certain range (for example, between $110,000 and $130,000), but you cannot accurately determine whether it will break upwards or downwards.
If you try to buy in one go and wait for the trend, you might take on significant risk. This is where the unique advantage of the grid strategy comes into play:
● Divide the price range ($110,000~$130,000) into several "small grids" (for example, every $1,000 is one grid).
● Every time the price drops to a certain grid, buy a certain amount.
● Every time the price rises to a certain grid, sell a certain amount.
With this strategy, every time the price fluctuates between grids, you capture a small profit. Moreover, whether the market is consolidating or experiencing significant price swings, as long as the price changes within this range, you can continue to profit.
3. Why is the Grid Strategy Effective?
Essentially, many cryptocurrency prices (such as Bitcoin and Ethereum) often exhibit high volatility and uncertain direction. This kind of fluctuating market is very suitable for the grid strategy for several reasons:
(1) Prices do not "always rise" or "always fall":
Most of the time, market prices go through cycles of rising, falling, and consolidating. Even if prices show a long-term trend, they usually come with short-term pullbacks and rebounds. The grid strategy takes advantage of these price fluctuations, breaking the overall trend into multiple small trading opportunities.
(2) Avoids Subjective Judgment:
In traditional methods, investors always hope to "buy at the low and sell at the high," but often miss opportunities due to incorrect judgments. The grid strategy is based on the principle of "mechanical buying and selling," which does not require judging the specific direction of the market. As long as the range and grids are set, it can operate automatically, eliminating emotional interference.
(3) Suitable for Volatile Markets, Mitigating Fear and Greed:
In a volatile market, ordinary investors may hesitate to buy due to fear of prices breaking support or may not know when to sell due to concerns about missing out on profits. The grid strategy precisely buys low and sells high during each market fluctuation, helping investors profit easily.
4. Mechanism of Grid Strategy Operation
Assuming we operate an asset through the grid strategy, it can be broken down into the following steps:
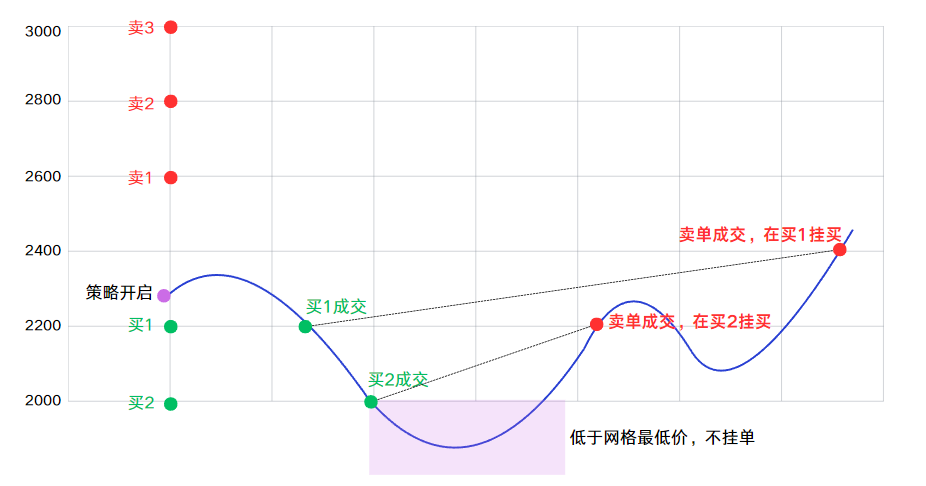
1) Set the Price Range (High and Low): For example, expect the price of ETH to fluctuate between $2000 and $3000.
2) Divide the Grid: Split the range into several small segments (for example, 5 grids, with each grid being $200).
3) Set the Capital for Each Trade: Assume buying 0.05 ETH for each grid, keeping total capital within a reasonable range.
4) Grid Trigger Logic: When the price drops from above $2200 to $2200, buy 0.05 ETH;
● When the price rebounds from $2200 to $2400, sell 0.05 ETH.
● In simple terms, each time a buy or sell action is triggered, it achieves a "buy low, sell high."
5) Automated Execution: With the help of grid bots or quantitative tools from exchanges, all operations will be processed automatically.
# II. Advantages of Neutral Grid Strategy
- Types of Grids
1) Spot Grid
The spot grid strategy is the most common grid trading model, usually operating in the spot market. It captures price differences in a volatile market through distributed buying and selling operations.
Applicable Scenarios: Suitable for volatile markets.
2) Trend Grid
The trend grid is an optimization of the traditional grid, specifically designed to capture one-sided upward or downward trends. It adjusts grid actions based on price movements, such as dynamically increasing or decreasing positions.
Applicable Scenarios: Suitable for clear one-sided trend markets (e.g., continuous price increases or decreases).
3) Reversal Grid
The reversal grid is a grid strategy that automatically adjusts positions when prices reach a certain high or low, aiming to capture market reversals.
Applicable Scenarios: Suitable for high-volatility market environments, especially when prices fluctuate between support and resistance levels.
4) Neutral Grid
The neutral grid is a more advanced grid strategy that simultaneously opens long and short positions through contract trading, capturing market fluctuations with a bidirectional layout to achieve market-neutral operations.
Applicable Scenarios: Suitable for volatile markets, high-volatility markets, or trends with unclear directions.
2. Analysis of the Advantages and Disadvantages of Different Grids

3. Outstanding Advantages of Neutral Grid
Advantage 1. Bidirectional Profit, Market Neutral Operations
● The neutral grid strategy can effectively profit from price fluctuations by simultaneously opening long and short positions, without needing to make any subjective judgments about market direction.
● Even if the market shows a one-sided rise or fall, it can lock in some profits through bidirectional layouts.
Advantage 2. Risk Balancing Mechanism
● Traditional grid strategies may incur losses in one-sided markets, while the neutral grid significantly reduces overall risk through bidirectional position hedging.
● For example, if prices continue to rise, short positions may incur floating losses, but the profits from long positions will cover the losses.
Advantage 3. High Capital Utilization Efficiency
● The spot grid strategy requires holding a large amount of spot assets, while the neutral grid relies on the contract system, allowing for leveraged positions, effectively reducing capital occupancy while amplifying profit potential.
● Even users with low capital can implement more flexible grid strategies through leveraged operations.
Advantage 4. Wide Applicability in Market Environments
● Whether in volatile markets, high-volatility markets, or markets with unclear directions, the neutral grid has good adaptability, enabling stable profits in various market conditions.
● In uncertain market environments, investors can reduce the pressure of judging direction through the neutral grid, using tools to achieve "strategic profits."
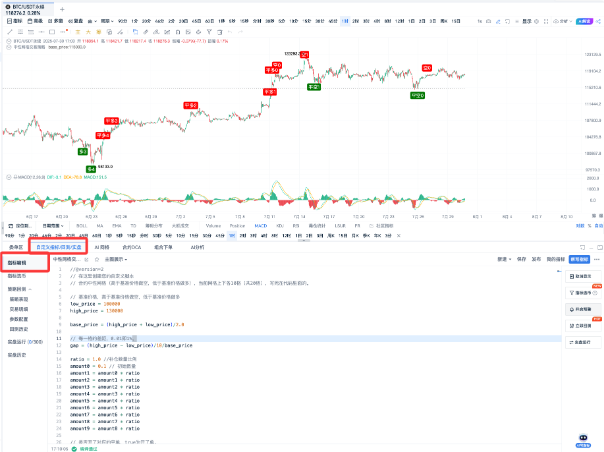
# III. Signal Effect of Neutral Grid Strategy
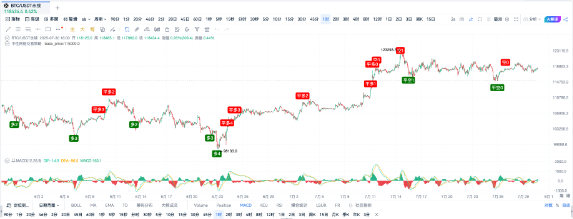
Figure OKX-BTCUSDT Perpetual Contract 1-Hour Cycle Signal Display
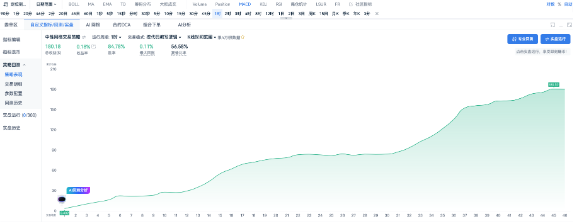
Figure OKX-BTCUSDT Perpetual Contract 1-Hour Cycle Backtest Results
Backtest Highlights: Win Rate 84%
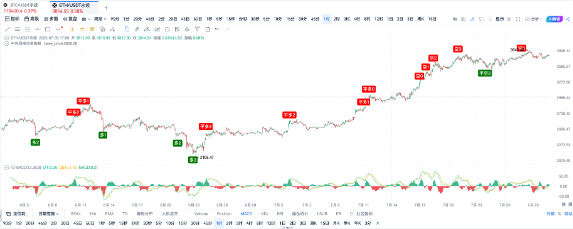
Figure OKX-ETHUSDT Perpetual Contract 30-Minute Cycle Signal Effect

Figure OKX-ETHUSDT Perpetual Contract 30-Minute Cycle Backtest Results
Backtest Highlights: Win Rate 83%+
# IV. Indicator Source Code
//@version=2
// Create your custom script here
// Contract Neutral Grid (short above the benchmark price, long below the benchmark price), currently 10 grids above and below (a total of 20 grids), hardcoded in the code.
// Benchmark price, short above the benchmark price, long below the benchmark price
low_price = 100000
high_price = 130000
base_price = (high_price + low_price)/2.0
// The gap for each grid, 0.01 means 1%.
gap = (high_price - low_price)/10/base_price
ratio = 1.0 // replenishment quantity ratio
amount0 = 0.1 // initial quantity
amount1 = amount0 * ratio
amount2 = amount1 * ratio
amount3 = amount2 * ratio
amount4 = amount3 * ratio
amount5 = amount4 * ratio
amount6 = amount5 * ratio
amount7 = amount6 * ratio
amount8 = amount7 * ratio
amount9 = amount8 * ratio
// Whether the corresponding short position is opened, true means it is opened.
var short_status0 = false
var short_status1 = false
var short_status2 = false
var short_status3 = false
var short_status4 = false
var short_status5 = false
var short_status6 = false
var short_status7 = false
var short_status8 = false
var short_status9 = false
var long_status0 = false
var long_status1 = false
var long_status2 = false
var long_status3 = false
var long_status4 = false
var long_status5 = false
var long_status6 = false
var long_status7 = false
var long_status8 = false
var long_status9 = false
longprices0 = baseprice(1-gap1)
longprices1 = baseprice(1-gap2)
longprices2 = baseprice(1-gap3)
longprices3 = baseprice(1-gap4)
longprices4 = baseprice(1-gap5)
longprices5 = baseprice(1-gap6)
longprices6 = baseprice(1-gap7)
longprices7 = baseprice(1-gap8)
longprices8 = baseprice(1-gap9)
longprices9 = baseprice(1-gap10)
shortprices0 = baseprice(1+gap1)
shortprices1 = baseprice(1+gap2)
shortprices2 = baseprice(1+gap3)
shortprices3 = baseprice(1+gap4)
shortprices4 = baseprice(1+gap5)
shortprices5 = baseprice(1+gap6)
shortprices6 = baseprice(1+gap7)
shortprices7 = baseprice(1+gap8)
shortprices8 = baseprice(1+gap9)
shortprices9 = baseprice(1+gap10)
// Long entry conditions
long0 = close < longprices0 and not longstatus0
long1 = close < longprices1 and not longstatus1
long2 = close < longprices2 and not longstatus2
long3 = close < longprices3 and not longstatus3
long4 = close < longprices4 and not longstatus4
long5 = close < longprices5 and not longstatus5
long6 = close < longprices6 and not longstatus6
long7 = close < longprices7 and not longstatus7
long8 = close < longprices8 and not longstatus8
long9 = close < longprices9 and not longstatus9
enterLongAmount(long0, id = 'long0', price='market', amount=amount0)
enterLongAmount(long1, id = 'long1', price='market', amount=amount1)
enterLongAmount(long2, id = 'long2', price='market', amount=amount2)
enterLongAmount(long3, id = 'long3', price='market', amount=amount3)
enterLongAmount(long4, id = 'long4', price='market', amount=amount4)
enterLongAmount(long5, id = 'long5', price='market', amount=amount5)
enterLongAmount(long6, id = 'long6', price='market', amount=amount6)
enterLongAmount(long7, id = 'long7', price='market', amount=amount7)
enterLongAmount(long8, id = 'long8', price='market', amount=amount8)
enterLongAmount(long9, id = 'long9', price='market', amount=amount9)
plotText(long0, title='long0', text='Long 0', refSeries=low, bgColor='green', color='white', fontSize=14, placement='bottom', display=true)
plotText(long1, title='long1', text='Long 1', refSeries=low, bgColor='green', color='white', fontSize=14, placement='bottom', display=true)
plotText(long2, title='long2', text='Long 2', refSeries=low, bgColor='green', color='white', fontSize=14, placement='bottom', display=true)
plotText(long3, title='long3', text='Long 3', refSeries=low, bgColor='green', color='white', fontSize=14, placement='bottom', display=true)
plotText(long4, title='long4', text='Long 4', refSeries=low, bgColor='green', color='white', fontSize=14, placement='bottom', display=true)
plotText(long5, title='long5', text='Long 5', refSeries=low, bgColor='green', color='white', fontSize=14, placement='bottom', display=true)
plotText(long6, title='long6', text='Long 6', refSeries=low, bgColor='green', color='white', fontSize=14, placement='bottom', display=true)
plotText(long7, title='long7', text='Long 7', refSeries=low, bgColor='green', color='white', fontSize=14, placement='bottom', display=true)
plotText(long8, title='long8', text='Long 8', refSeries=low, bgColor='green', color='white', fontSize=14, placement='bottom', display=true)
plotText(long9, title='long9', text='Long 9', refSeries=low, bgColor='green', color='white', fontSize=14, placement='bottom', display=true)
if long0 {
long_status0 := true
}
if long1 {
long_status1 := true
}
if long2 {
long_status2 := true
}
if long3 {
long_status3 := true
}
if long4 {
long_status4 := true
}
long_status5 := true

}

if long6 {

long_status6 := true

}

if long7 {

long_status7 := true

}

if long8 {

long_status8 := true

}

if long9 {

long_status9 := true

}

// Short entry conditions

short0 = close > short_prices0 and not short_status0

short1 = close > short_prices1 and not short_status1

short2 = close > short_prices2 and not short_status2

short3 = close > short_prices3 and not short_status3

short4 = close > short_prices4 and not short_status4

short5 = close > short_prices5 and not short_status5

short6 = close > short_prices6 and not short_status6

short7 = close > short_prices7 and not short_status7

short8 = close > short_prices8 and not short_status8

short9 = close > short_prices9 and not short_status9

enterShortAmount(short0, id='short0', price='market', amount=amount0)

enterShortAmount(short1, id='short1', price='market', amount=amount1)

enterShortAmount(short2, id='short2', price='market', amount=amount2)

enterShortAmount(short3, id='short3', price='market', amount=amount3)

enterShortAmount(short4, id='short4', price='market', amount=amount4)

enterShortAmount(short5, id='short5', price='market', amount=amount5)

enterShortAmount(short6, id='short6', price='market', amount=amount6)

enterShortAmount(short7, id='short7', price='market', amount=amount7)

enterShortAmount(short8, id='short8', price='market', amount=amount8)

enterShortAmount(short9, id='short9', price='market', amount=amount9)

plotText(short0, title='short0', text='Short 0', refSeries=high, bgColor='red', color='white', fontSize=14, placement='top', display=true)

plotText(short1, title='short1', text='Short 1', refSeries=high, bgColor='red', color='white', fontSize=14, placement='top', display=true)

plotText(short2, title='short2', text='Short 2', refSeries=high, bgColor='red', color='white', fontSize=14, placement='top', display=true)

plotText(short3, title='short3', text='Short 3', refSeries=high, bgColor='red', color='white', fontSize=14, placement='top', display=true)

plotText(short4, title='short4', text='Short 4', refSeries=high, bgColor='red', color='white', fontSize=14, placement='top', display=true)

plotText(short5, title='short5', text='Short 5', refSeries=high, bgColor='red', color='white', fontSize=14, placement='top', display=true)

plotText(short6, title='short6', text='Short 6', refSeries=high, bgColor='red', color='white', fontSize=14, placement='top', display=true)

plotText(short7, title='short7', text='Short 7', refSeries=high, bgColor='red', color='white', fontSize=14, placement='top', display=true)

plotText(short8, title='short8', text='Short 8', refSeries=high, bgColor='red', color='white', fontSize=14, placement='top', display=true)

plotText(short9, title='short9', text='Short 9', refSeries=high, bgColor='red', color='white', fontSize=14, placement='top', display=true)

if short0 {

short_status0 := true

}

if short1 {

short_status1 := true

}

if short2 {

short_status2 := true

}

if short3 {

short_status3 := true

}

if short4 {

short_status4 := true

}

if short5 {

short_status5 := true

}

if short6 {

short_status6 := true

}

if short7 {

short_status7 := true

}

if short8 {

short_status8 := true

}

if short9 {

short_status9 := true

}

// Long exit conditions

exit_long0 = close > base_price and long_status0

exit_long1 = close > long_prices0 and long_status1

exit_long2 = close > long_prices1 and long_status2

exit_long3 = close > long_prices2 and long_status3

exit_long4 = close > long_prices3 and long_status4

exit_long5 = close > long_prices4 and long_status5

exit_long6 = close > long_prices5 and long_status6

exit_long7 = close > long_prices6 and long_status7

exit_long8 = close > long_prices7 and long_status8

exit_long9 = close > long_prices8 and long_status9

exitLongAmount(exit_long0, id='exit_long0', price='market', amount=amount0)
exitLongAmount(exitlong1, id='exitlong1', price='market', amount=amount1)
exitLongAmount(exitlong2, id='exitlong2', price='market', amount=amount2)
exitLongAmount(exitlong3, id='exitlong3', price='market', amount=amount3)
exitLongAmount(exitlong4, id='exitlong4', price='market', amount=amount4)
exitLongAmount(exitlong5, id='exitlong5', price='market', amount=amount5)
exitLongAmount(exitlong6, id='exitlong6', price='market', amount=amount6)
exitLongAmount(exitlong7, id='exitlong7', price='market', amount=amount7)
exitLongAmount(exitlong8, id='exitlong8', price='market', amount=amount8)
exitLongAmount(exitlong9, id='exitlong9', price='market', amount=amount9)
plotText(exitlong0, title='exitlong0', text='Close Long 0', refSeries=high, bgColor='red', color='white', fontSize=14, placement='top', display=true)
plotText(exitlong1, title='exitlong1', text='Close Long 1', refSeries=high, bgColor='red', color='white', fontSize=14, placement='top', display=true)
plotText(exitlong2, title='exitlong2', text='Close Long 2', refSeries=high, bgColor='red', color='white', fontSize=14, placement='top', display=true)
plotText(exitlong3, title='exitlong3', text='Close Long 3', refSeries=high, bgColor='red', color='white', fontSize=14, placement='top', display=true)
plotText(exitlong4, title='exitlong4', text='Close Long 4', refSeries=high, bgColor='red', color='white', fontSize=14, placement='top', display=true)
plotText(exitlong5, title='exitlong5', text='Close Long 5', refSeries=high, bgColor='red', color='white', fontSize=14, placement='top', display=true)
plotText(exitlong6, title='exitlong6', text='Close Long 6', refSeries=high, bgColor='red', color='white', fontSize=14, placement='top', display=true)
plotText(exitlong7, title='exitlong7', text='Close Long 7', refSeries=high, bgColor='red', color='white', fontSize=14, placement='top', display=true)
plotText(exitlong8, title='exitlong8', text='Close Long 8', refSeries=high, bgColor='red', color='white', fontSize=14, placement='top', display=true)
plotText(exitlong9, title='exitlong9', text='Close Long 9', refSeries=high, bgColor='red', color='white', fontSize=14, placement='top', display=true)
if(exit_long0) {
long_status0 := false
}
if(exit_long1) {
long_status1 := false
}
if(exit_long2) {
long_status2 := false
}
if(exit_long3) {
long_status3 := false
}
if(exit_long4) {
long_status4 := false
}
if(exit_long5) {
long_status5 := false
}
if(exit_long6) {
long_status6 := false
}
if(exit_long7) {
long_status7 := false
}
if(exit_long8) {
long_status8 := false
}
if(exit_long9) {
long_status9 := false
}
// Short exit conditions
exitshort0 = close < baseprice and short_status0
exitshort1 = close < shortprices0 and short_status1
exitshort2 = close < shortprices1 and short_status2
exitshort3 = close < shortprices2 and short_status3
exitshort4 = close < shortprices3 and short_status4
exitshort5 = close < shortprices4 and short_status5
exitshort6 = close < shortprices5 and short_status6
exitshort7 = close < shortprices6 and short_status7
exitshort8 = close < shortprices7 and short_status8
exitshort9 = close < shortprices8 and short_status9
exitShortAmount(exitshort0, id='exitshort0', price='market', amount=amount0)
exitShortAmount(exitshort1, id='exitshort1', price='market', amount=amount1)
exitShortAmount(exitshort2, id='exitshort2', price='market', amount=amount2)
exitShortAmount(exitshort3, id='exitshort3', price='market', amount=amount3)
exitShortAmount(exitshort4, id='exitshort4', price='market', amount=amount4)
exitShortAmount(exitshort5, id='exitshort5', price='market', amount=amount5)
exitShortAmount(exitshort6, id='exitshort6', price='market', amount=amount6)
exitShortAmount(exitshort7, id='exitshort7', price='market', amount=amount7) ```
exitShortAmount(exitshort8, id='exitshort8', price='market', amount=amount8)
exitShortAmount(exitshort9, id='exitshort9', price='market', amount=amount9)
plotText(exitshort0, title='exitshort0', text='Close Short 0', refSeries=low, bgColor='green', color='white', fontSize=14, placement='bottom', display=true)
plotText(exitshort1, title='exitshort1', text='Close Short 1', refSeries=low, bgColor='green', color='white', fontSize=14, placement='bottom', display=true)
plotText(exitshort2, title='exitshort2', text='Close Short 2', refSeries=low, bgColor='green', color='white', fontSize=14, placement='bottom', display=true)
plotText(exitshort3, title='exitshort3', text='Close Short 3', refSeries=low, bgColor='green', color='white', fontSize=14, placement='bottom', display=true)
plotText(exitshort4, title='exitshort4', text='Close Short 4', refSeries=low, bgColor='green', color='white', fontSize=14, placement='bottom', display=true)
plotText(exitshort5, title='exitshort5', text='Close Short 5', refSeries=low, bgColor='green', color='white', fontSize=14, placement='bottom', display=true)
plotText(exitshort6, title='exitshort6', text='Close Short 6', refSeries=low, bgColor='green', color='white', fontSize=14, placement='bottom', display=true)
plotText(exitshort7, title='exitshort7', text='Close Short 7', refSeries=low, bgColor='green', color='white', fontSize=14, placement='bottom', display=true)
plotText(exitshort8, title='exitshort8', text='Close Short 8', refSeries=low, bgColor='green', color='white', fontSize=14, placement='bottom', display=true)
plotText(exitshort9, title='exitshort9', text='Close Short 9', refSeries=low, bgColor='green', color='white', fontSize=14, placement='bottom', display=true)
if (exit_short0) {
short_status0 := false
}
if (exit_short1) {
short_status1 := false
}
if (exit_short2) {
short_status2 := false
}
if (exit_short3) {
short_status3 := false
}
if (exit_short4) {
short_status4 := false
}
if (exit_short5) {
short_status5 := false
}
if (exit_short6) {
short_status6 := false
}
if (exit_short7) {
short_status7 := false
}
if (exit_short8) {
short_status8 := false
}
if (exit_short9) {
short_status9 := false
}
plot(base_price, color='gray', lineDash=[2,4])
(This strategy needs to run on the AiCoin custom indicator panel)
V. Summary
Grid trading is a classic quantitative strategy, ranging from spot grids to trend grids, reversal grids, and neutral grids, each with its own characteristics and applicable scenarios. Among them, the neutral grid achieves market-neutral operations through its bidirectional layout, performing better in different market environments.
Core Advantages of Neutral Grids:
Bidirectional Profitability, Adapting to Various Market Conditions: Whether the market is volatile or trending, both long and short positions can capture profits through fluctuations, achieving higher fault tolerance.
Higher Capital Utilization: Relying on contract leverage, neutral grids reduce the capital occupation of spot positions, amplifying profit potential.
Automation and Risk Balancing: No need for subjective judgment of market direction; systematic operations achieve stable output, suitable for complex and highly volatile markets.
Whether you are a novice investor seeking stable returns or a seasoned player focusing on efficiency and risk control, neutral grids can provide you with a highly efficient, flexible, and robust trading method.
Join our community to discuss and grow stronger together!
Official Telegram Community: t.me/aicoincn
AiCoin Chinese Twitter: https://x.com/AiCoinzh
Group Chat - Wealth Group: https//www.aicoin.com/link/chat?cid=10013
免责声明:本文章仅代表作者个人观点,不代表本平台的立场和观点。本文章仅供信息分享,不构成对任何人的任何投资建议。用户与作者之间的任何争议,与本平台无关。如网页中刊载的文章或图片涉及侵权,请提供相关的权利证明和身份证明发送邮件到support@aicoin.com,本平台相关工作人员将会进行核查。


