TL; DR
- In July 2025, the U.S. economy continued to experience a pattern of rising inflation alongside weakening growth momentum, with both CPI and core inflation exceeding the Federal Reserve's 2% target, making a shift towards easing unlikely in the short term. The labor market, while overall stable, showed signs of marginal weakness, with moderate consumer rebound and unstable fundamentals. High interest rates and credit costs continued to suppress household spending. Disagreements within the Federal Reserve regarding the timing of interest rate cuts intensified, with market expectations leaning towards a potential cut in September, contingent on subsequent inflation and employment data. Meanwhile, geopolitical risks and domestic policy disputes heightened market uncertainty, leading the Fed to maintain a high interest rate and a wait-and-see stance, putting overall market risk appetite under pressure.
- In July, the trading volume in the cryptocurrency market significantly increased, averaging $161.2 billion per day, a 56% rise from the previous month, with multiple days surpassing $200 billion. The total market capitalization rose to $3.94 trillion (+16.2%), with BTC's market share at 60.6% and ETH's at 11.8%, as funds accelerated from BTC to ETH and its ecosystem, rapidly warming market sentiment. Newly launched popular tokens were primarily infrastructure projects, with Layer 1 and Layer 2 (such as Chainbase, ZKWASM, Caldera, ERA, etc.) receiving the most attention, while DeFi applications remained an important growth driver.
- In July, BTC spot ETF saw a net inflow of $20.15 billion, and ETH saw a net inflow of $10.71 billion, driving prices up by 11.46% and 55.83%, respectively, with Ethereum showing stronger appeal. During the same period, the circulation of stablecoins surged by $9.617 billion, with USDE skyrocketing by 36.2% in a single month, leading the market.
- This week, BTC attempted to break through $120,000 multiple times but failed, peaking at $120,113 on July 23 before retracing to a low of $114,759, currently priced around $119,600, still constrained by the 20-day moving average (around $116,300). ETH showed the strongest performance, rising from $3,740 to $3,881 over the past two days, with ETF net inflows reaching $2.4 billion in six days. If it breaks through $3,745, it may target $4,094–$4,868. SOL, on the other hand, was relatively weak, dropping to a low of $184 after falling below $200, currently consolidating in the $187–$190 range, with a potential drop to $157 if it breaks below $176.
- Companies like SharpLink and Bitmine have significantly increased their holdings in ETH and engaged in on-chain staking, creating an "Ethereum version of MicroStrategy," pushing ETH from a technical asset to an institutional-grade reserve asset. The GENIUS Act, as the first federal stablecoin legislation in the U.S., has officially come into effect, clarifying the regulatory path for stablecoin banks and stimulating stablecoin inflows while institutions accelerate their layout in on-chain payment and settlement applications. The first Solana ETF (SSK) supporting on-chain staking has been listed in the U.S., pioneering a "staking + cash dividend" structure, marking a new era for crypto ETFs towards income-generating products.
- The CLARITY Act has passed the House and is now under Senate review, expected to promote compliance and capital inflow in the U.S. crypto market. The approval process for Solana spot ETFs is accelerating, with several institutions submitting applications and the SEC expected to announce results by October at the latest. The Ethereum staking ETF led by BlackRock is also under review, with hopes for approval in the fourth quarter of 2025.
1. Macroeconomic Perspective
In July 2025, the U.S. macroeconomy continued to exhibit a pattern of rising inflation alongside weakening growth momentum. Current inflation levels have rebounded compared to previous months, still significantly deviating from the Federal Reserve's 2% target, with monetary policy maintaining a highly cautious stance. At the same time, the labor market is showing marginal cooling, and while consumer spending has rebounded, the foundation remains unstable, compounded by uncertainties arising from geopolitical and internal policy disputes, which continue to disrupt market sentiment.
Inflation Remains Above Target
From an inflation perspective, June CPI data showed that the annualized overall inflation rate in the U.S. rose to 2.7%, with core inflation slightly increasing to 2.9%. The rise in input costs due to tariff adjustments has made price increases particularly evident in the service sector, especially in housing, healthcare, and insurance. Several Federal Reserve officials emphasized that current data does not support an immediate start to an easing cycle, and the persistence of core inflation still needs further confirmation, with policies remaining focused on "stability" in the short term.
Labor Market Stabilizing but Marginally Cooling
In June, non-farm employment increased by 147,000, below the monthly average of the past 12 months, with the unemployment rate slightly decreasing from 4.2% to 4.1%. The number of initial jobless claims has declined for six consecutive weeks, indicating that the overall resilience of the labor market remains. However, hiring intentions in sectors such as manufacturing and construction have weakened, and employers in some regions have begun to slow down their hiring pace, showing signs of marginal weakness.
Moderate Consumer Rebound
In terms of consumption, June retail sales increased by 0.6% month-on-month, marking the first rebound in nearly three months, with non-essential goods and online consumption showing relatively positive recovery. However, the high interest rate environment, rising credit costs, and declining savings rates continue to suppress the willingness of households to spend on mid-to-high-end goods. Data shows that consumers in several regions are adopting a conservative attitude towards high-priced items, and the recovery momentum in the tourism and accommodation sectors is also weakening. While consumption has not deteriorated significantly, its resilience remains challenged.
Increasing Disagreement on Interest Rate Policy
In terms of monetary policy, the market generally expects the Federal Reserve to maintain the benchmark interest rate at 4.25%-4.50% during the FOMC meeting on July 30, marking the fifth consecutive pause in rate hikes. Despite marginal improvements in inflation data, internal disagreements within the Fed regarding the timing of interest rate cuts have intensified. Some dovish members are calling for a quick rate cut to hedge against potential growth risks, while hawkish members advocate for maintaining stable rates until a more evident decline in inflation is observed. Currently, the market expects the earliest rate cut to occur in September, with the probability of two rate cuts within the year gradually increasing.
Geopolitical Uncertainty
On the international front, conflicts in the Middle East have not significantly cooled, the war in Ukraine continues, and while the U.S. and China have resumed trade dialogue, deep-seated differences remain on key issues such as high technology and data regulation. Meanwhile, domestic controversies regarding the Federal Reserve have raised questions about the independence of monetary policy, putting pressure on policy transparency and credibility. These internal and external risks collectively impact corporate long-term investment confidence, with market risk appetite continuing to be under pressure.
Outlook
In summary, the U.S. economy in July 2025 is at a critical stage of competing forces. Inflation has not yet met the target, employment momentum is marginally weakening, consumer recovery is fragile, and monetary policy signals are unclear. The Fed will continue to anchor its short-term policies on data, maintaining a cautious and observational approach, while the market is highly focused on the performance of core economic data in August and September, as well as the trajectory of geopolitical risks. If subsequent data supports a continued decline in inflation and increased employment pressures, the Fed may formally enter a rate-cutting phase in the fall.
2. Overview of the Cryptocurrency Market
Cryptocurrency Data Analysis
Trading Volume & Daily Growth Rate
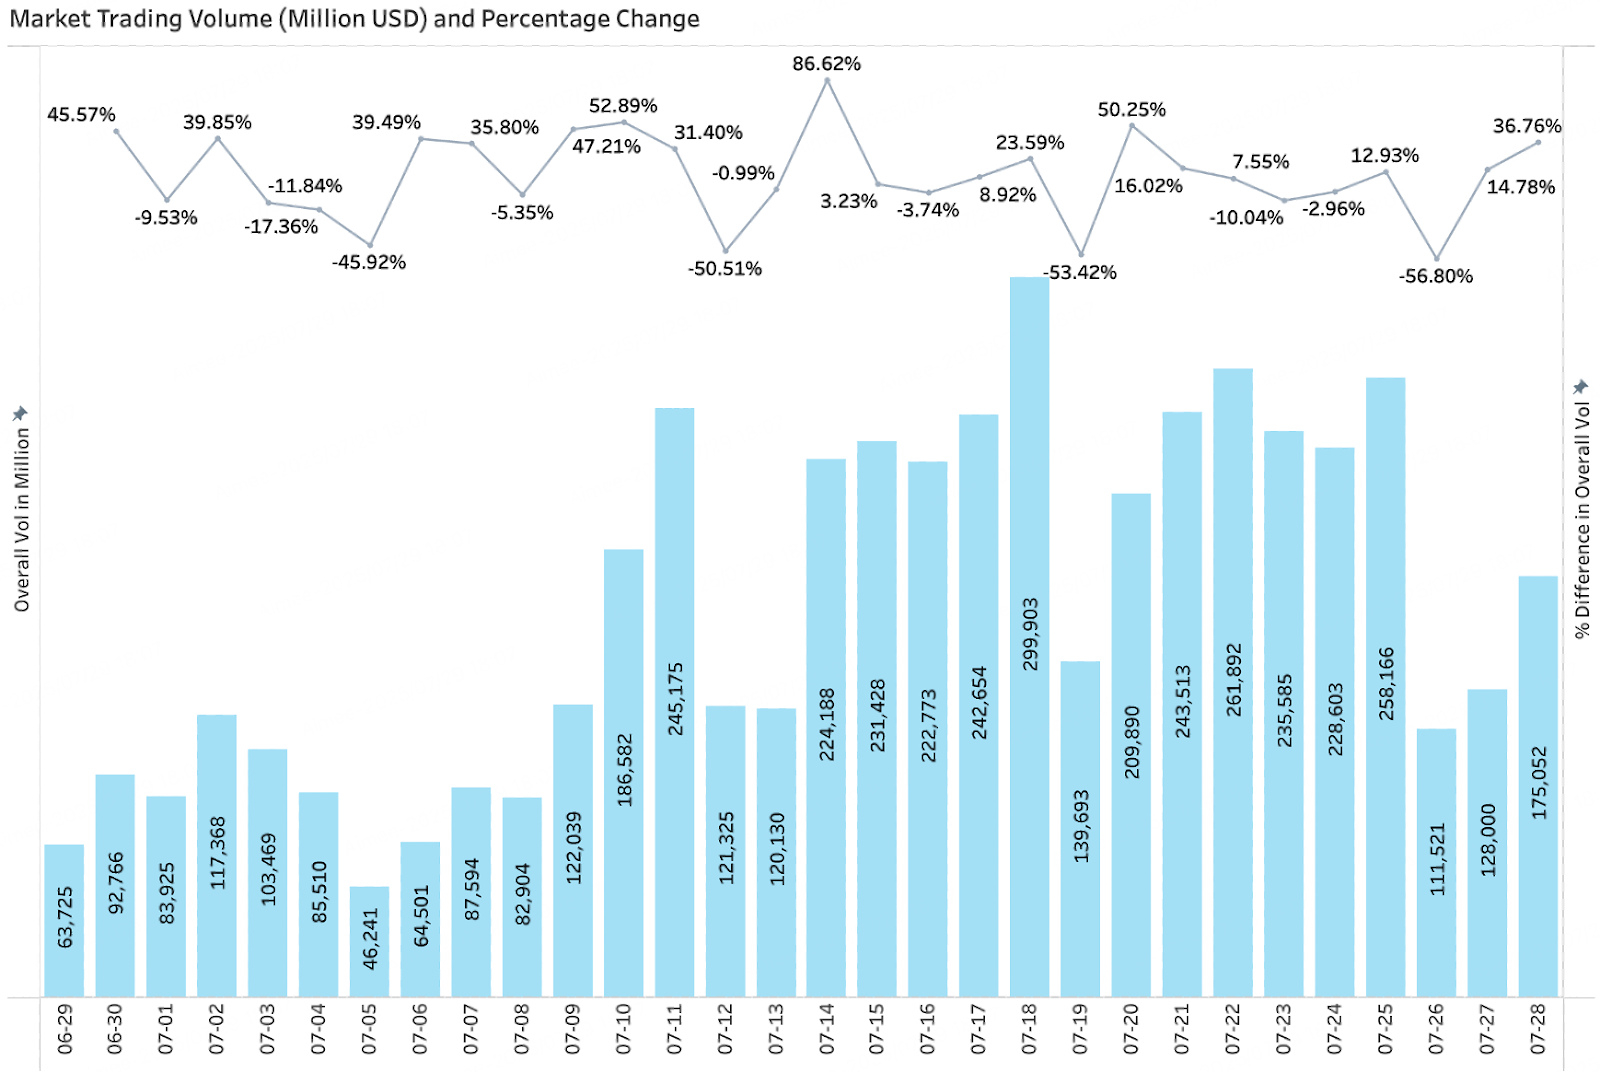
According to CoinGecko data, as of July 28, the overall trading volume in the cryptocurrency market showed a significant upward trend in July, with an average daily trading volume of approximately $161.2 billion, a 56% increase from the previous period. Market activity continued to rise, particularly during the periods of July 11-18 and July 21-25, when the market experienced two rounds of concentrated volume, with daily trading volumes repeatedly surpassing $200 billion, reflecting large-scale capital inflows and rapidly warming market sentiment. Overall, with BTC breaking historical highs and ETH leading strongly, the market is in a short-term upward cycle, with structural opportunities accelerating release and investors' risk appetite significantly increasing.
Total Market Capitalization & Daily Growth Amount
According to CoinGecko data, as of July 28, the total market capitalization of cryptocurrencies steadily rose to $3.94 trillion, a 16.2% increase from the previous month. BTC's market share was 60.6%, while ETH's market share rose to 11.8%, with the ETH/BTC exchange rate increasing to 0.32. In this round, ETH outperformed BTC, with funds gradually flowing from BTC to ETH and its ecosystem. The total market capitalization broke through $4 trillion on July 22, setting a new high, with a noticeable acceleration in market capitalization growth since July 11, reflecting sustained capital inflows and market confidence restoration driven by the rise of mainstream assets. With BTC repeatedly hitting new highs, ETH leading strongly, and hot sectors rotating, the expansion of the cryptocurrency market capitalization shows structural characteristics, indicating that the overall market is entering a new upward cycle.

Newly Launched Popular Tokens in July
Among the popular tokens launched in July, the hot tracks were mainly concentrated in infrastructure projects, with Layer 1 and Layer 2—Chainbase, ZKWASM, Caldera, ERA, etc.—being the most favored by the market. DeFi projects like Aspecta also gained some attention, showing the market's dual emphasis on underlying technology and decentralized financial ecosystems. Overall, investors showed strong interest in infrastructure projects that enhance blockchain performance and scalability, while DeFi applications remain an important growth driver. 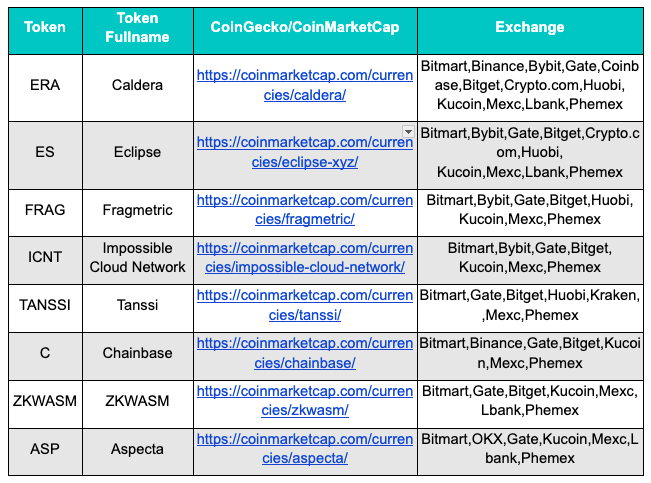
3. On-Chain Data Analysis
3.1 Analysis of BTC and ETH ETF Inflows and Outflows
July BTC Spot ETF Net Inflow of $20.15 Billion
Market sentiment continues to improve, with Bitcoin prices maintaining a steady upward trend. As of July 28, Bitcoin's opening price rose from $107,172 to $119,451, an increase of 11.46%. The inflow of funds into Bitcoin spot ETFs was strong, with a cumulative net inflow of $20.15 billion in July, expanding the total net asset size from $131.3 billion to $151.45 billion (an increase of 15.35%).
July ETH Spot ETF Net Inflow of $10.71 Billion
Ethereum performed even more impressively, with significant price increases. As of July 28, ETH's opening price surged from $2,486 to $3,874, with a monthly increase of 55.83%. The Ethereum spot ETF simultaneously attracted a large amount of capital, with a net inflow of $10.71 billion in July, raising the total net asset size from $9.95 billion to $20.66 billion (an increase of 107.64%), reflecting strong market confidence in the Ethereum ecosystem.

3.2 Analysis of Stablecoin Inflows and Outflows
In July, the total circulation of stablecoins surged by $9.617 billion, with USDE skyrocketing by 36.2% in a single month
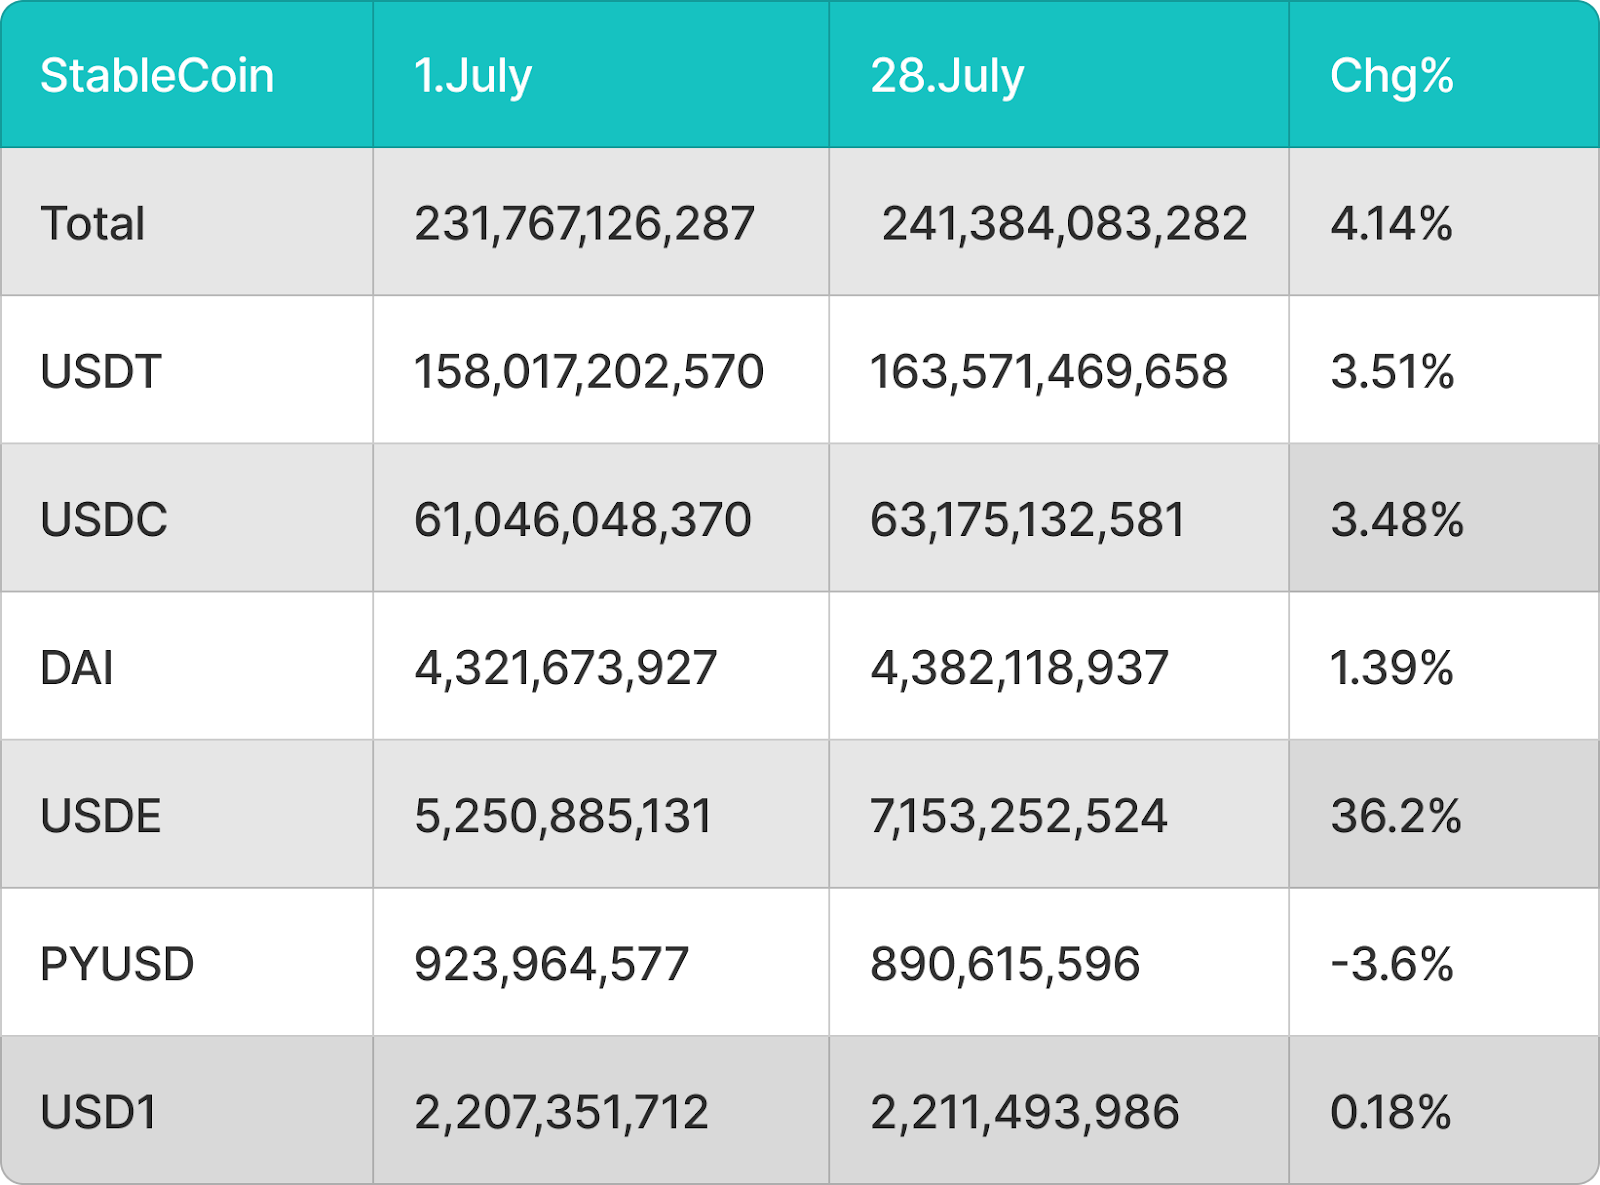
In July, driven by the passage of the stablecoin bill, the total circulation of stablecoins increased by $9.617 billion (+4.14%), reaching $241.38 billion. USDE led the market with an astonishing growth rate of 36.2% (an increase of $1.9 billion), while USDT (+$5.55 billion) and USDC (+$2.13 billion) contributed significantly to the overall increase.
4. Price Analysis of Major Currencies
4.1 BTC Price Change Analysis
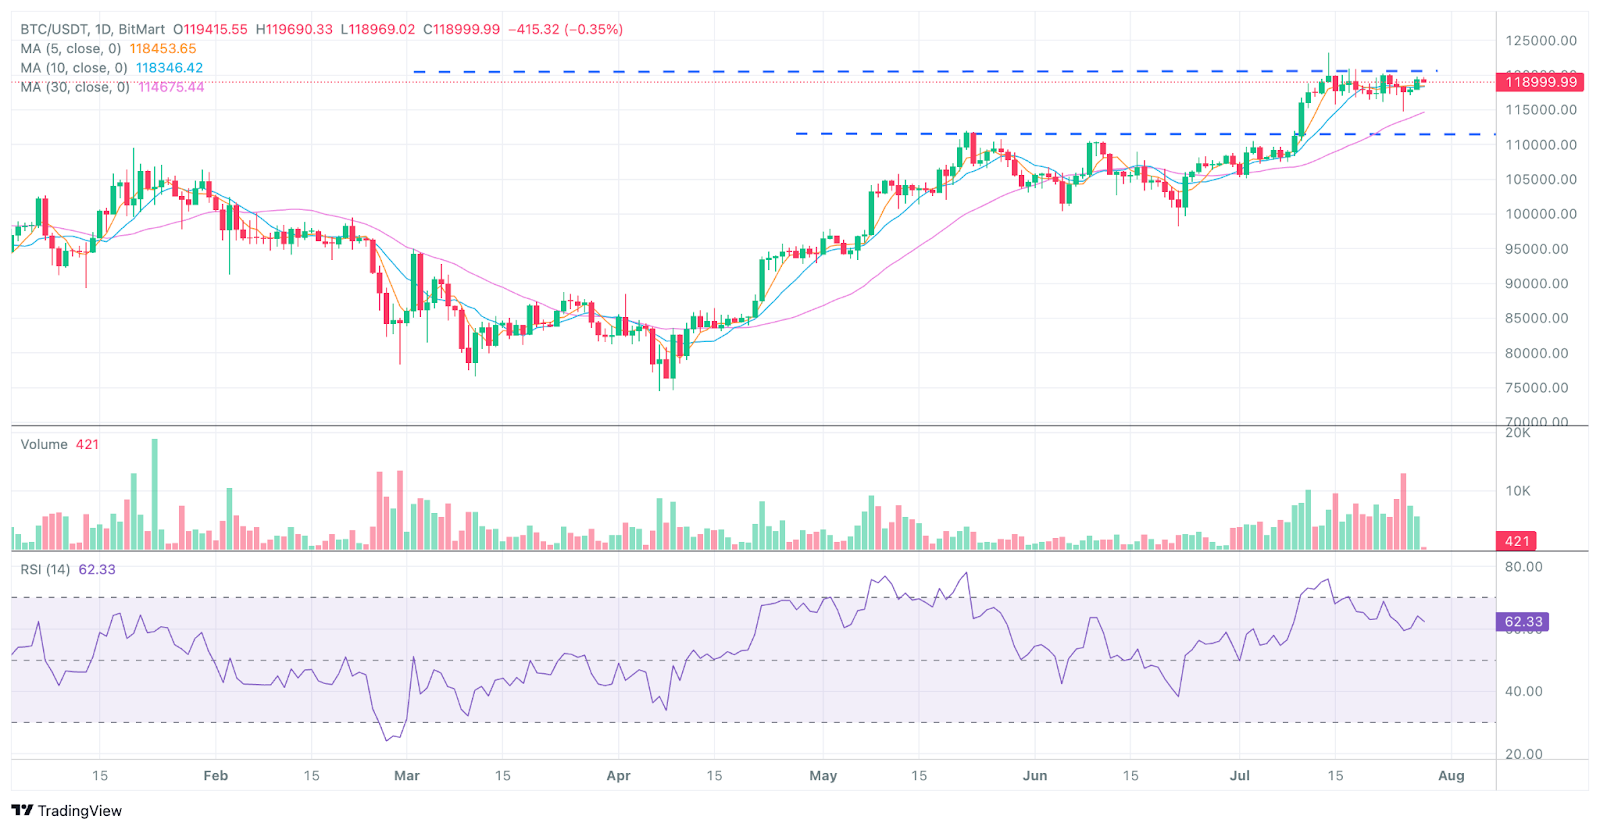
Since this week, BTC has repeatedly attempted to break the $120,000 resistance but has failed, particularly on July 23, when it briefly approached $120,113 before facing pressure and gradually retracing to around $114,759 (the low on July 25). Recently, the price has slightly rebounded to around $119,600, and although there is a short-term rebound, it still hovers below the 20-day moving average (around $116,300), indicating that the bears still possess some upward momentum.
Technically, BTC is currently attempting to build a bottom within the consolidation range of $110,530–$116,000. If the bulls can successfully halt the decline and rebound here, it will increase the likelihood of challenging $123,000 again, potentially opening a path towards $135,000. However, if it fails to hold above $110,530, it may trigger further declines towards the psychological level of $100,000. The recent two-day rebound has boosted confidence, but it has not broken through key resistance, so caution is still warranted.
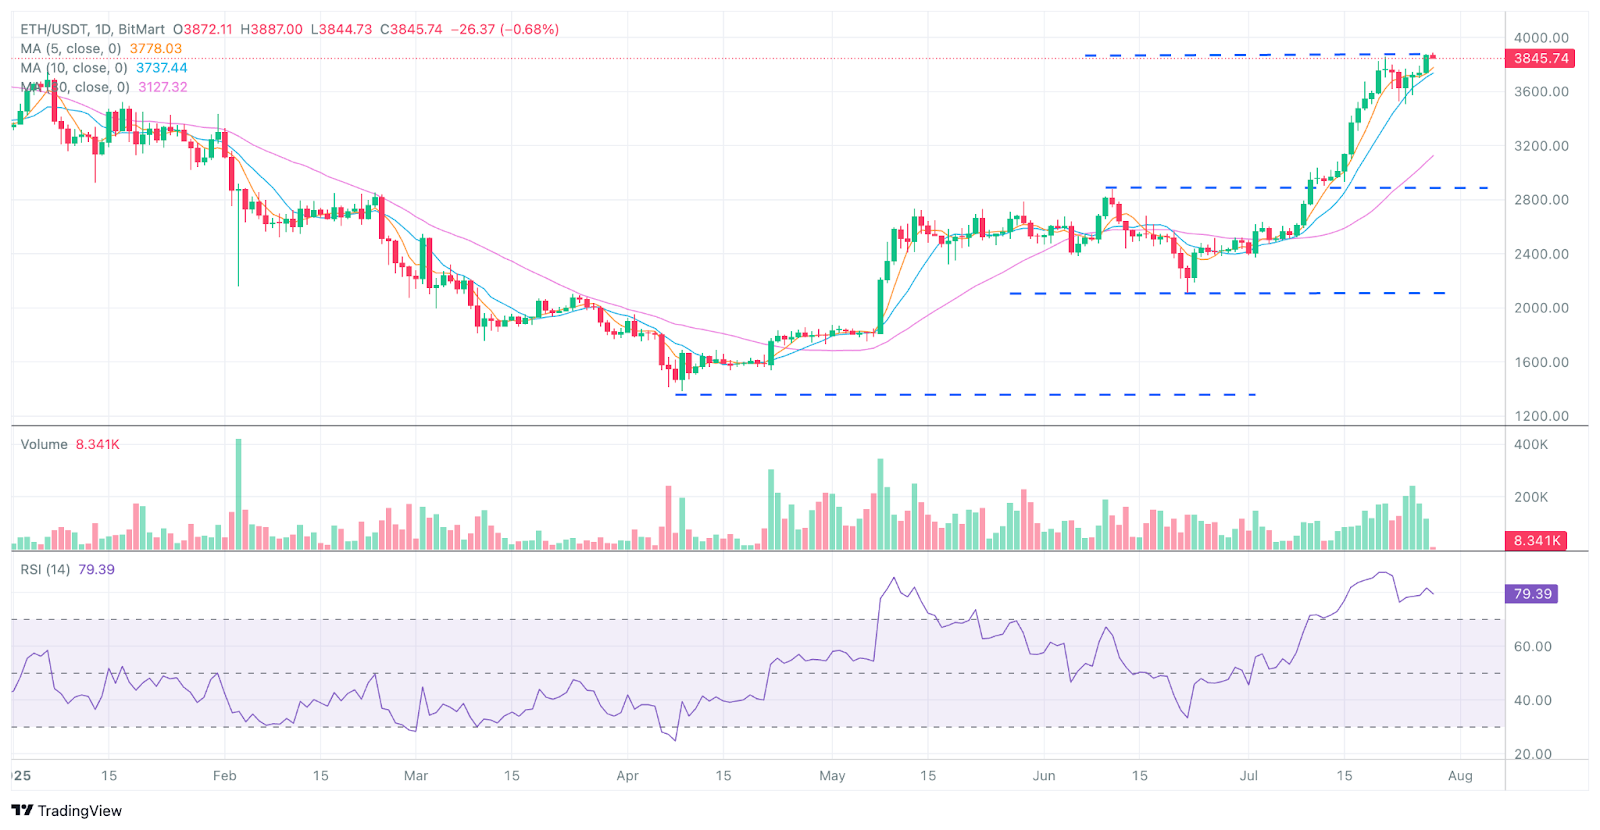
4.2 ETH Price Change Analysis
ETH has shown strong performance this week, with the price rising from around $3,740 to approximately $3,881 over the past two days, with daily gains close to 3–4%, significantly outpacing BTC and SOL. According to on-chain and ETF data, ETH spot ETFs attracted a total net inflow of about $2.4 billion over the past six trading days, far exceeding the $827 million for BTC ETFs during the same period, indicating that capital is clearly concentrating on Ethereum.
From a technical analysis perspective, ETH is at a critical juncture in its attempt to break the $3,745 resistance. If it can break through and stabilize at this level, it may subsequently challenge the $4,094 resistance, thereby opening an upward channel towards $4,868. However, if the price falls back and drops below $3,500 or the 20-day moving average (around $3,234), the upward momentum may weaken, and short-term adjustments could occur. The slight rebound over the past two days, if maintained, could be seen as a precursor to a breakout.
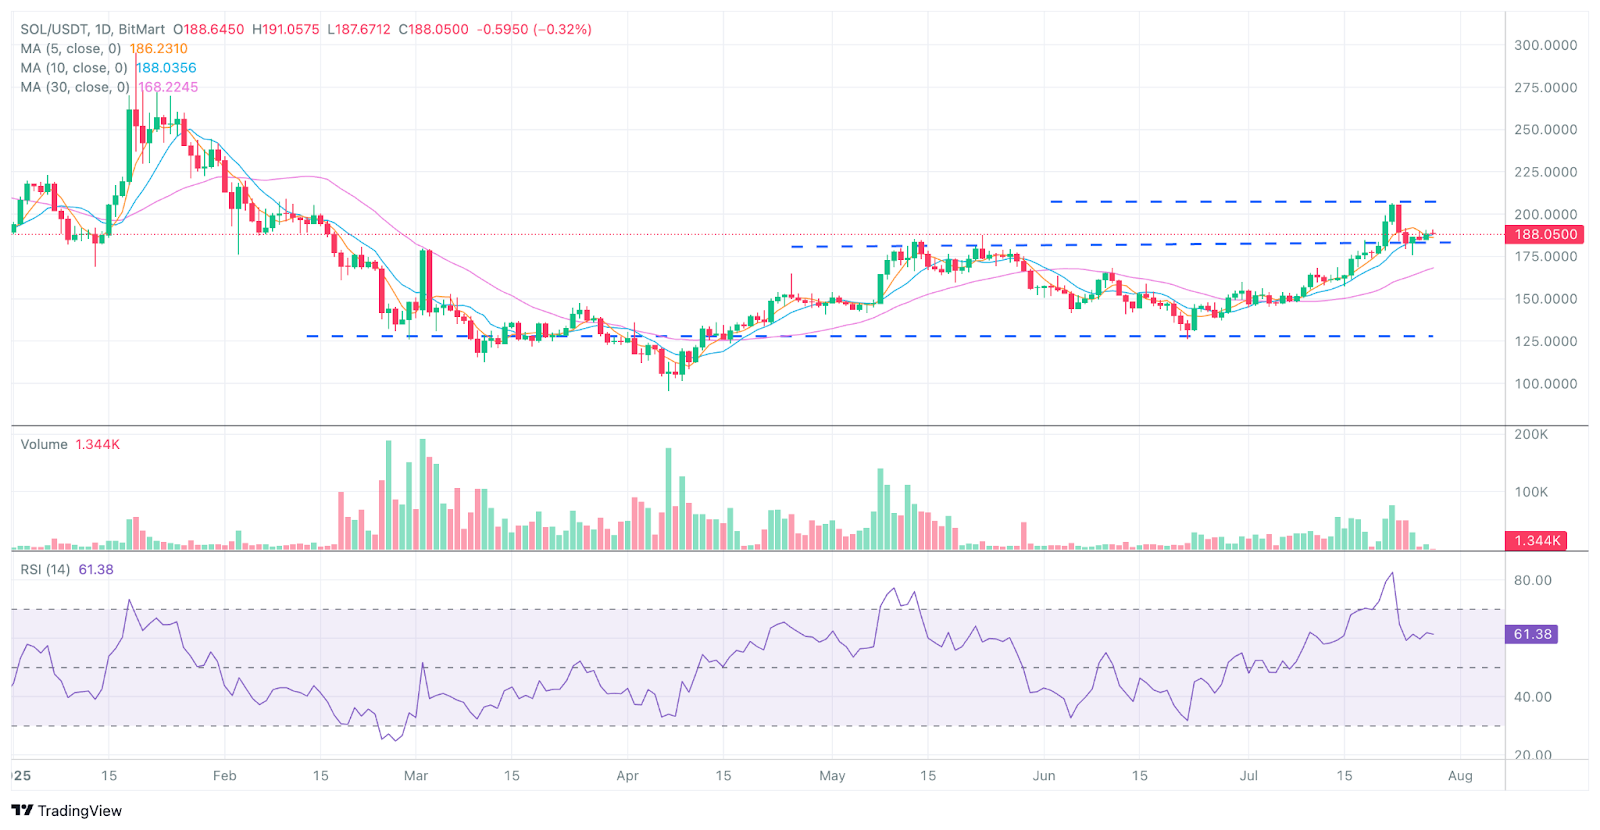
4.3 SOL Price Change Analysis
SOL has shown a weaker performance this week. After failing to break the key $200 resistance, the price quickly retreated and fell below the $185 support level, reaching a low of around $184. Currently, the price is hovering in the $190–$187 range, forming a typical inverse head and shoulders or cup and handle consolidation pattern on the chart. If it breaks through the $180–188 resistance zone, it may potentially reverse upwards, targeting around $220. However, if it falls below the short-term support of $176 (or near the 20-day moving average), it may accelerate the decline towards the $157 area.
Over the past two days, SOL has only shown a slight rebound, and its performance has clearly lagged behind ETH and BTC. Market enthusiasm is low, with new investor interest waning and long-term holders showing signs of reducing their positions. Overall, SOL is still in an adjustment pattern, with bulls not yet showing a clear return.
5. Hot Events of the Month
Ethereum Version of MicroStrategy Drives Price Increase
Recently, U.S. publicly listed companies such as SharpLink, Bitmine, Bit Digital, and BTCS have continued to increase their holdings in ETH and have established an "Ethereum version of MicroStrategy" through on-chain staking. As of July 21, 2025, SharpLink held approximately 358,000 ETH (valued at about $1.278 billion), Bitmine held 300,700 ETH, and Bit Digital and BTCS held 120,300 and 31,900 ETH, respectively. SharpLink has surpassed the Ethereum Foundation to become the largest institutional holder globally, while Bitmine, driven by Wall Street capital such as ARK Invest, plans to increase its ETH allocation to 5%, further strengthening ETH's market positioning as an "enterprise-grade asset."
With the rebound in ETH prices and continued net inflows into ETFs, ETH is undergoing a transformation from a retail-driven technical asset to an institutionally dominated reserve asset. The current institutional holding pattern presents a "dual center": SharpLink represents the native crypto camp, while Bitmine represents the traditional capital path, pushing ETH into a new narrative cycle of "staking + reserve + governance." The overall trend indicates that ETH is entering a phase of institutional re-evaluation driven by ETFs, publicly listed companies, and on-chain nodes.
U.S. Stablecoin Bill Passed
On July 17, 2025, the U.S. House of Representatives passed the GENIUS Act with a vote of 308 to 122, which was signed into law by the President the following day, marking the official birth of the first federal regulation in U.S. history targeting dollar-pegged stablecoins. The law establishes the issuance qualifications for "Permitted Payment Stablecoin Issuers" and requires that issuers must have a federally or state-approved bank or trust identity, maintain reserves in cash or short-term U.S. Treasury securities, disclose daily to the public, prohibit collateral reuse, not provide interest returns, and be subject to oversight by the Treasury Department, the Office of the Comptroller of the Currency (OCC), and the Bank Secrecy Act, among other stringent requirements. The bill also excludes stablecoins from securities and commodities laws, clearly removing them from SEC/CFTC jurisdiction and placing them entirely under the supervision of banking regulators.
Shortly after the signing, the cryptocurrency market saw a significant rebound: major crypto assets such as Bitcoin and Ethereum surged, with Ethereum rising by about 50% during July, while Bitcoin's price increased by 10.27%. Stablecoin inflows reached $9.617 billion, and at the financial institution level, payment giants like JPMorgan, Mastercard, and Visa accelerated the issuance of stablecoins or explored on-chain payment solutions. Traditional banks and online platforms (such as Circle, Coinbase, PayPal, Amazon, and Walmart) also quickly followed suit, integrating stablecoins into payment, cross-border settlement, and corporate cash management services, thereby pushing stablecoin applications into the mainstream financial services market.
First Solana Staking ETF Listed in the U.S.
In July, the U.S. welcomed its historic first ETF allowing the staking of cryptocurrencies—the REX-Osprey Sol + Staking ETF (abbreviated as SSK). This fund has received regulatory approval and was officially listed on the Cboe BZX exchange earlier this month. The ETF's most notable feature is its embedded "staking" mechanism: a portion of the SOL assets held by the fund will participate in the validation activities of the Solana network through on-chain staking, earning an annualized staking reward of about 7%, which will be distributed to investors in cash dividends periodically, similar to the "fixed deposit + dividends" model in traditional finance. Approximately 60% of the SOL assets held by the fund participate in on-chain staking, with an annualized yield of about 7%, distributed in cash, while the remaining 40% is invested in overseas Solana ETP products, thereby circumventing the 19b-4 process and obtaining listing approval solely through S-1 registration. This "staking + dividend" structure distinguishes SSK from ETFs that only track SOL futures, and the market views it as a landmark achievement following the Trump administration's relaxation of crypto regulations.
As a result of this news, SOL briefly surged by 6% in early July. Currently, institutions such as Grayscale, VanEck, and Bitwise have also submitted S-1 application documents for Solana Spot ETFs, with expectations to submit revised versions by the end of July. The SEC is likely to complete its review ahead of schedule in mid to late August (with the latest review deadline set for October 10). Additionally, spot staking ETFs, including those for Ethereum, are also expected to follow suit and be listed soon.
6. Outlook for Next Month
CLARITY Act
The highly anticipated Digital Asset Market Clarity Act (CLARITY Act) has successfully passed the U.S. House of Representatives and has officially entered the Senate review stage in late July, marking a key step in U.S. cryptocurrency regulatory legislation. The bill aims to clarify the classification standards and regulatory boundaries for crypto assets, delineating the responsibilities of the SEC and CFTC for the first time, and providing a clear compliance path for decentralized projects, stablecoins, DeFi protocols, and more. If the bill passes smoothly, it will bring three major positive impacts:
- Enhance regulatory certainty, encouraging projects and exchanges to operate in compliance and boosting institutional confidence;
- Grant the CFTC greater regulatory authority, diminishing the SEC's regulatory power, which may end years of regulatory disputes;
- Confirm the legal status of DeFi and self-custody, reducing the compliance burden on developers and clearing obstacles for decentralized innovation.
In anticipation of favorable policy, several DeFi blue-chip projects and exchange-related assets have rebounded since mid-July. If the Senate review proceeds smoothly in August and maintains support for the DeFi exemptions and "mature chain" provisions from the House version, the CLARITY Act is expected to become an important turning point for promoting a new round of compliance and capital inflow in the U.S. cryptocurrency market.
Review of SOL Spot ETF and Ethereum Staking ETF
The advancement of Solana spot ETFs is accelerating, with seven institutions including Grayscale, VanEck, Fidelity, and Franklin submitting S-1 registration statements to the SEC in mid-June. The documents generally cover the staking mechanism and redemption process design. The SEC has requested that applicants submit revised versions by July 31 to clarify specific operational details. According to regulatory provisions, the latest approval deadline for such ETFs by the SEC is October 10, 2025, but if applicants submit supplementary documents on time, the market generally expects the SEC to make a decision as early as mid to late August. If approved, Solana will become the third mainstream crypto asset to receive spot ETF support, following Bitcoin and Ethereum.
Regarding Ethereum staking ETFs, BlackRock submitted a revised 19b-4 document on July 16, proposing to partially or fully stake ETH holdings through a trusted staking service provider to earn additional returns. Grayscale submitted an application to add staking functionality to its ETH trust product earlier this year, but as of June, it was still under review, with the approval potentially delayed until October. The SEC released its first regulatory guidelines for crypto ETFs on July 7, clearly stating that standardized regulatory processes will be implemented for staking, custody, and revenue distribution, and is considering introducing a unified reporting template to shorten the approval cycle to 75 days. Currently, if the overall process proceeds smoothly, the first batch of ETH staking ETFs is expected to be approved as early as the fourth quarter of 2025.
免责声明:本文章仅代表作者个人观点,不代表本平台的立场和观点。本文章仅供信息分享,不构成对任何人的任何投资建议。用户与作者之间的任何争议,与本平台无关。如网页中刊载的文章或图片涉及侵权,请提供相关的权利证明和身份证明发送邮件到support@aicoin.com,本平台相关工作人员将会进行核查。


