Written by: Glassnode
Translated by: Glendon, Techub News
Key Points
Bitcoin's realized market cap has surpassed the $1 trillion mark for the first time. This is a truly milestone figure for Bitcoin, highlighting its deep liquidity characteristics and its increasingly significant influence on a macro level.
Over the past week, all altcoin sectors have outperformed Bitcoin, with Ethereum's performance being particularly notable. This has led to a $216 billion increase in the market cap of altcoins over the past two weeks.
In July, the open interest of mainstream altcoins surged from $26 billion to $44 billion. The rise in leverage often amplifies both upward and downward volatility in the market, potentially leading to a more reflexive and fragile market environment.
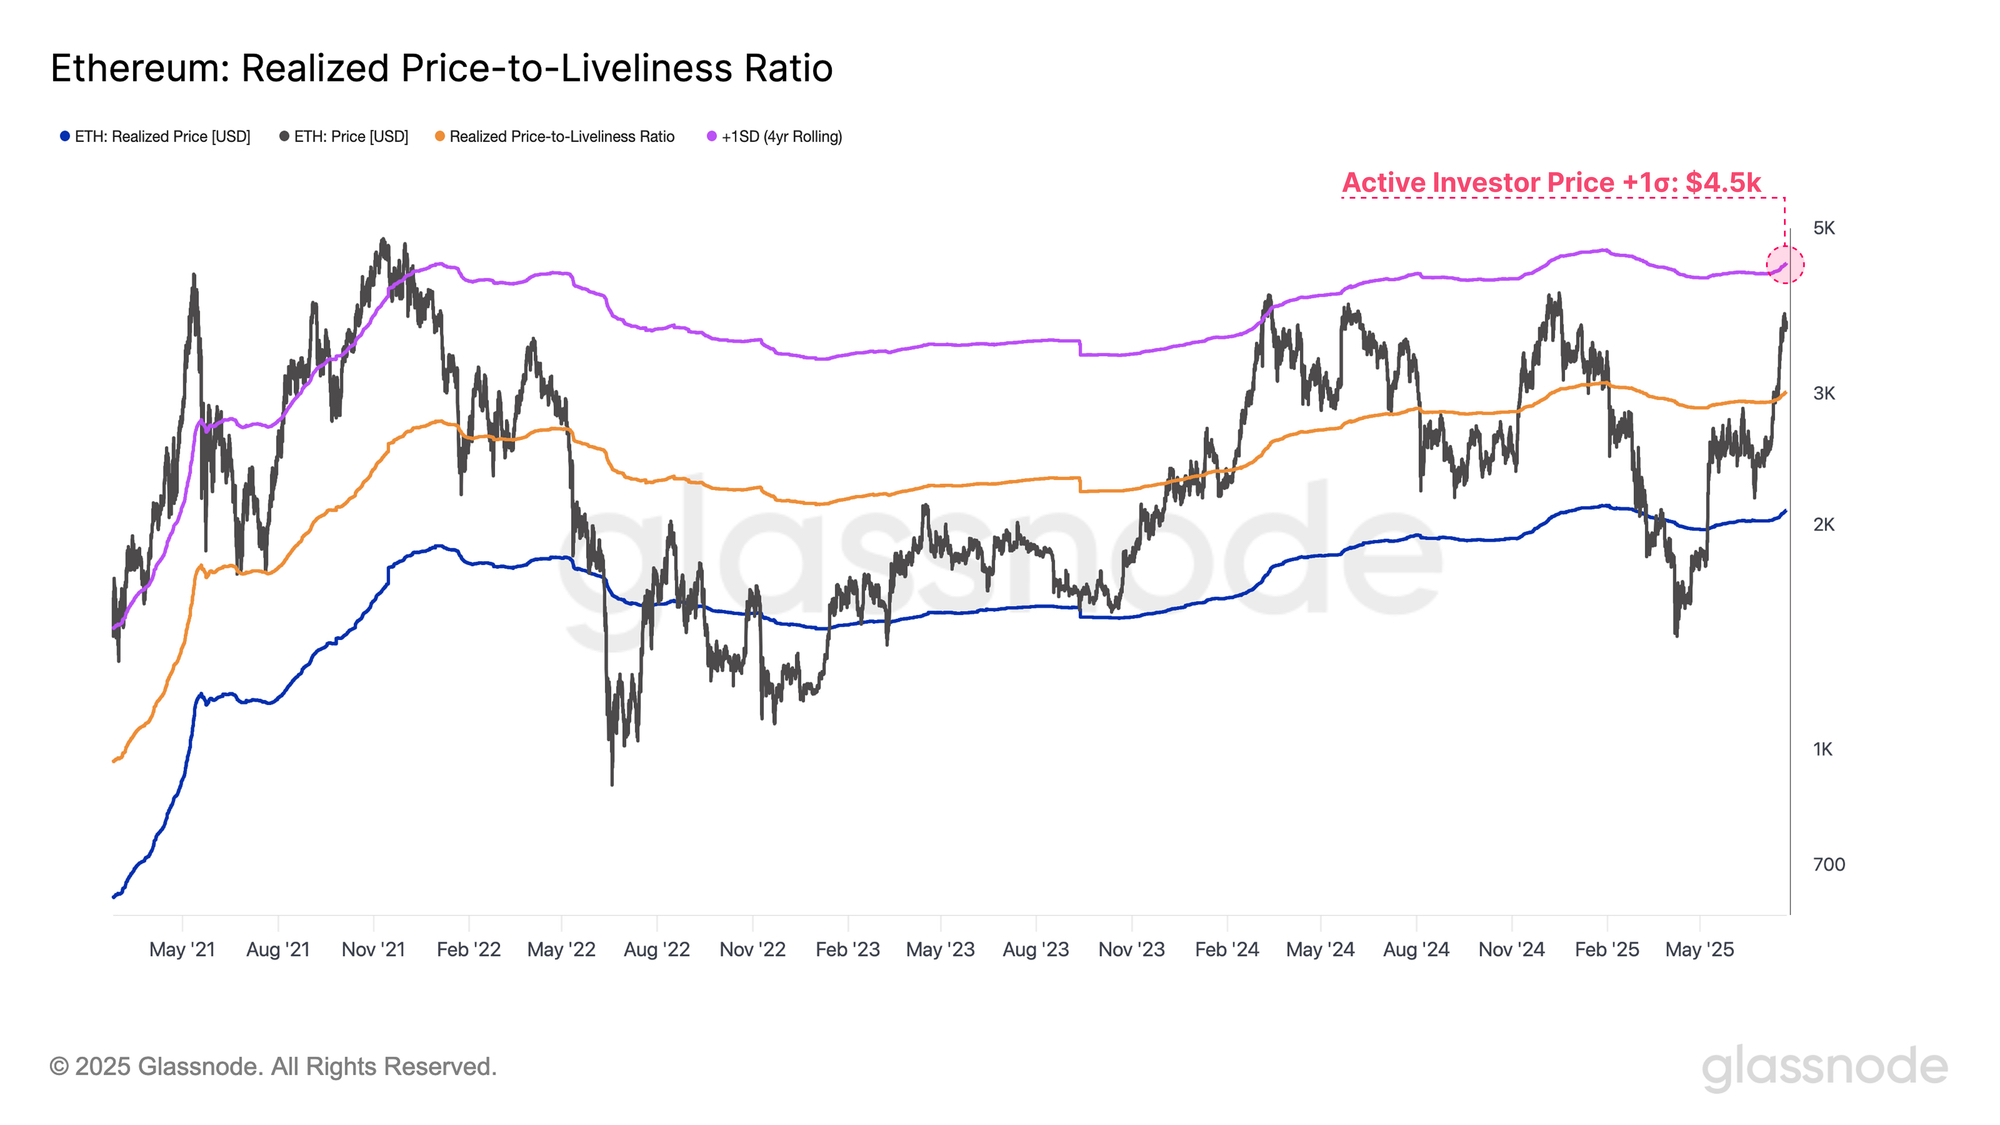
Ethereum has decisively broken through several key on-chain resistance levels, including the Active Investor Price and the True Market Mean. However, it is expected to face significant selling pressure in the $4,500 region.
"The Era of Trillions" Arrives
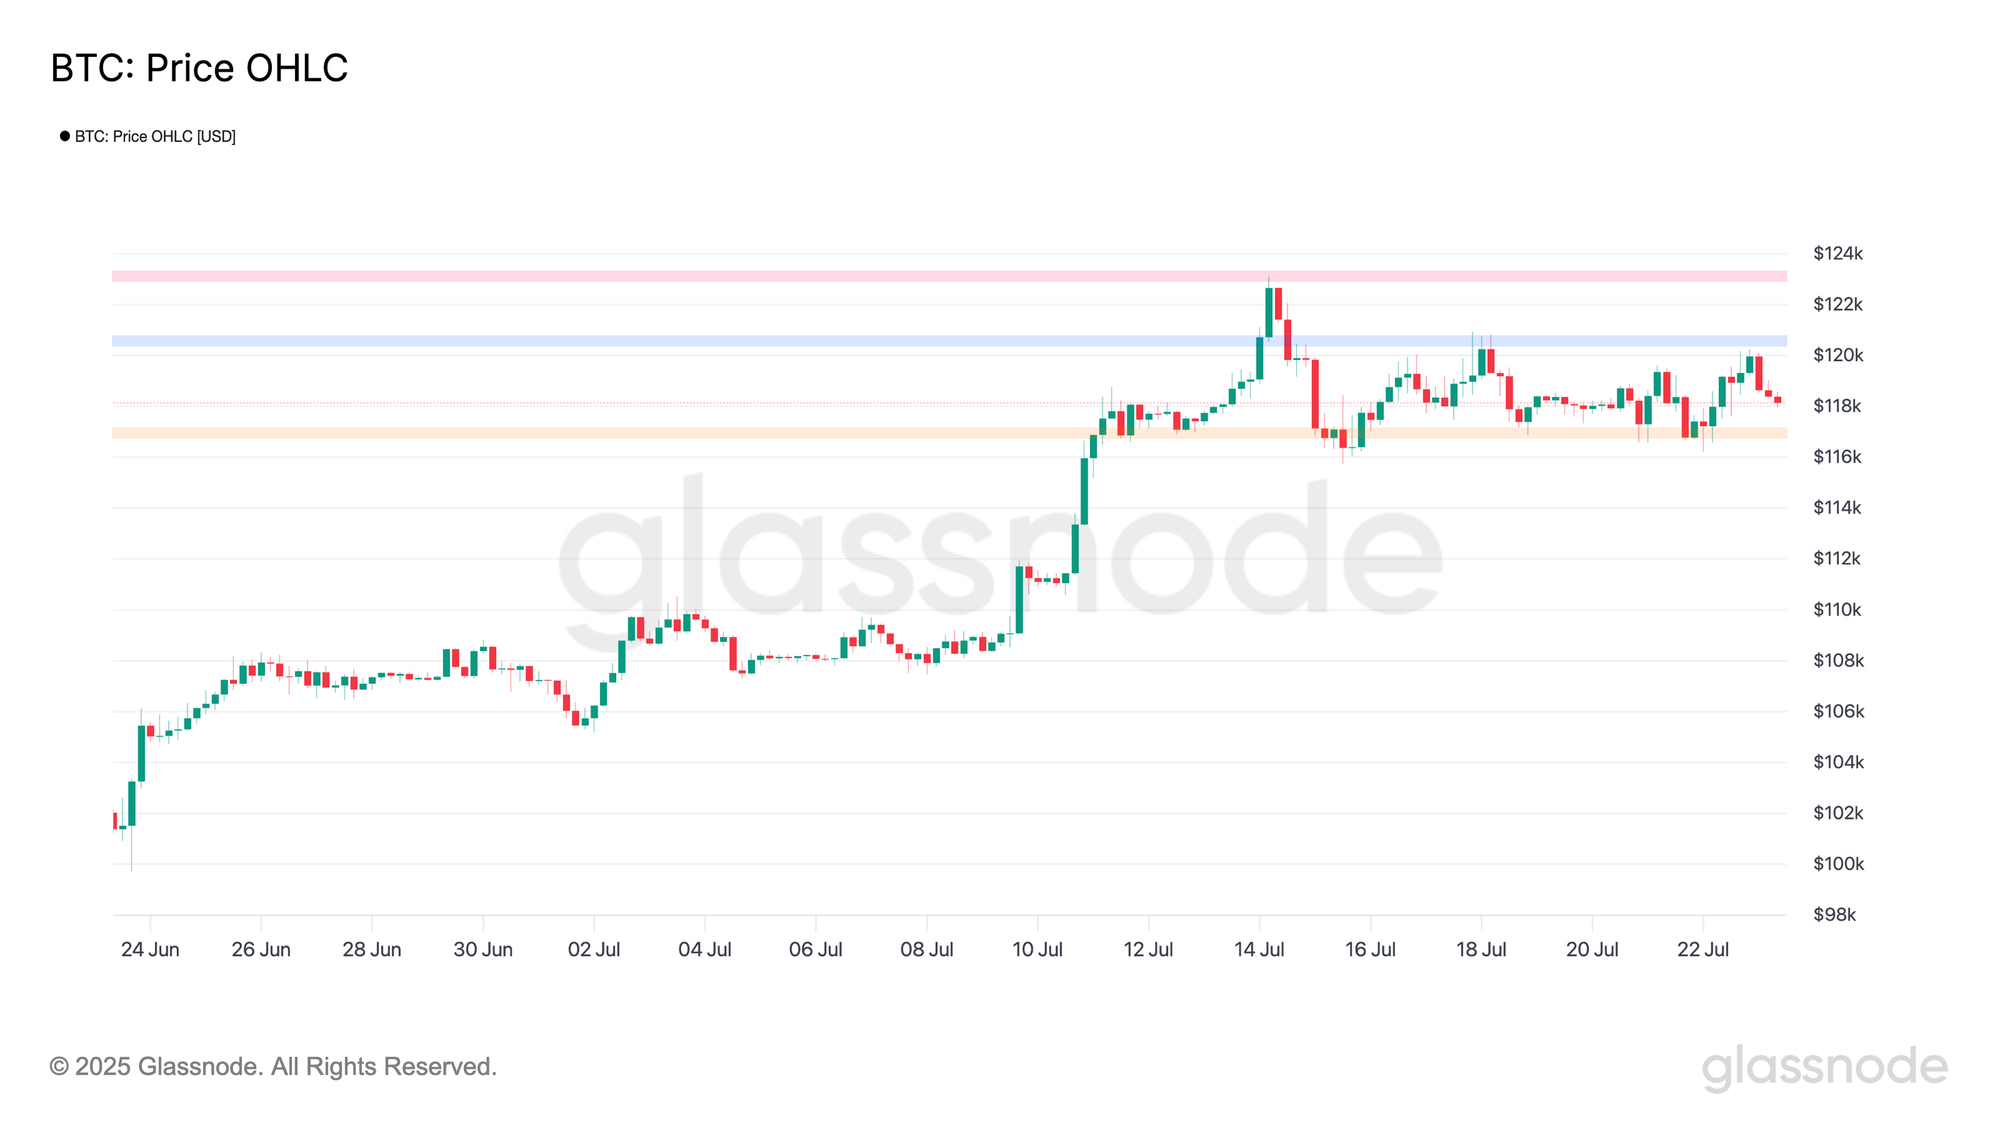
July has been an explosive growth month for Bitcoin, with prices soaring from a weekly low of $105,400 to an all-time high of $122,700, accompanied by significant volatility. However, as the weekend approached, short-term momentum weakened, and Bitcoin's price has remained below its historical high, showing a consolidating trend.
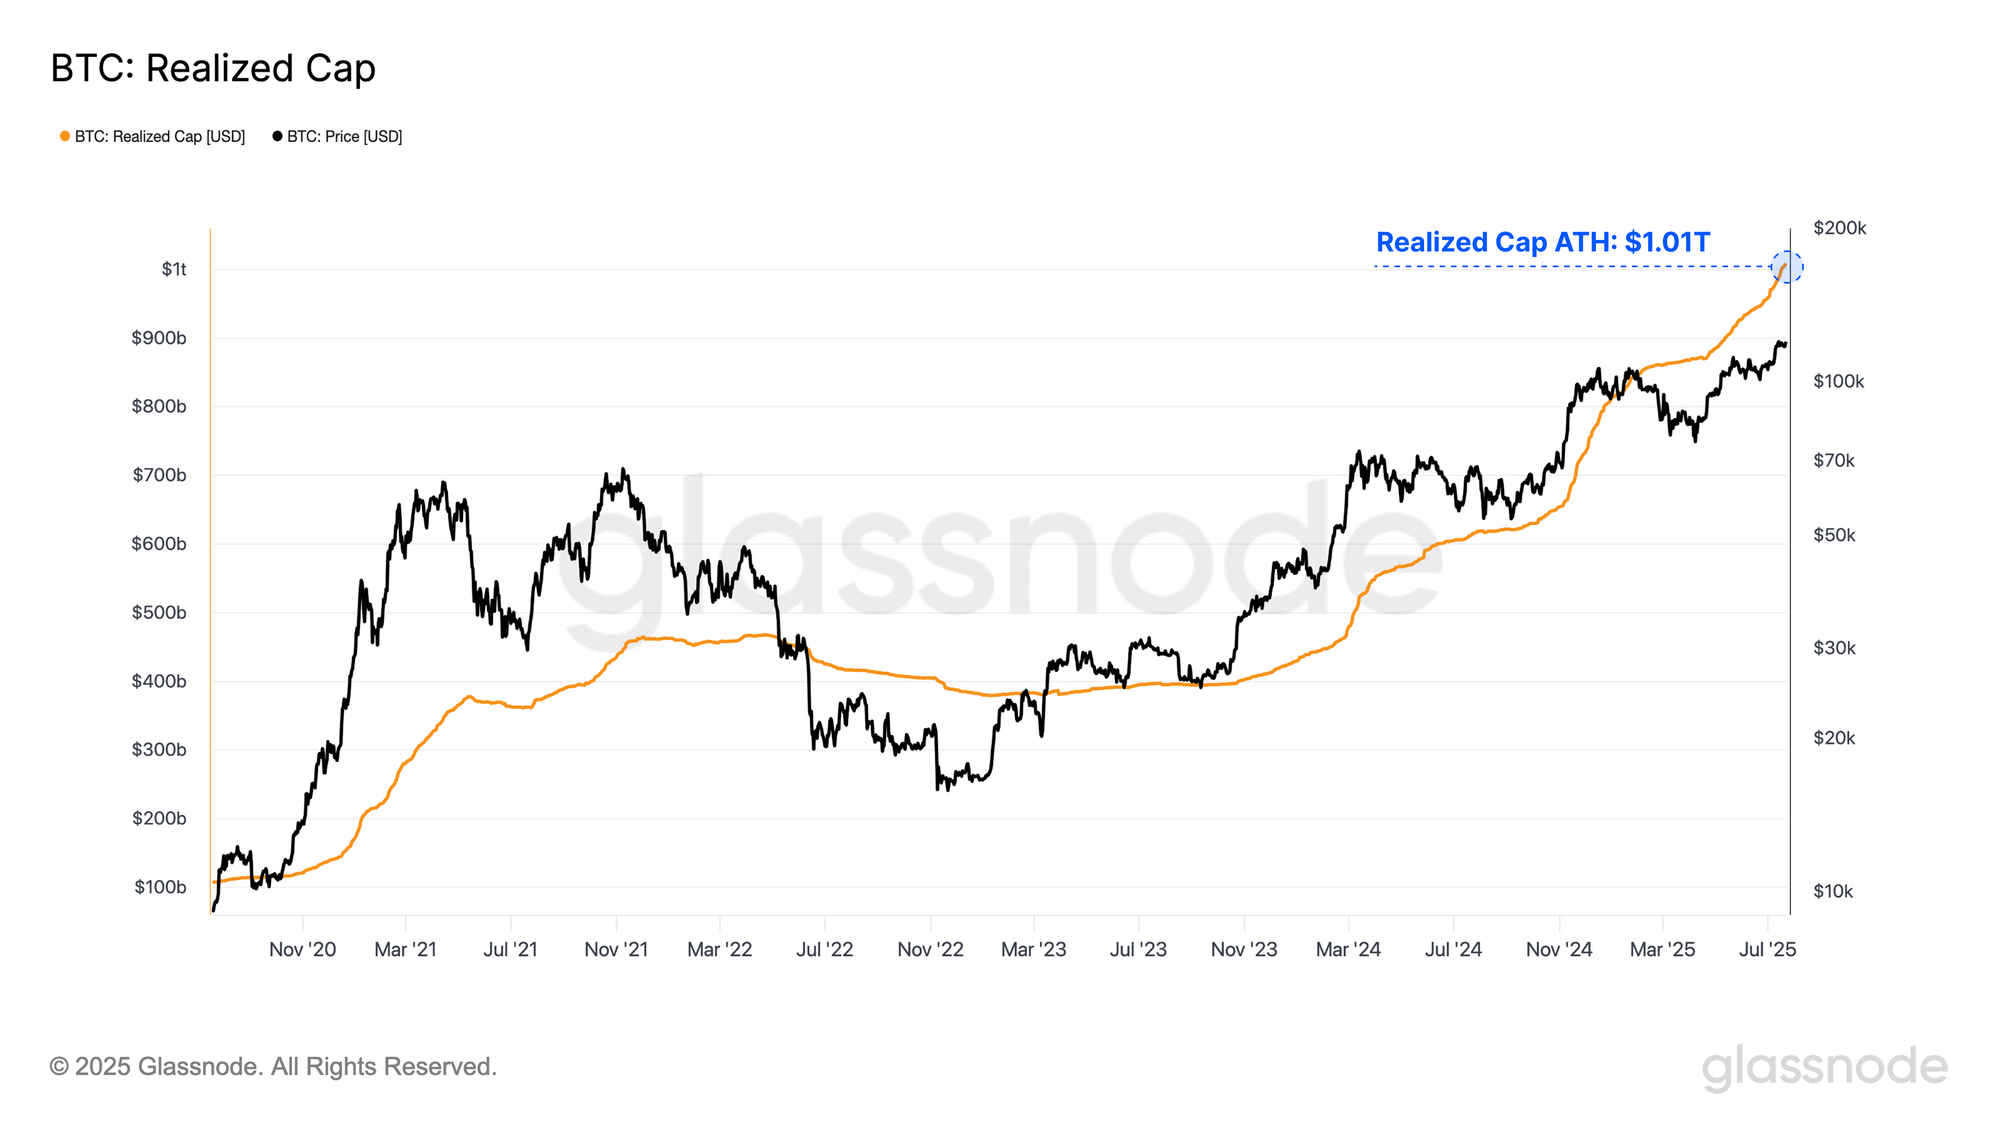
The substantial rise in Bitcoin's price prompted existing holders to take profits, while also attracting new buyers. This flow of funds can be quantified through the Realized Cap metric, which measures the scale of accumulated dollar liquidity in the asset.
Recent capital inflows have pushed Bitcoin's realized market cap to surpass the $1 trillion mark for the first time. This is a truly milestone figure for Bitcoin. The larger Bitcoin's scale, the greater the volume of capital stored, and the scale of funds settled through trading will also expand accordingly.
Speculation in Altcoins Heats Up
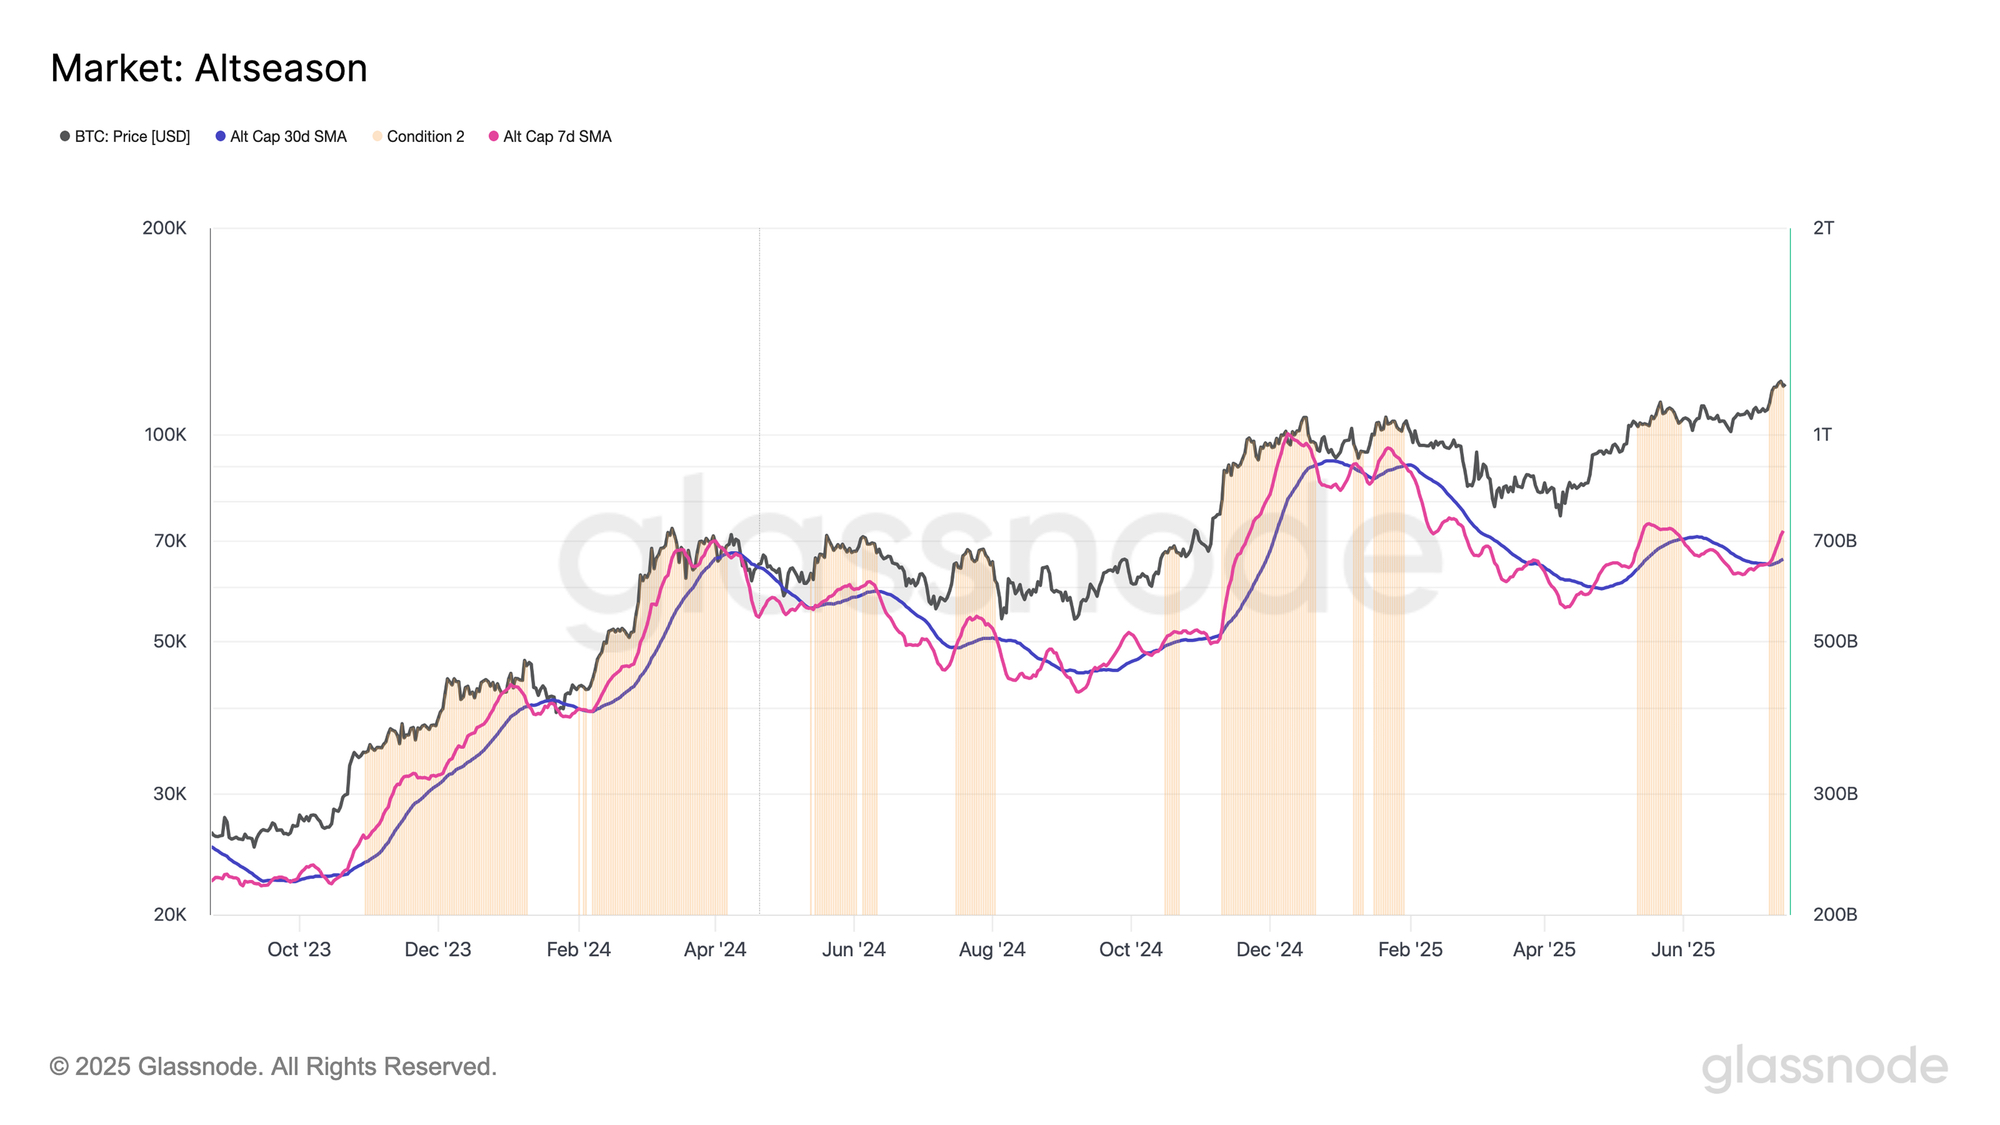
As Bitcoin's market cap continues to grow, this article will focus on how the broader digital asset ecosystem responds to this performance. To assess this, the article employs the Altseason indicator, which signals positive conditions when the following criteria are met:
Both Bitcoin and Ethereum are continuously absorbing on-chain capital inflows;
The supply of stablecoins is increasing, indicating a rise in off-exchange "dry powder" reserves; (Note: "dry powder" in finance refers to unutilized cash reserves held by investment institutions or funds, i.e., the "ammunition" of capital markets.)
The market cap of altcoins shows an upward trend through the crossover of fast/slow moving averages.
This framework aims to capture the dynamics of capital rotation on the risk curve. When Bitcoin and Ethereum attract capital inflows while stablecoin liquidity grows, the conditions for capital rotation towards high-risk altcoins become more mature. If this environment shows momentum crossover with the total market cap of altcoins, it indicates that funds are actively flowing into the altcoin space, driving its valuation expansion.
According to this indicator, the "Altseason" conditions first appeared on July 9 and have continued to this day, indicating that the entire cryptocurrency space is undergoing a sustained capital redistribution.
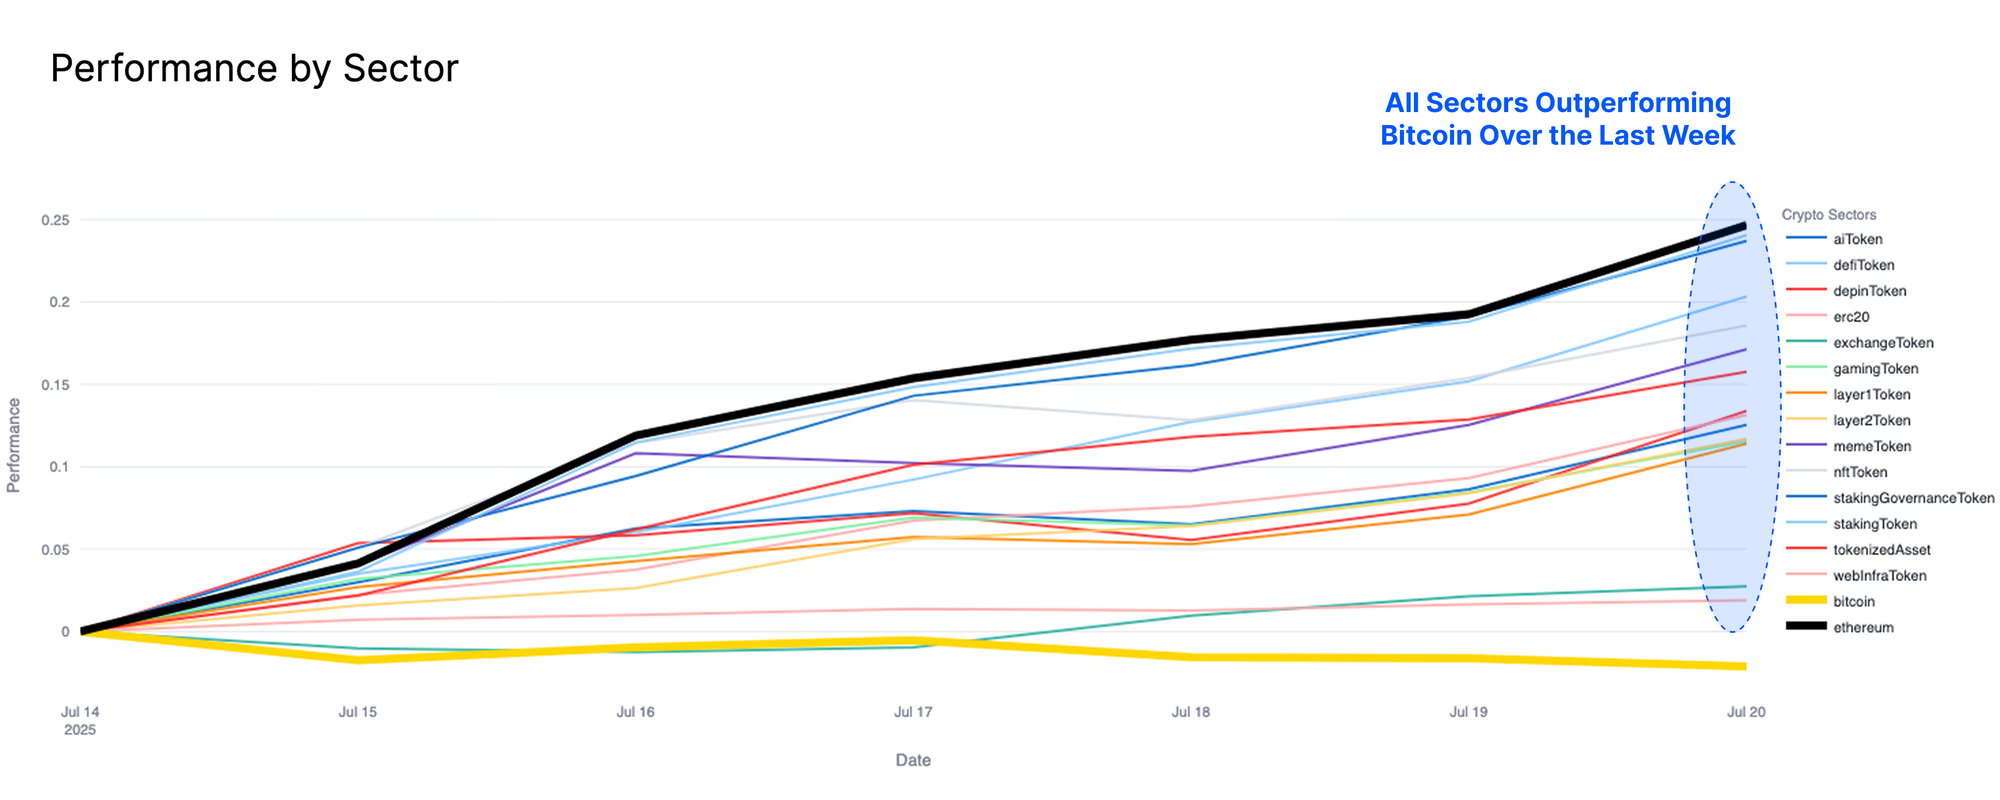
The above conclusions can be validated by analyzing the performance of various sectors within the digital asset ecosystem over the past week. Bitcoin's recent consolidation trend is evident, with price fluctuations remaining relatively flat over the past week; in contrast, all other digital asset sectors have outperformed Bitcoin, with Ethereum leading once again. This phenomenon is a typical case of capital rotation along the risk curve.
However, given Bitcoin's dominant position in the ecosystem (with a market share exceeding 64%), any sustained weakness it exhibits could pose resistance to the altcoin market, thereby suppressing the overall upward momentum of altcoins in this cycle.
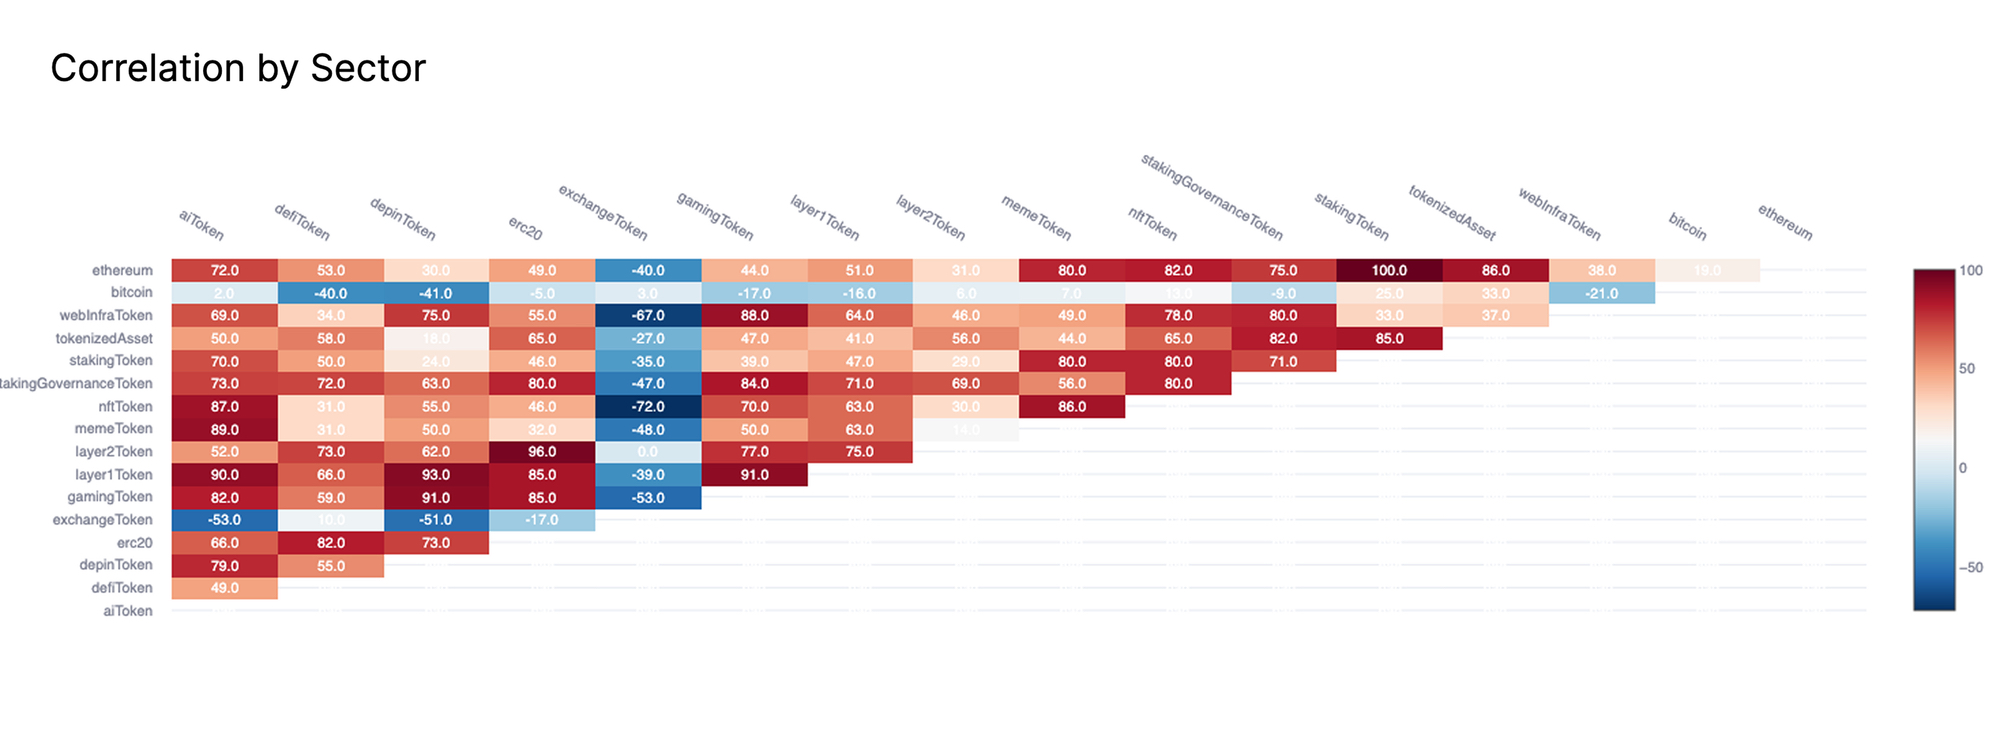
From the perspective of sector correlation, this trend is further reinforced. Almost all altcoin sectors are currently exhibiting highly synchronized volatility, reflecting a broad-based market rally that is largely unaffected by the fundamentals of any specific asset.
Meanwhile, the correlation between altcoin sectors and Bitcoin has significantly decreased, highlighting the increasing divergence in their price behaviors and confirming the orthogonal relationship between Bitcoin and the broader altcoin ecosystem's recent price trends.
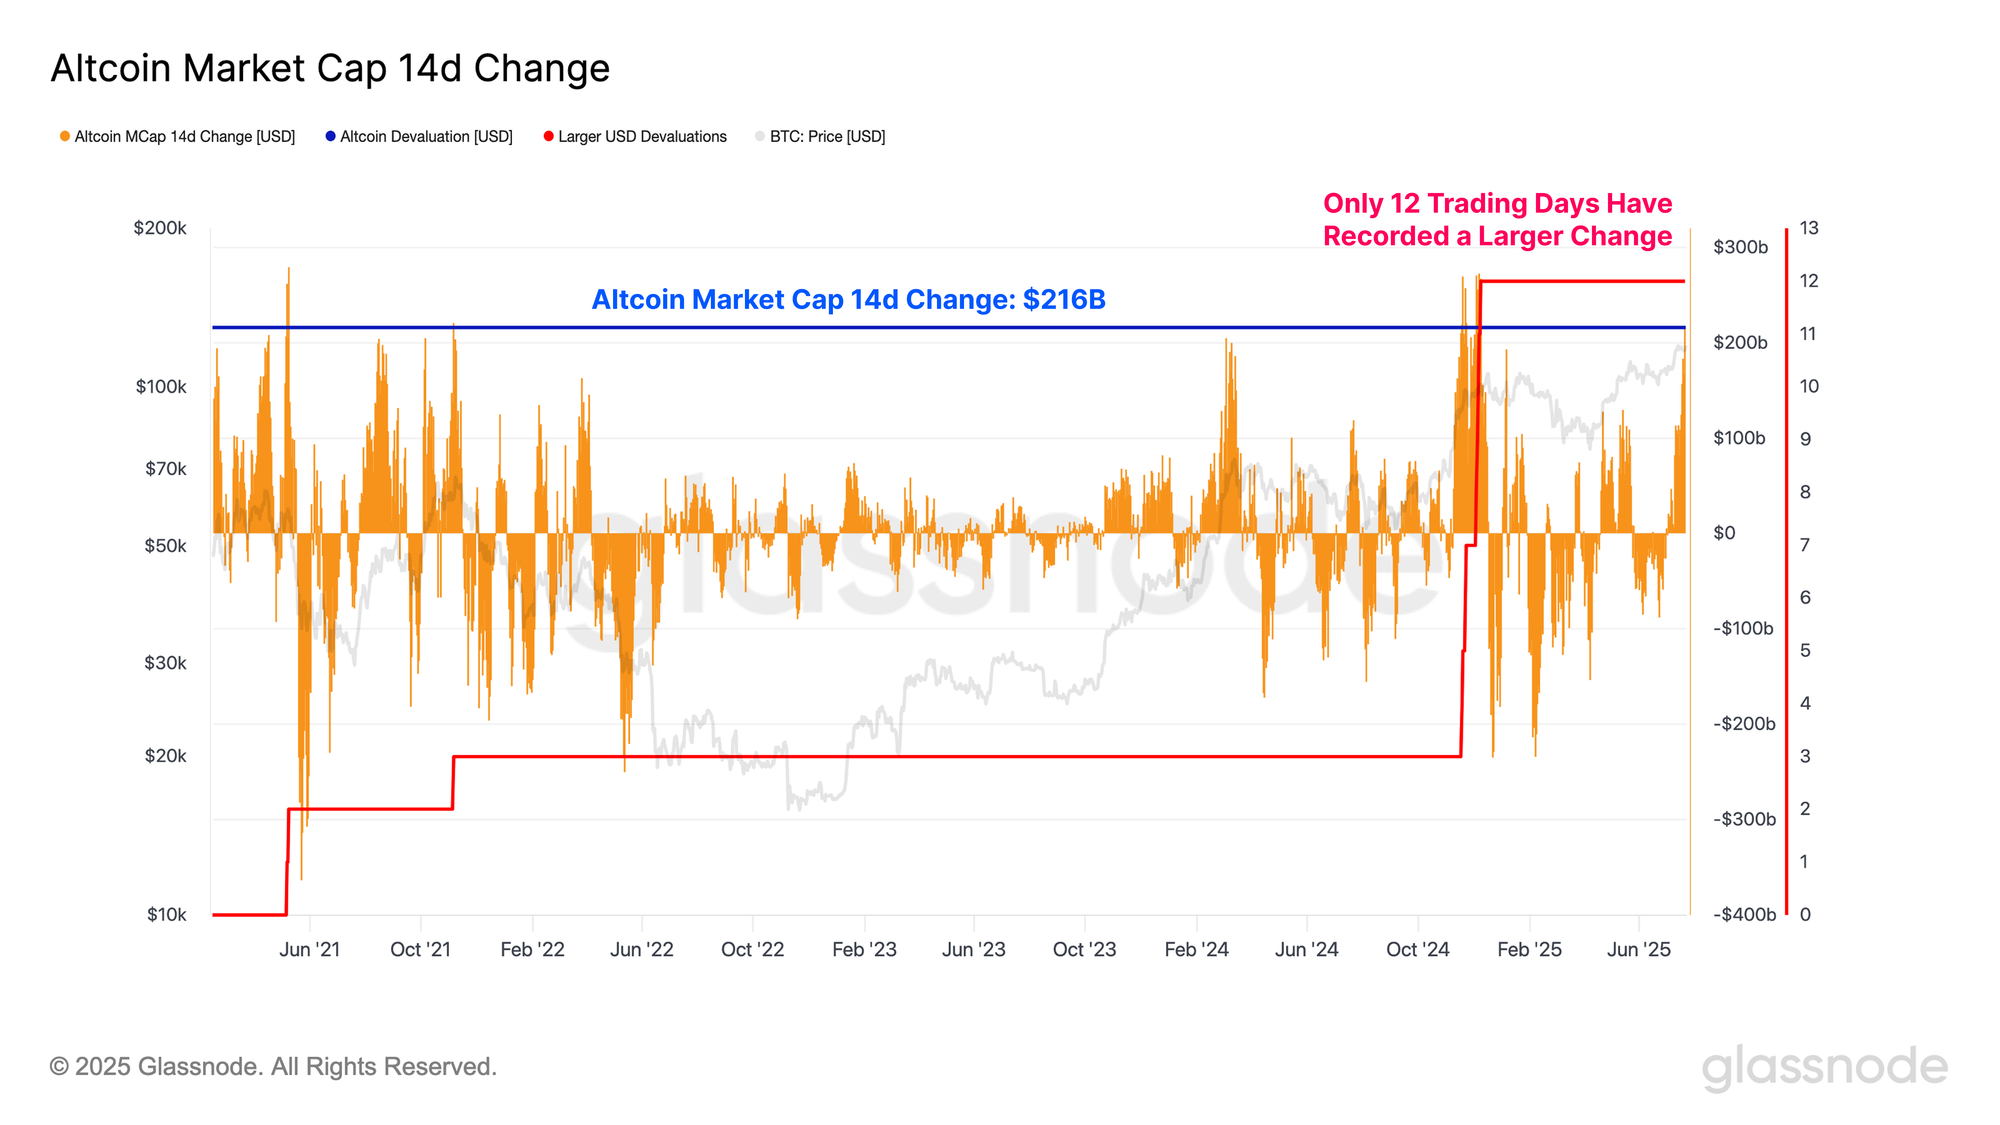
The recent increase in the total market cap of altcoins has been remarkable, with a $216 billion growth over the past two weeks. This is one of the largest single increases in the total market cap of altcoins measured in dollars, further corroborating that funds are flowing into the altcoin space on a large scale.
Explosive Growth in the Derivatives Market
Having established that the altcoin market is experiencing significant growth, it is now necessary to analyze the altcoin derivatives market to further assess the current risk appetite of market participants.
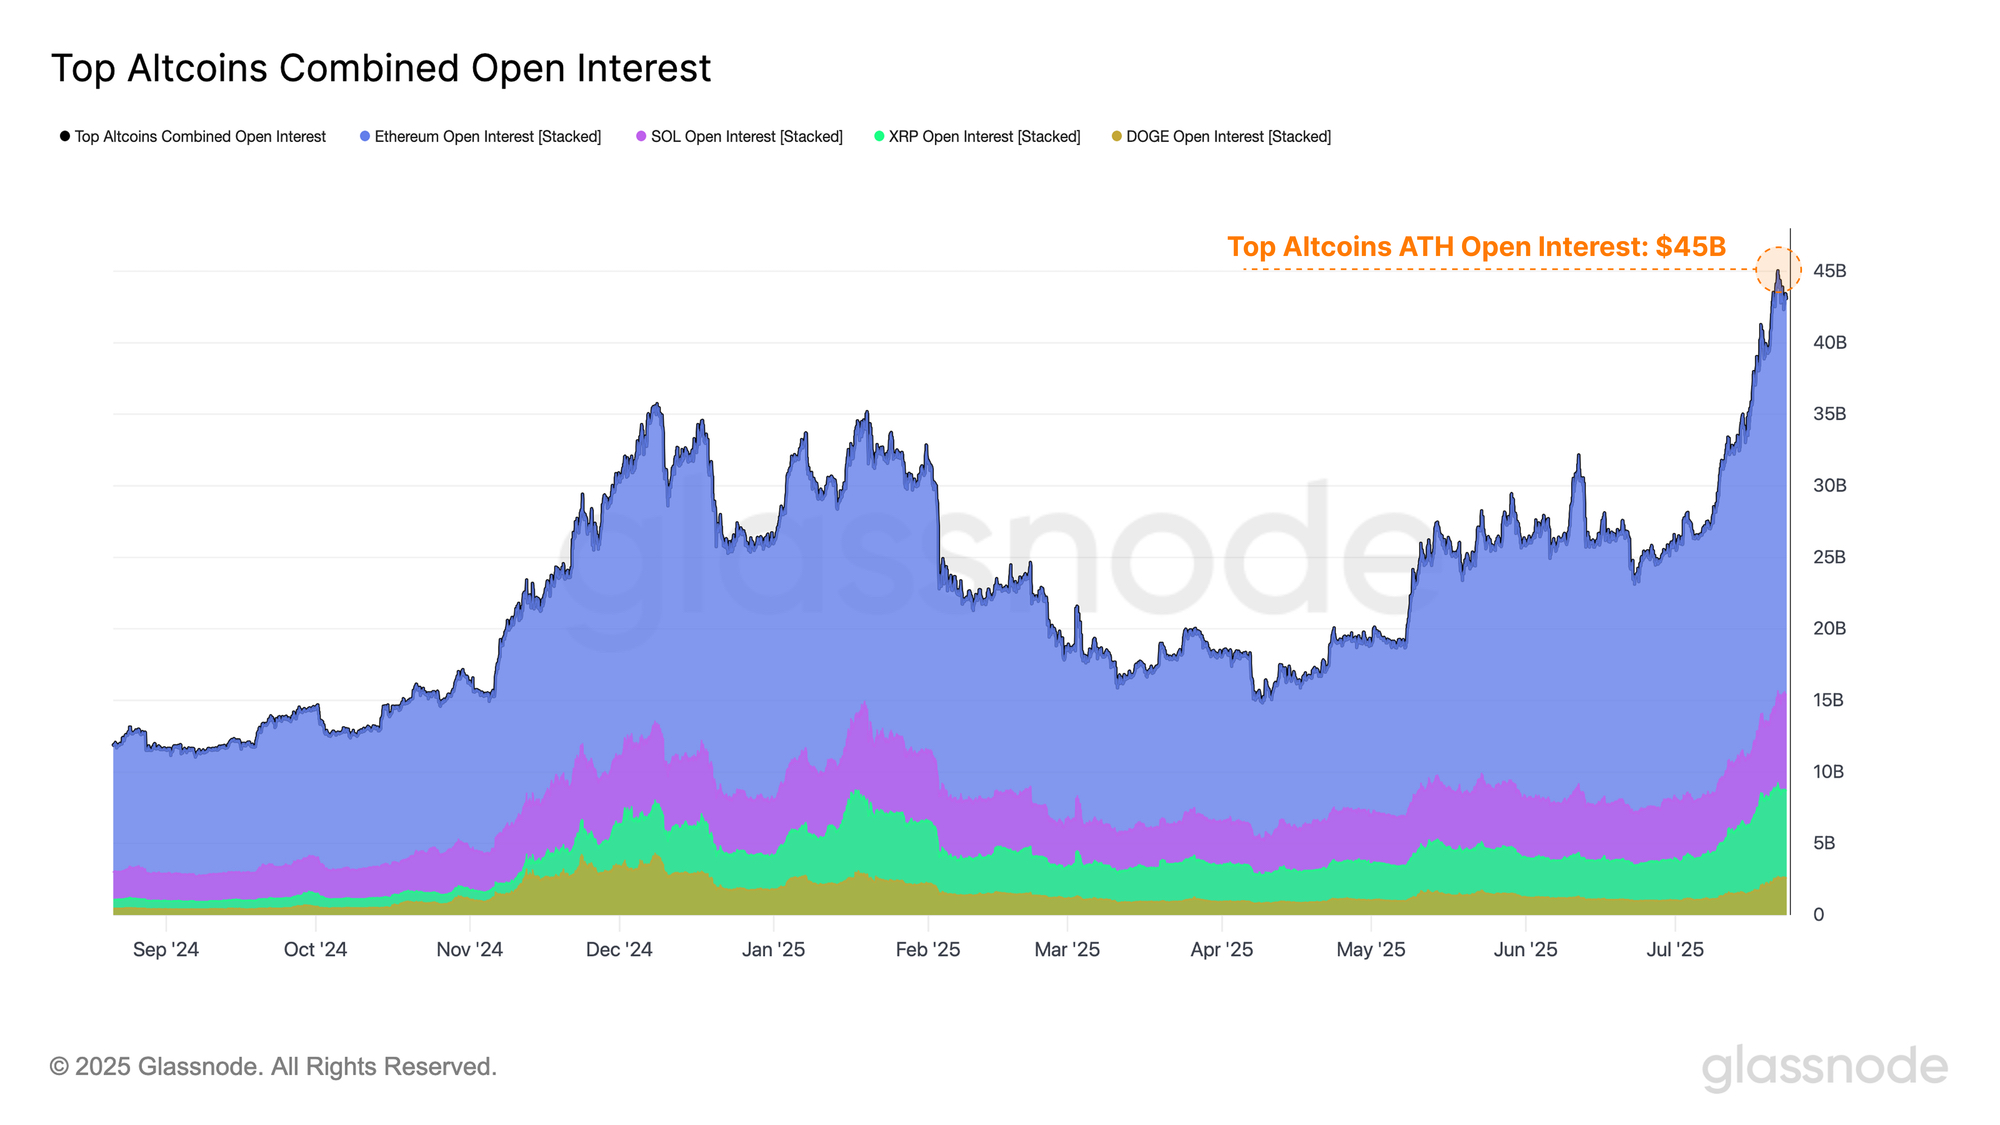
Since early July, the total open interest of major altcoins (Ethereum, SOL, XRP, DOGE) has surged from $26 billion to an astonishing $44 billion. The substantial rise in leverage in the futures market reflects a clear acceleration of speculative activity, indicating that traders are increasingly opening leveraged positions.
From a negative perspective, this situation suggests that the market is beginning to form a certain degree of bubble, making it more susceptible to severe volatility. It is important to note that high leverage often amplifies both upward and downward volatility in the market, potentially leading to a more reflexive and fragile market environment.
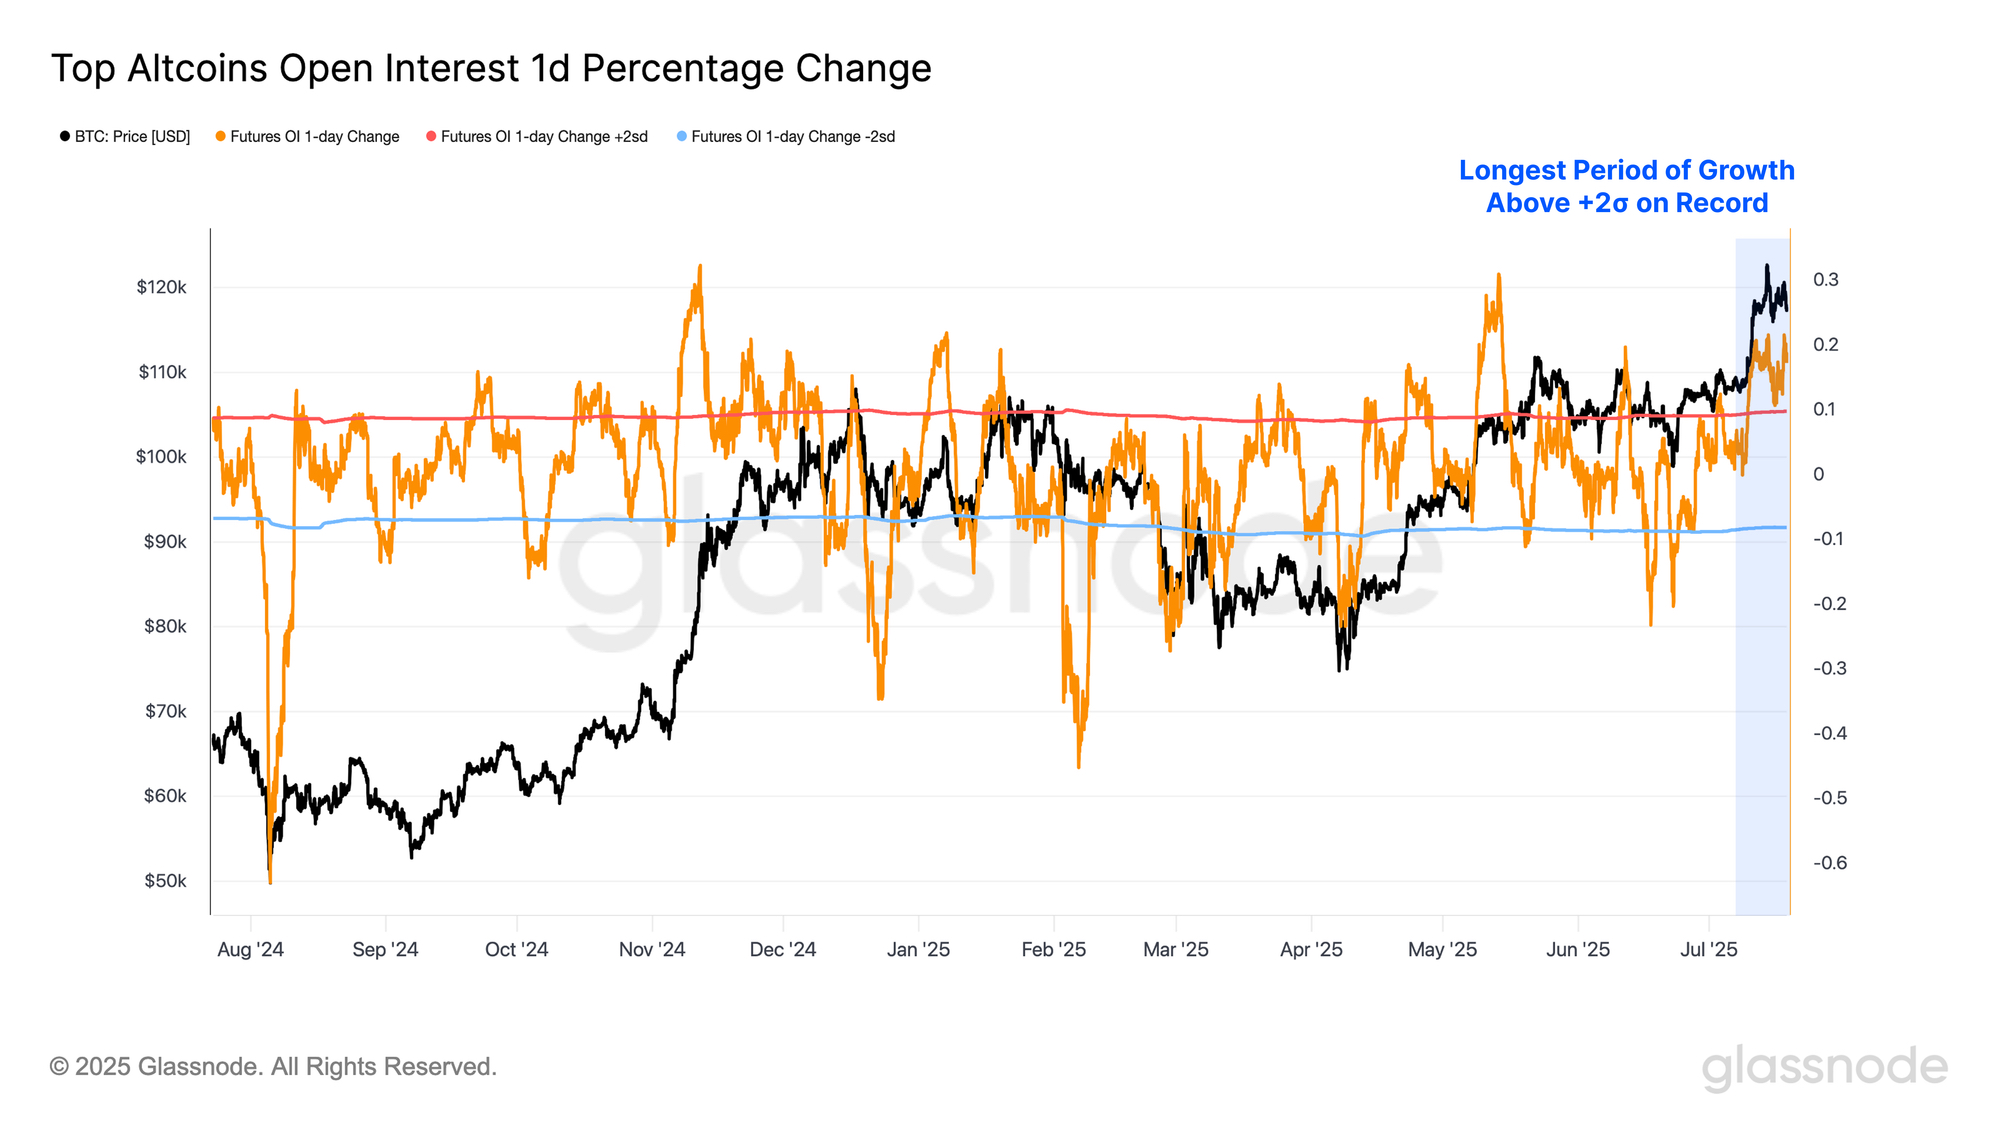
When evaluating the growth of total open interest, Glassnode found that the average daily increase over the past 12 trading days has consistently exceeded the +2 standard deviation threshold, marking the longest recorded duration of such an increase.
This not only emphasizes the significant scale of recent open interest expansion but also highlights its persistence, which may indicate a major shift in the speculative behavior of market participants.
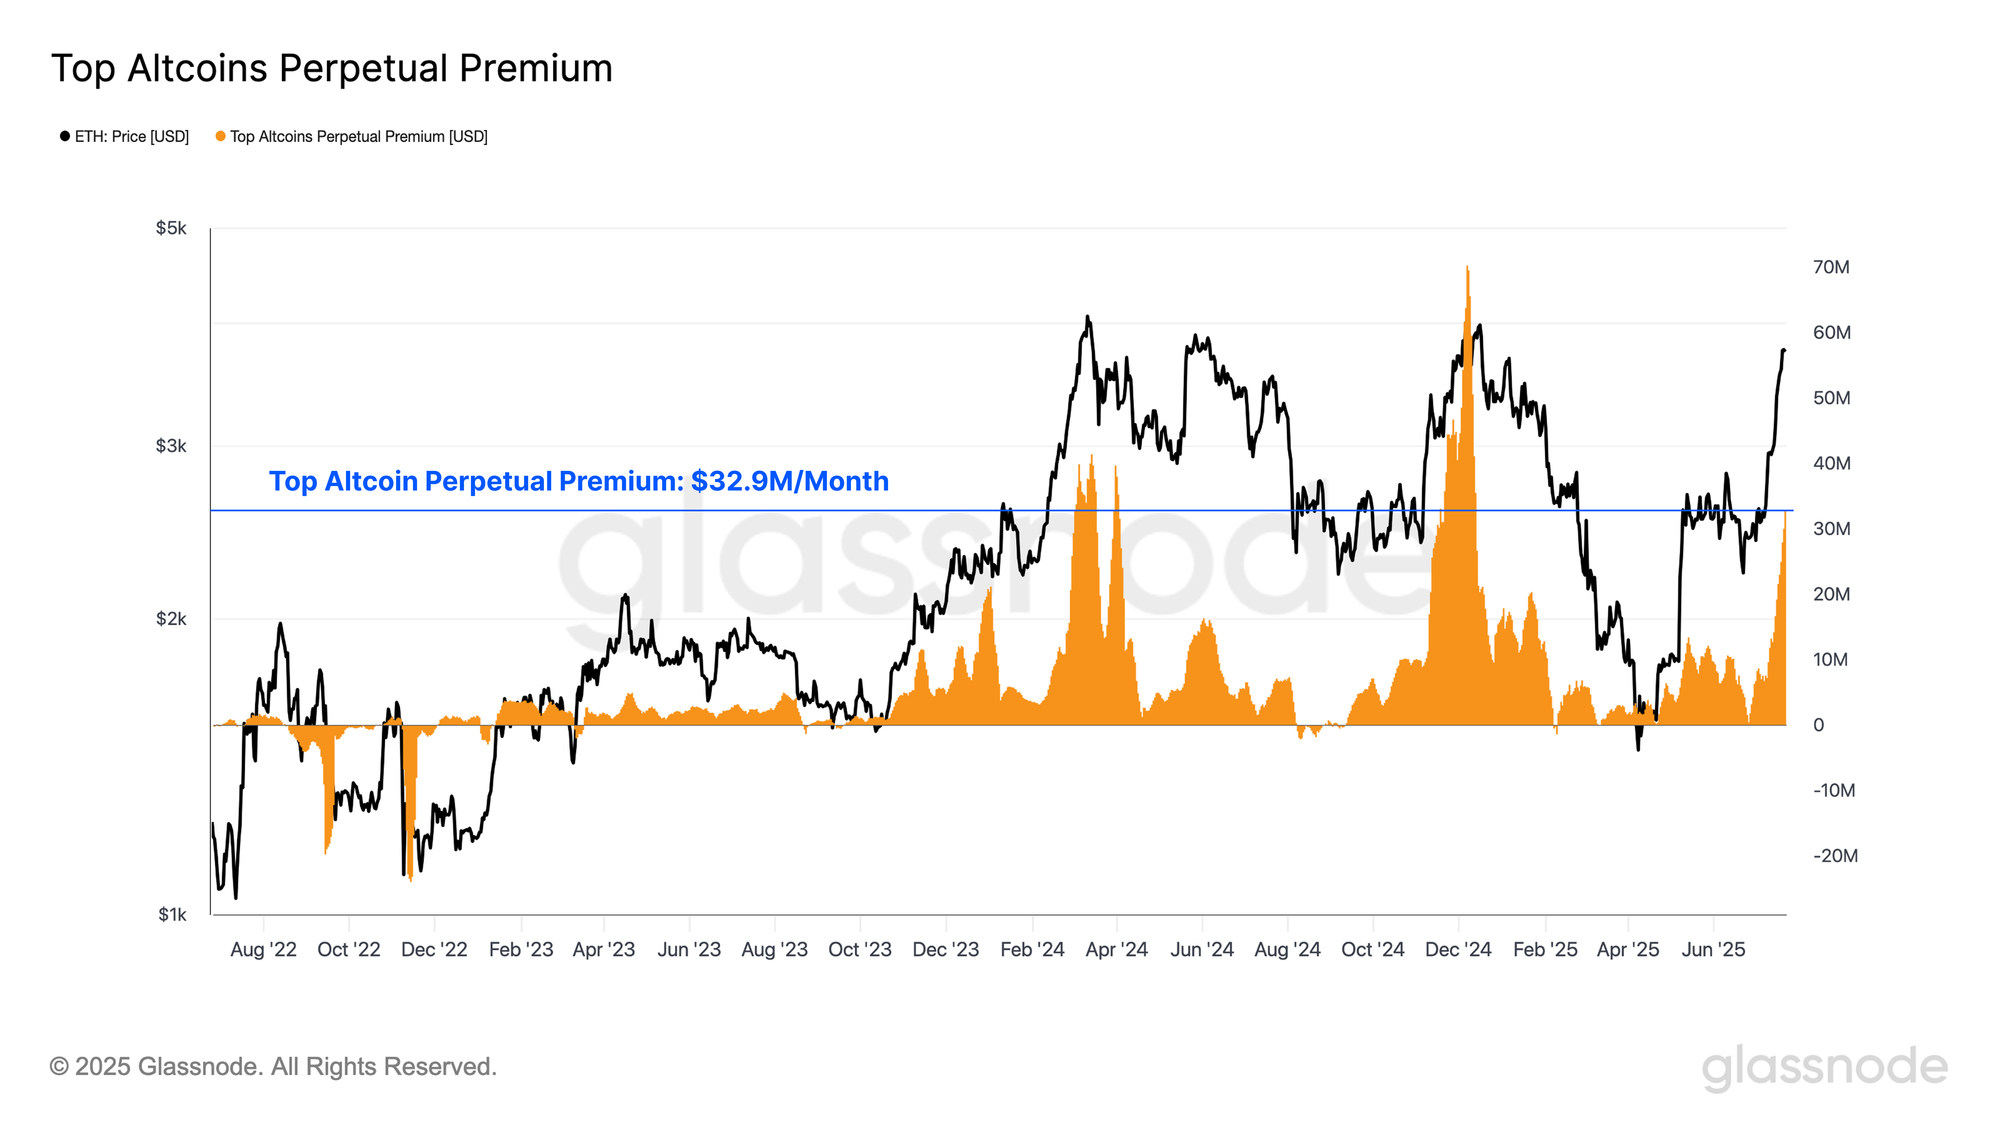
The cumulative monthly funding rates paid on long futures contracts over the past 30 days can serve as a practical indicator of speculative demand. Observing the total monthly funding rates of mainstream altcoin assets, it can be seen that the total cost of leverage has reached approximately $32.9 million/month.
This figure can be compared to the approximately $42 million/month observed when Bitcoin reached its all-time high in March 2024, but it is still below the peak frenzy level of about $70 million/month that occurred when Bitcoin first broke the $100,000 mark at the end of 2024.
This rise in financing costs indicates a significant increase in demand for leveraged long exposure and highlights that market participants are becoming increasingly optimistic and aggressive in their positions.
When assessing the dominance of open interest, it is evident that the expansion rate of Ethereum's leveraged positions is far outpacing that of Bitcoin.
Bitcoin's open interest share: 62%
Ethereum's open interest share: 38%
The share of Ethereum's open interest is currently on the rise, indicating a notable shift in market focus, with capital and speculative activity increasingly leaning towards Ethereum rather than Bitcoin.
To illustrate the significance of this trend, Ethereum's open interest share has now reached its highest level since April 2023, with only 5% of trading days recording higher values, marking it as a noteworthy event and a signal of increased speculative participation.

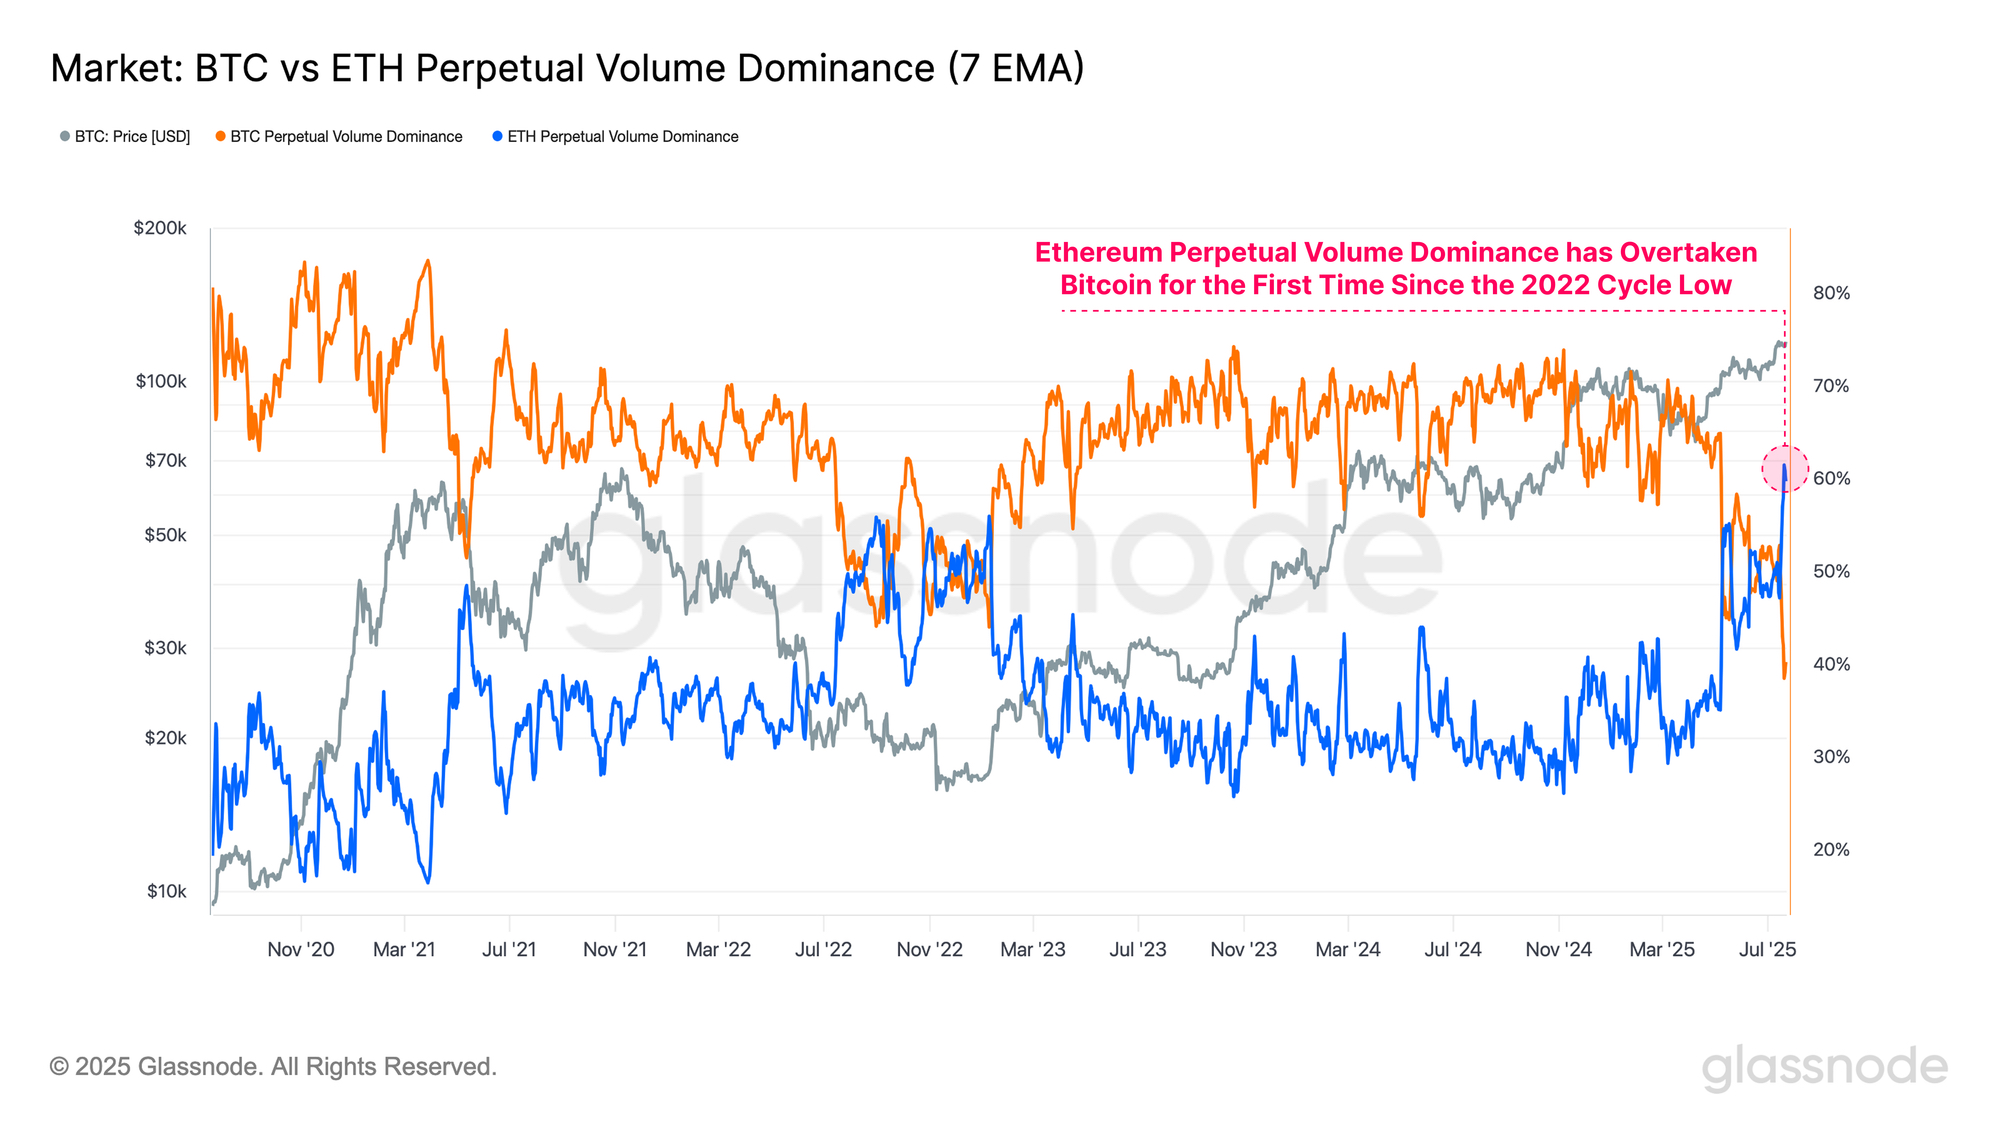
When evaluating the trading volume advantage between Bitcoin and Ethereum, this trend becomes even more apparent. Interestingly, the trading volume advantage of Ethereum perpetual contracts has surpassed that of Bitcoin for the first time since the cycle low in 2022, setting a record for Ethereum's largest trading volume advantage.
Such significant rotation data in trading volume further confirms the scale of funds flowing into the altcoin space, especially considering that this sector had struggled to attract sufficient speculative interest for months prior.
Ethereum Market Analysis
As Ethereum's price surges and leads the broader altcoin rally, we can focus on Ethereum's on-chain data to outline key pricing levels.
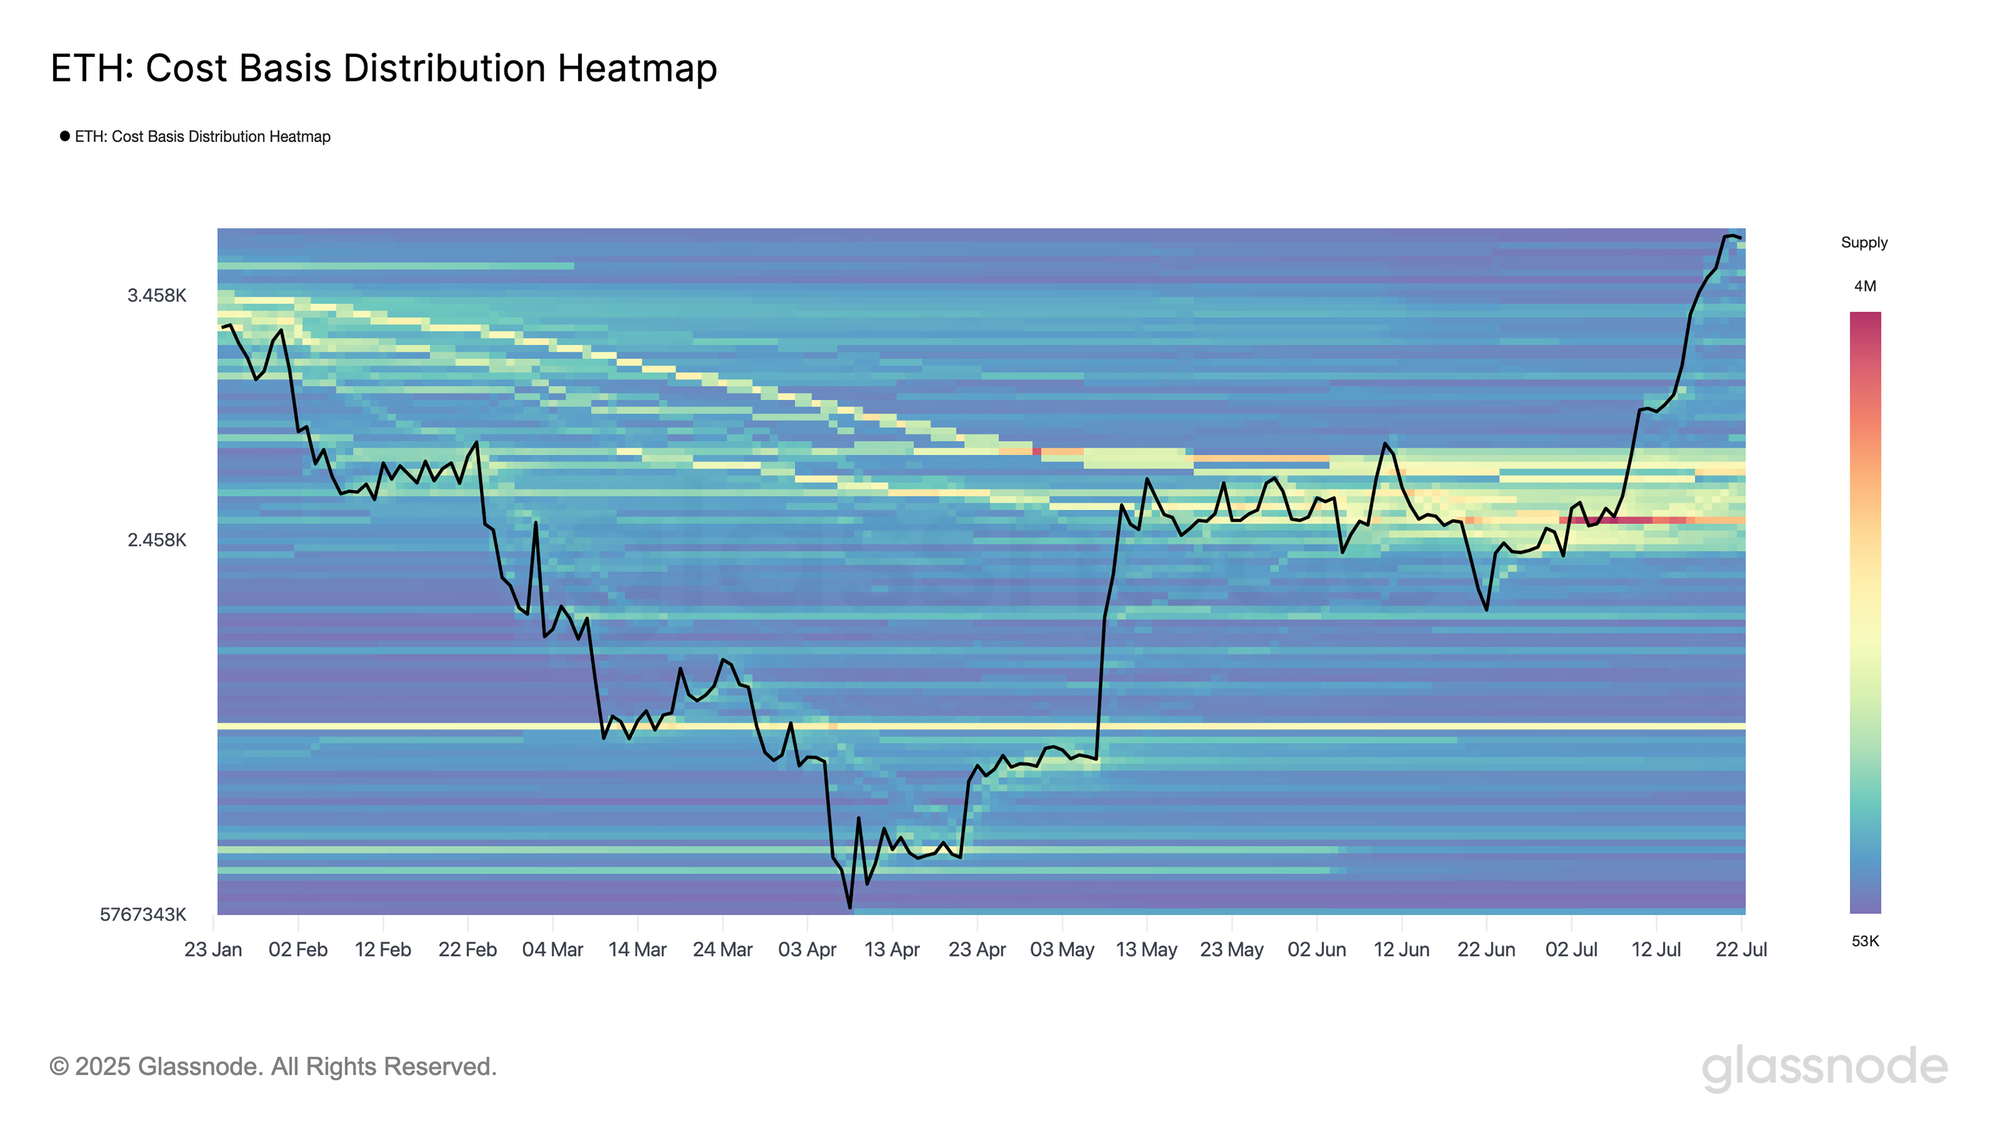
By analyzing the cost basis distribution of Ethereum, Glassnode notes that investors' cost basis levels are highly concentrated in the $2,400 to $2,800 range. The price has clearly broken through this dense supply cluster, currently trading within a price range with relatively low Ethereum holdings.
It is important to clarify that investors who previously purchased Ethereum in the $2,400 to $2,800 range have now begun to sell, while the $3,800 region is becoming a point where many investors choose to take profits.
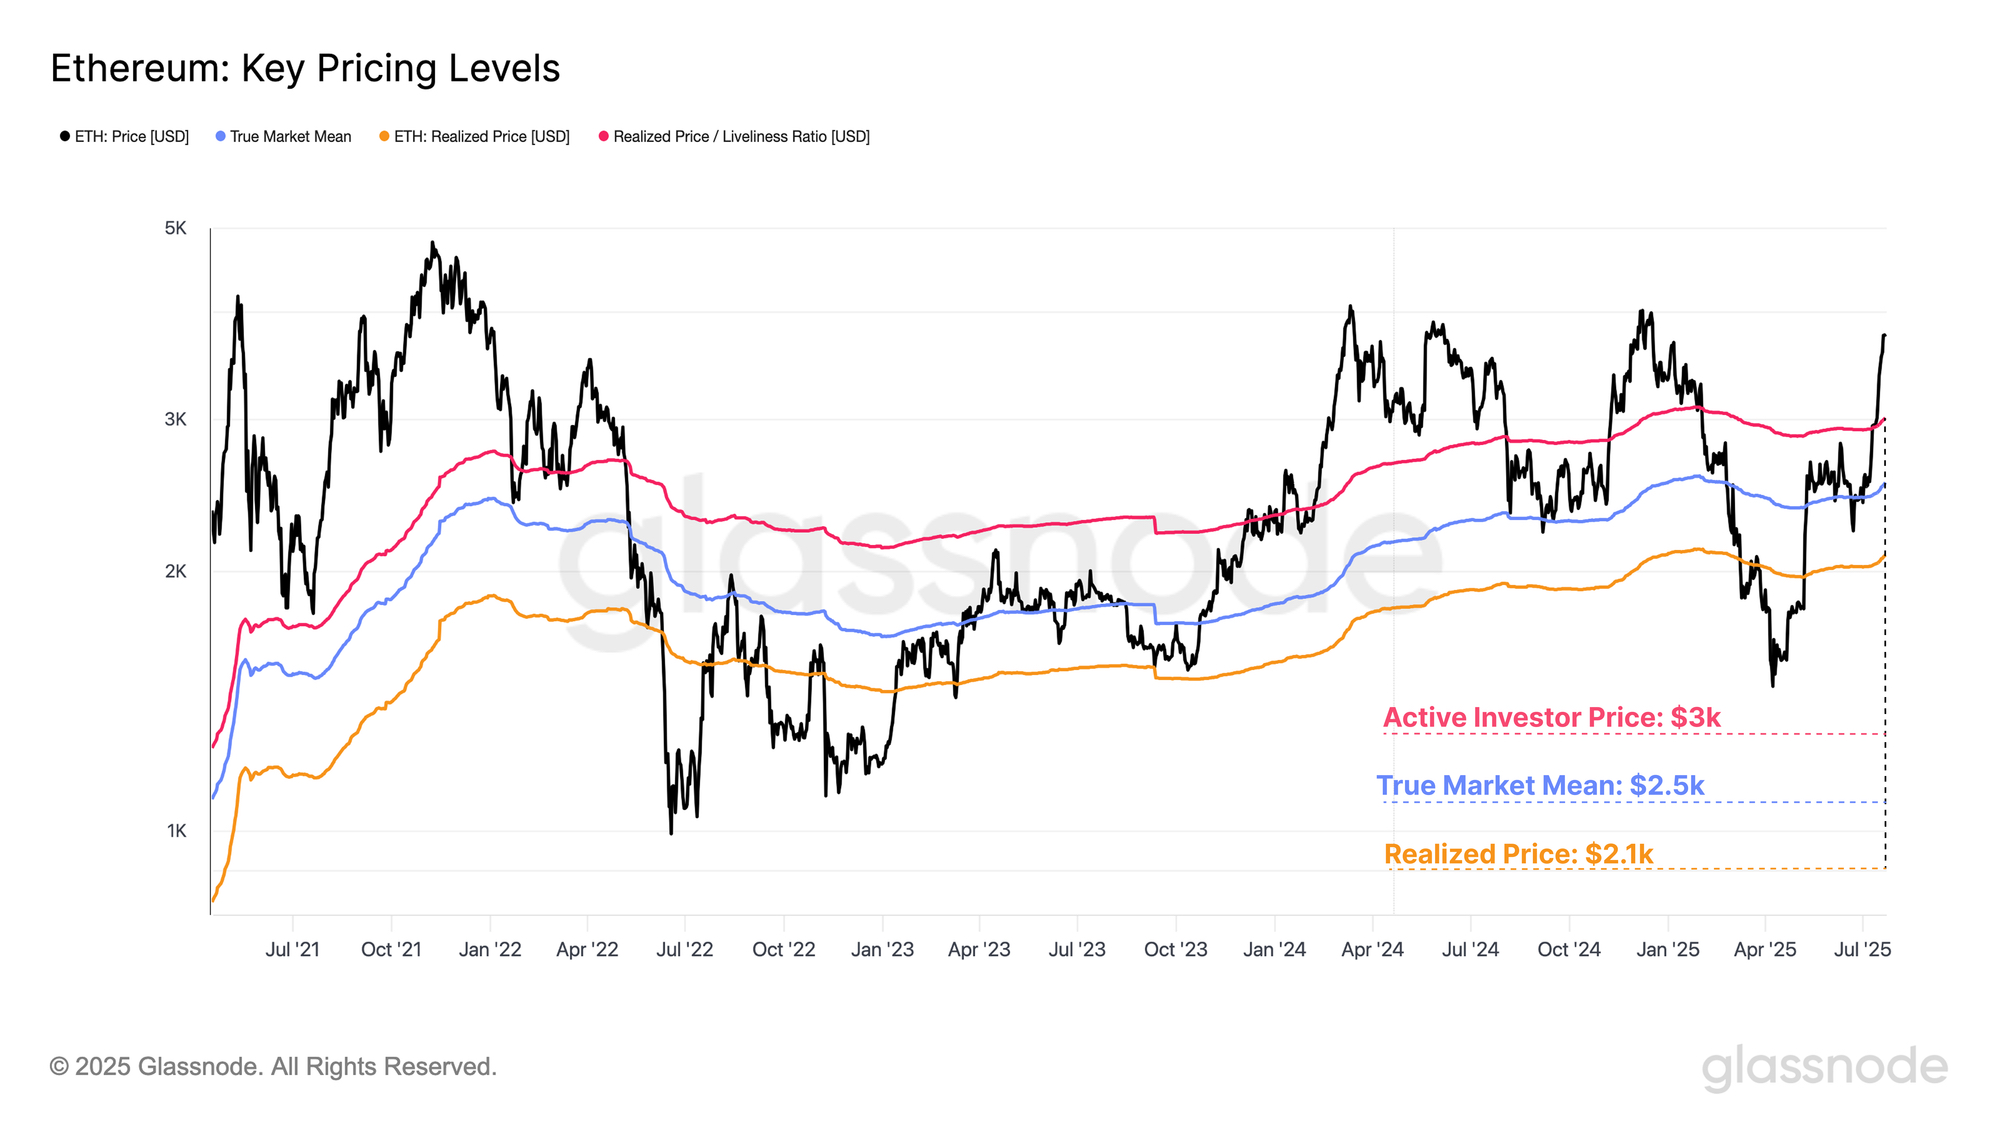
Comparative analysis reveals some commonalities between various on-chain valuation models of Ethereum and trading volume distribution data. Specifically, the True Market Mean and Active Realized Price provide two adjusted cost basis models that exclude long-term dormant and lost tokens. These adjustments offer a clear contrast between the average holding price cost of active investors engaged in economic activity and the realized price (i.e., the average cost basis per unit of ETH).
True Market Mean: $2,500
Active Realized Price: $3,000
Realized Price: $2,100
Notably, these valuation anchor points align with the dense token distribution range indicated in the aforementioned CBD metrics. This consistency supports the observation that Ethereum has now broken through a significant psychological price range. If Ethereum's price retraces to this range, it is likely to become an important support level.
To gauge the upward target of ETH in this rally, we can refer to the +1 standard deviation range of Ethereum's Active Realized Price. This range represents a threshold where selling pressure may begin to intensify. Currently, this +1σ level is at $4,500, and given the current market conditions, this area may be viewed as an overheated zone.
In the current cycle, this price range has constituted resistance as early as March 2024 and during the previous 2020 to 2021 cycle. Breaking through this threshold is often accompanied by a rise in market euphoria and the emergence of unsustainable market structures.
Therefore, $4,500 can be seen as a key level to watch for Ethereum's upward movement, especially if Ethereum's upward trend continues and the speculative bubble further intensifies.
Summary
Given the generally poor performance of the altcoin sector throughout the cycle, the recent surge in performance marks a significant shift in investor behavior. This is particularly evident in the perpetual contract space, where Ethereum's market share in perpetual contracts is continuously rising and has surpassed Bitcoin for the first time since the cycle low in 2022.
The surge in market attention has spread to the derivatives market, with the total open interest of major altcoins (ETH, SOL, XRP, DOGE) climbing from $26 billion to $44 billion in July alone. This rapid growth indicates that speculative positions are being established at an accelerating pace, while the market bubble continues to deepen. High leverage can amplify both gains and losses, leading to stronger reflexivity and making the market more susceptible to volatility shocks.
免责声明:本文章仅代表作者个人观点,不代表本平台的立场和观点。本文章仅供信息分享,不构成对任何人的任何投资建议。用户与作者之间的任何争议,与本平台无关。如网页中刊载的文章或图片涉及侵权,请提供相关的权利证明和身份证明发送邮件到support@aicoin.com,本平台相关工作人员将会进行核查。


